Single Source Ozone/PM2.5 Impacts in Regional Scale Modeling & Alternate Methods
|
|
|
- Shauna Powell
- 5 years ago
- Views:
Transcription
1 Single Source Ozone/PM2.5 Impacts in Regional Scale Modeling & Alternate Methods Presentation to R/S/L Workshop By Erik Snyder & Bret Anderson May 18, 2005
2 History PSD permitting applications with over 100 tpy of VOCs need to conduct impact analysis for ozone. Impact analysis guidance typically on a caseby-case basis by EPA Regional offices. Scheffe Tables generated in 1988 based on Reactive Plume Model II model outputs for screening analysis.
3 History (Cont.) late 1990s: Some Regions (Including Region 6) recommend using Scheffe Tables during time period of early 1990s to late 1990s. As science shifts that NOx is the pollutant to control, Scheffe tables based on VOC limited chemistry become inappropriate to use for most areas current: Multiple methods used, but many areas starting to experiment with using other methods including regional scale ozone modeling. This is one approach that has some promise, but do others exist?
4 The Third rail of PSD ozone impacts Outstanding issue, no clear guidance on what level is significant for impacts on 1-hr ozone or 8-hr ozone for single point sources. Only 1-hr and 8-hr guidance is for state-on state impact (NOx SIP call and CAIR). Inappropriate for single source level EPA correspondence (Joseph Cannon, AA of Air and Radiation with law firm in Dallas) addressing PSD question for a proposed plant in Texas. Letter from law firm summarizing meetings in Durham and D.C. with EPA indicated EPA was considering 0.3 ppb, but no definite significance level was decided and Cannon s response was to confirm the balance of the law firm s understanding on this issue. This seems to confirm that EPA was considering using 0.3 ppb, but had not made a determination on this issue.
5 Issues? GAQM - 5 years of met data (or 3 years MM5 data) are used for impact analysis. Episode days from regional modeling is a much more limited dataset (Often only 5-15 days available). This is a very limited subset of days that generate ozone for many areas. Are winds during the episode appropriate for determining worst case impacts? NOx is a ozone pre-cursor. Need guidance on how to conduct the required PSD ozone impact analysis.
6 Questions?? Is regional (4km grid) photochemical modeling sensitive enough for single point analysis? Will photochemical modeling result in false positive (modeling shows source impacts when none would be expected) or false negative results (modeling doesn t show source impacts when some impacts are expected). Due to limitations of # of days modeled (compared to 5 years of data) a positive test should indicate potential impact while a negative test should not be construed to indicate the source will have no impact.
7 Technical Analysis Questions Do you just look at change in daily peaks? Changes in all grid cells, or only the subset above a certain level that could impact attainment status? What ozone metrics should be evaluated? What level of detail should the analysis be conducted 1.0 ppb or 0.1 ppb, or something else.
8 Technical Analysis Questions (Cont.) Since limited days to evaluate impacts - Missouri suggested moving the proposed source to an upwind location of maximum area (keep same distance from nonurban/urban maximum ozone core). Need to be sensitive to change in background emissions and also if it is appropriate to put the source upwind if it is traditionally in the area downwind of local ozone maxima. SOME REAL CONCERN that this is not an accurate reflection of the problem and would not be defendable if challenged this is a limitation of days available and other methods should likely be evaluated other than Regional photochemical grid modeling.
9 Areas that have done point source impact regional modeling Oklahoma For a number of natural gas fired turbine EGUs, other large point sources using DFW modeling. Missouri DNR Multiple sources (mostly cement kilns) using old OTAG modeling episodes San Antonio For multiple facilities as they were developing their Early Action Compact 8-hr ozone demonstration (8-day episode) Dallas-Fort Worth Evaluated impacts from single county (Ellis) to aid in determining if the county should be included in 8-hr nonattainment area. Dallas-Fort Worth Evaluated impacts from groups of power plants in Oklahoma, Arkansas, Louisiana, and also looked at individual Louisiana power plants and their impacts on areas in Texas for 3 episodes (two 8-day episodes in 1999 and a 15 day Episode in 2000)
10 Modeling Tools Available Tools available in regional photochemical modeling to aid in evaluation Source apportionment techniques: APCA, APCA2, OSAT, PSAT, DDM, etc. (Utilizes an accounting procedure for generation and destruction of ozone based on the source of pre-cursors). Zero-out modeling - Analyses were conducted in which specific point source(s) emissions were removed from the model in separate sensitivity runs and compared with runs with the source(s) included.
11 San Antonio Modeling Evaluation of several groups of facilities including a new Toyota manufacturing facility, the retirement of one existing Coal fire power plant, removal of a group of power plants, removal of a group of cement plants. These impacts were based on San Antonio area Early Action Compact modeling for 8-day episode (September 13-20, 1999) Removal of CPS 750 MW coal fired power plant emission rate of 5.93 tpd of NOx (2164 tpy of NOx) Building of Toyota Plant results in approximately 0.34 tpd of NOx (125 tpy NOx) emissions and approximately 5 tpd VOC (1825 tpy) in These values were doubled for the 2012 runs.
12 Predicted Reductions in Ozone Concentrations at CAMS 58 after Removing Various Point Source Emissions within the SAER Comparison between 1999 (orange) and 2007 (blue). CPS Spruce 1 Coal Plant Removed* 0.08 parts per billion Remove All CPS Power Plants 0.74 parts per billion 0.97 parts per billion Remove Cement Plants 0.08 parts per billion 0.26 parts per billion Toyota Removed 0.0 parts per billion 0.01 parts per billion *based on 5.93 tons/day of NOx in 2007 only 0.0% 0.2% 0.4% 0.6% 0.8% 1.0% 1.2% 1.4% 1.6% 1.8% Percent Reduction in Ozone (ppb)
13 Predicted Reductions in Ozone Concentrations at CAMS 23 after Removing Various Point Source Emissions within the SAER Comparison between 1999 (orange) and 2007 (blue). CPS Spruce 1 Coal Plant Removed* 0.10 parts per billion Remove All CPS Power Plants 0.69 parts per billion 1.20 parts per billion Remove Cement Plants parts per billion 0.16 parts per billion Toyota Removed 0.0 parts per billion 0.01 parts per billion *based on 5.93 tons/day of NOx in 2007 only -0.2% 0.0% 0.2% 0.4% 0.6% 0.8% 1.0% 1.2% 1.4% 1.6% Percent Reduction in Ozone (ppb)

14

15 Toyota s 2007 & 2012 Impacts

16 CPS 750 MW unit 2007 & 2012 impacts
17 Houston Area Research Council H27 Report Evaluation Ellis county impacts on DFW area ozone levels using 1 st round of DFW basecase modeling for 8-day episode (August 15-22, 1999) Northwest corner of Ellis has eight cement kilns and a secondary steel foundry with approximately 11,000 tpy of NOx emissions. Population in NW corner is less than 50,000.
18 Episode Max 8-Hour O3 with Ellis Co. Source Contributions August 1999

19 Ellis Co. Source Contributions: 13:00 on 18 August 1999
20 Ellis Co. Source Contributions: 16:00 on 19 August 1999

21 Ellis Co. Source Contributions: 13:00 on 22 August 1999
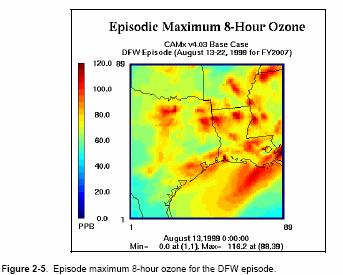
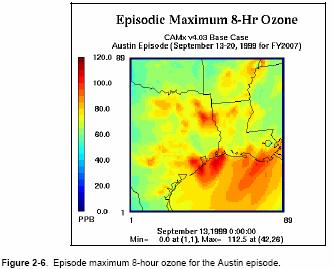
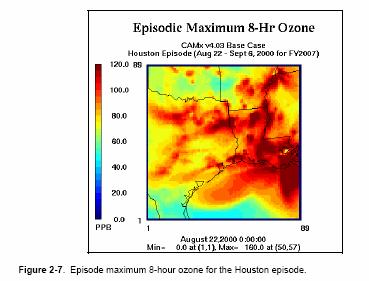
22 Houston Area Research Council H35 Phase I Report rt_7feb05.pdf Evaluation of single EGUs on ozone levels within 3 Texas ozone episodes August 15-22, 1999 (Dallas/NETAC Episode) September 13-20, 1999 (Austin/San Antonio Episode) August 22 September 6, 2000 (Houston/Beaumont Episode)
23 DFW 3 TX area episodes Grids
24 Receptor Areas within Texas
25 2001 Baton Rouge Area Attainment Demonstration 2001 Houston Galveston Area Attainment Demonstration 2000 Dallas-Fort Worth Area Attainment Demonstration EGUs within the 36km - LA s 3 sources
 23.")
26 Dolet Hills EGU (Maximum 8-Hr Impacts) 23.2 NOx tpd (8468 tpy Avg.)
27
28
29
 39.")
30 Rodemacher EGU (Maximum 8-Hr Impacts) 39.0 NOx tpd (14,235 tpy Avg.)
 Austin 7.3 NOx tpd (2664.5 tpy Avg.) Houston - 32.")
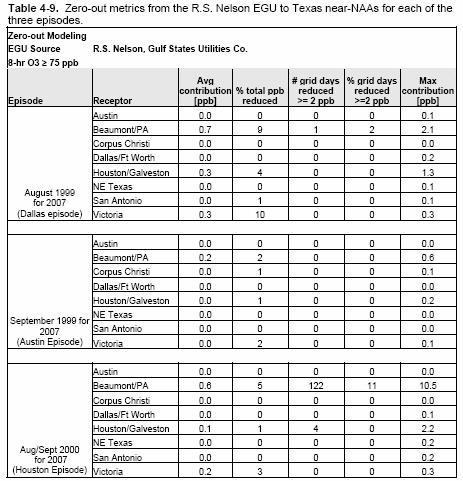
31 R. S. Nelson EGU (Maximum 8-Hr Impacts) DFW NOx tpd (11,972 tpy Avg.) Austin 7.3 NOx tpd ( tpy Avg.) Houston NOx tpd (11,972 tpy Avg.)
32 APCA/Zero-out metrics The magnitude metric is quantified by the highest anthropogenic contribution from the source to receptor pairing in any grid-hour or grid-day exceeding the threshold using APCA or zero-out analysis, respectively. APCA measures a second metric for magnitude by calculating the average anthropogenic contribution from all grid-hours over a threshold in a day, and reporting the highest daily average contribution in both ppb and as a percentage of total ozone averaged over grid-hours exceeding the threshold. Frequency metrics for both APCA and zero-out analyses count the number of grid-hours and grid-days, respectively, over the threshold, when the anthropogenic contribution is at least 2 ppb. The frequency metric is expressed as both a number and percentage of total grid-hours or grid-days over the threshold. The metric for relative amount using APCA analysis is an episode average of a state s anthropogenic contribution relative to the total anthropogenic contribution using only grid-hours exceeding the threshold.

33 Metrics Analysis TX area
34
35 Wrap-up and Recommendations Looking at only areas around the monitors is not sufficient need to be evaluating the whole fine grid area. Need to be evaluating impacts at tenths of a ppb (0.1 ppb) in order to maintain high resolution of details. Caution on the representativeness of using a limited number of episode days when EPA guidance is to use 3 years of MM5 type data or 5 years NWS. Some episodes may not be appropriate to evaluate ozone impacts due to the winds of the episode and the location of the source. Do not recommend relocating source to a pseudo-site other than potentially as a sensitivity run. If the episode is inappropriate for evaluation purposes, a potential option is to do a detailed statistical analysis of the transport winds during all ozone episodes and evaluating against the location of the proposed source. These issues should be discussed with the EPA Regional Modeling Contact.
36 Wrap-up and Recommendations 8-hr modeling results are being utilized in a relative sense, not an absolute sense. Many modeling systems in the last few years seem to have under-prediction biases. Furthermore, the limited number of days likely underestimates the number of days that could test positive for impacts compared to a 3-yr MM5 based analysis. Recommend using a 75 ppb (8-hr) as a cut-off value and not look at impacts in grid cells with source+everyone below 75 ppb. If impacts are over a large area of elevated ozone, higher cutoffs could yield some distribution of the impacts. Other techniques to describe the distribution such as histograms could be used if large areas of impact are predicted to address potential averaging concerns.
37 Wrap-up and Recommendations Due to the many caveats (including # of days), this procedure should only be applied as a positive test, and never as a conclusive negative test that a source would not have an impact. This procedure should not be used for evaluation of the control strategies in attainment demonstration simulations to try and show a control strategy does not have impacts. Plume-in-grid (PIG) with chemistry built into the plume should be used when possible, as this is more technically sound. Individual Source apportionment techniques and each methods strengths and weaknesses should be understood and discussed with the Regional Modeling Contact in developing a protocol for the analysis.
38 Wrap-up and Recommendations Multiple metrics could be evaluted in addition to the daily average and maximum changes at grid cells above 75 ppb. Other ozone metrics that could be evaluated between the base run and a base run with the source include ozone exposure metrics of: Σ[number of grid cell-hrs above 75 ppb], Σ[grid cell hrs * ozone level above 75 ppb], Σ[grid cell hrs * ozone level above 75 ppb^2], % of ozone reduction, etc. The impacts should be evaluated on an individual day basis, and the maximum impact level should be tied to the same period that has a grid-cell value above 75 ppb. For this approach to be used in a regulatory framework, a definition of Significant Impact will need to be resolved. These approaches are experimental currently and are continuing to be refined and should be treated as such.
39 What if you don t have regional modeling to use (or the episode is inappropriate) Other non-regulatory models exist that could be used: Lagrangian Particle models with chemistry modules (LRPM, etc.) SCIPUFF/SCICHEM,. These issues should be discussed with the Regional Modeling Contact as the use of these models would require evaluations in accordance with the GAQM guidance for non-guideline models.
40 Thanks to Contributors Steven Smeltzer Alamo Area Council of Governments Texas Commission on Environmental Quality and Houston Area Research Council studies ENVIRON Missouri DNR ODEQ QUESTIONS?