Chromophoric Dissolved Organic Matter (CDOM) in United States Estuaries. Robert F. Chen, Bernie Gardner, Wei Huang & Francesco Peri
|
|
|
- Adele Arabella Patrick
- 5 years ago
- Views:
Transcription

1 Chromophoric Dissolved Organic Matter (CDOM) in United States Estuaries Robert F. Chen, Bernie Gardner, Wei Huang & Francesco Peri
 Absorbs light Affects remote sensing of")
 Coastal carbon cycling Easily measured: seawater")
2 CDOM in Coastal Waters Chromophoric Dissolved Organic Matter (CDOM) Absorbs light Affects remote sensing of Chlorophyll Tracer of total dissolved organic carbon (DOC) Coastal carbon cycling Easily measured: seawater fluoresces
3 Fluorescence vs. Absorbance 6 Comparison of Estuaries 5 Absorbance (m -1 ) Fluorescence (QSU) Boston Delaware Chesapeake SF Bay SF South Bay SD Bay 1/99 SD Bay 9/99 Miss00 W.Fl.Shelf

4 United States Estuaries Studied
5 CDOM vs. Salinity Comparison of Estuaries 70 Fluorescence (QSU) y = -1.21x R 2 = 0.83 y = -1.36x R 2 = 0.75 y = -3.05x R 2 = 0.70 y = -7.82x R 2 = 0.87 Boston Delaware Chesapeake SF Bay SF South Bay SD Bay 1/99 SD Bay 9/ y = -0.84x R 2 = 0.89 y = -0.59x R 2 = 0.77 y = 5.49x R 2 = 0.44 y = 4.61x R 2 = Salinity Miss00
6 Observations CDOM is generally conservative Linear CDOM vs. Salinity relationships Non-linear relationships suggest in situ production or degradation Wetlands Sewage Photodegradation Freshwater endmembers depend on watershed characteristics High resolution allows better understanding

")


7 The Integrated Coastal Observation System (ICOS) ECOShuttle 8 knots underway T, S, DO, Chl,, CDOM, OPC Pumping System Adaptive or Continuous Sampling TOC/TN, nutrients 2-30 meters


")
8 Mini-Shuttle Towed Instrument Package Temperature, Salinity, CDOM, Chl OBS, DO, UV radiance Tow at 5 knots Tow-yo to resolve vertical variation (10 cm-5 5 m) Teflon diaphragm pump
9 List of Estuaries Studied Boston Harbor/Mass Bay: June, 1998 Chesapeake/Delaware Bays: Aug 1998 San Diego Bay: Jan 1999 San Francisco Bay: June 1999, Oct 2000 Mississippi River Plume: June 2000, Aug 2001, Aug 2007 Plum Island: Oct 2000, July 2001 Apalachicola Bay: Sept 2002 Hudson River/New York Harbor: June 2003, June 2004, Sept 2004, June 2005, Oct 2006, Apr 2007 Hudson River Plume: May 2004, Apr 2005, May 2006 Neponset River: July, Sept, Nov, Dec 2001, Aug 2002, Apr 2003 Santa Barbara: September 2001 Neponset Watershed: Mar 2006-present (monthly)
10 CDOM-Salinity evolution over time Hudson River Plume
11 (1)- 06 Production by phytoplankton 06_63a

12 Inshore-Excess CDOM, contoured Chl
13 05_17 (2)-Degradation?
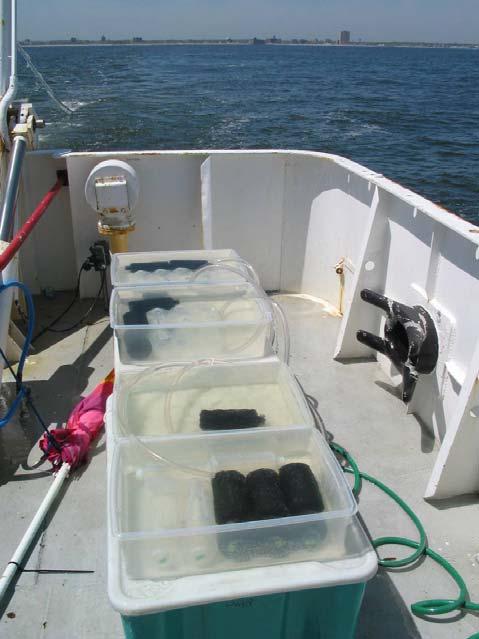
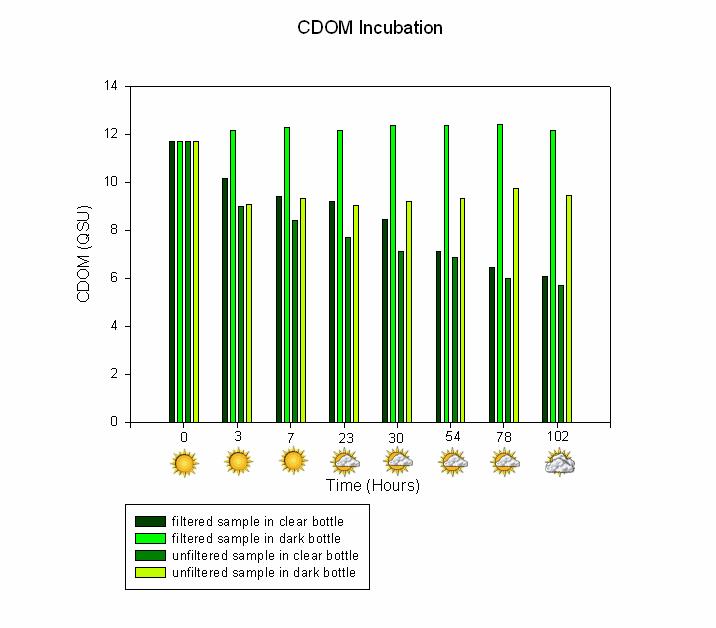
14 Incubations
15 (3)-Varying Freshwater Endmember 05_70
16 (4)-Sewage Effluent Ocean Counties Utility Authority Northern water pollution control facility Brick Township, NJ 32 mg/d = 1.4 m 3 /s 82a
17 Hudson Estuary Summary High resolution allows examination of complex processes Fresh (and salt water) endmembers vary with time on the shelf CDOM is produced during primary production Seen in 20-40% of data Edge of plume higher salinity, subsurface Spatially coherent with Chlorophyll fluorescence CDOM is photo/bio-degraded in river plumes 0-20% of data More during downwelling conditions Anthropogenic impacts are evident on the shelf
18 Mississippi River Plume Cruise Track for June 2000 Cruise Ln 33 Ln16 Ln 14 Ln Ln 32 Ln 30 Ln 2 Ln 26 Ln 20 Ln 3 Ln
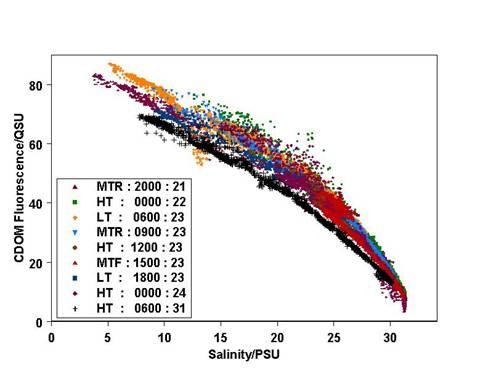
19 19.5 Mississippi River Plume CDOM Fluorometer and Density On north-south line at o W : June (Ln22) 19.0 CDOM/QSU Depth/m 20 B C A Color contours : CDOM/QSU 25.0 Contour lines : σ θ (kg/m 3 ) North Latitude 0.00
20 Thin Layers in the Gulf Of Mexico
21 Mississippi 2000: LN 22: Profile C Depth/m CDOM/QSU Temperature/C σ/(kg/m3) Chlorophyll/(μg/l)
22 Influence of Wetlands (Outwelling) 50% of wetlands have been destroyed in the US Coastal development impacts wetlands 7% brown marsh in Florida marshes Wetlands provide DOM to estuaries

23 San Francisco Bay Suisun Bay South Bay

24 Suisun Bay drains the only salt marsh remaining in the San Francisco Bay Watershed


25 Mississippi and Atchafalaya Rivers Atchafalaya Mississippi River Atchafalaya River Mississippi

26 Neponset River
 Fresh water tidal wetlands increase export without impacting the mixing curve. (Atchafalaya vs.")
27 Tidal Wetland Derived CDOM Export Tidal wetlands contribute significantly to CDOM export. Reflected in mixing curve where most of wetlands are in estuarine portion. (Neponset, San Francisco Bay, Hudson River, Mississippi River) Fresh water tidal wetlands increase export without impacting the mixing curve. (Atchafalaya vs. Mississippi) In large, complex estuarine systems, it is difficult to attribute export to specific sources. (Chesapeake Bay)


28 Hudson River Estuary Hackensack Manhattan Newark Bay Raritan Staten Island
29 Hudson River Estuary June, 2004 Raritan Hudson Schmutz? Port Richmond Sewage Outfall
30 Hudson Plume CDOM vs Salinity for CDOM (QS y = x R 2 = y = x R 2 = y = x R 2 = y = x R 2 = _1 2005_ Linear (2005_2) Linear (2006) Linear (2005_1) Linear (2004) Salinity
 (Source:")
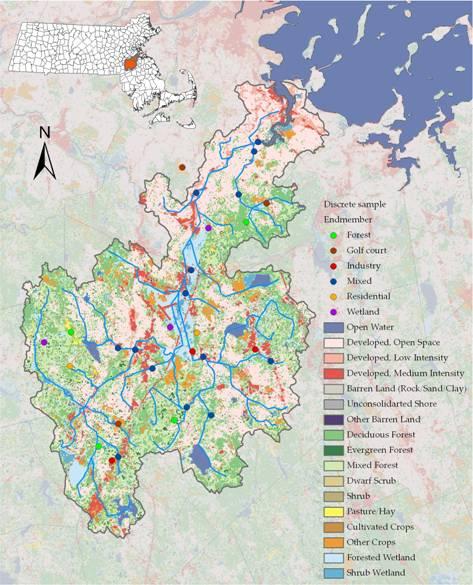
31 Neponset Watershed 250 km 2 14 cities and towns ~300,000 people 50 km long Freshwater flux is about 2 m 3 s -1, (<2-40 m 3 s -1 ) (Source: NepRWA)

32 Land Cover Forest Residential Wetland Industry Golf course Golf Course 2% Other 17% Industry 5% Forest 34% Residential 38% Wetland 4% Data Source: Mass GIS
33 Two-year Data 6 Seasonal Changes of Endmember CDOM in Neponset Watershed Snow (inch) CDOM (QSU) Growing Dregree Days 1 Precipitation (inch) Mar 06 Jun 06 Jul 06 Aug 06 Sep 06 Oct 06 Snow Precipitation Precipitation Residential Endmember Growing Degree Days Golf Course Endmember Industrial Endmember Forest Endmember Wetland Endmember Nov Dec Jan Feb 07 Time Mar Apr May 07 Jun 07 Jul 07 Aug Sep Oct 07 Nov 07 Dec 07 0
34 Summary CDOM is generally conservative Chesapeake, San Diego, Mississippi Non-linear relationships suggest in situ production Wetlands-Neponset, Achafalaya,, Plum Island Sewage-Hudson Freshwater endmembers depend on watershed characteristics Rainfall, season, land use Remote sensing and hydrodynamic modeling allows prediction of CDOM in coastal waters