Climate Change. Tom Ackerman. University of Washington. Joint Institute for the Study of the Atmosphere and Ocean Department of Atmospheric Sciences
|
|
|
- Arron Cobb
- 5 years ago
- Views:
Transcription
1 Climate Change Tom Ackerman Joint Institute for the Study of the Atmosphere and Ocean Department of Atmospheric Sciences University of Washington
2 The era of procrastination, of half measures, of soothing and baffling expedients, of delays, is coming to its close. In its place we are entering a period of consequences. Winston Churchill, 1936

3 Scientific Consensus on Climate Change Carbon dioxide (CO 2 ) and other greenhouse gases warm the earth surface; higher concentrations produce a warmer surface Human activities have increased the concentration of the major greenhouse gases since ~1750; rate of concentration increase is increasing Average global temperature has increased ~0.8~ 0.8 C since Warming since the 1950s very likely (>90% chance) due to human increases in GHG. Evidence of change is increasingly evident throughout the Earth s system Without drastic changes in current emissions trends, greenhouse gas concentrations will increase dramatically over the next century and beyond. Intergovernmental Panel on Climate Change (IPCC)
4 Blue line is 10-year running mean; Green bar is 2006 (provisional value)

5 Arctic Sea Ice National Snow and Ice Data Center
6 Longer term trends
7 Solar energy in Thermal energy lost to space; must balance absorbed solar energy Atmosphere (Absorbers are Gases -- CO 2, water vapor, and ozone -- and Clouds) Ground Thermal radiation from the atmosphere Greenhouse effect
8 CDIAC, US Department of Energy Annual Average CO2 Concentration Mauna Loa, HI (Elevation: 12,000 ft.) Concentration (ppm) Year
9 Antarctic Ice Core Data Mauna Loa Data CO2 Concentration, ppm CO2 Growth rate 1000 to 1800 = ~ Year

10 GTonnes of CO2 produced from fossil fuel usage M a u n a L o a D a t a


11 CO2 Growth Rates (per year)

12 U.S Total CO 2 emission s since 1950 in billions of tons European Union Russia 68.4 Canada 14.9 Ukraine 21.7 Poland 14.4 Kazakhstan 10.1 China 57.6 Japan 31.2 Mexico 7.8 Trinidad and Tobago South Africa 8.5 Kuwait United Arab Emirate s India 15.5 Australia 7.6 Time, 9 April 2001

13 Global Climate Models Understanding the past, predicting the future 4D model: Latitude, longitude, height, time Equations solved on grid with ~250 km resolution Topography averaged to horizontal resolution Captures large scale well, but not local scale
 Attribution of current")
14 Simulated Temperature change (IPCC) Attribution of current change
15 Projected Carbon Dioxide Emissions Emissions Atmospheric Concentration A2 (business as usual) A1B A2 A1B B1 B1 (utopia) Scenarios depend on population, economic projections, future choices for energy, governance/policy options in development
16 Scenarios Projected warming IPCC: Summary for Policy Makers, Figure 5 Updated 13 Feb 2007
17 Projected Annual Average Surface Temperature Change: minus Average of 21 climate models forced by Scenario A1B.
18 Projected Annual Average Precipitation: minus Scenario A1B Drier Wetter Robust drying of the subtropics, 20-35N&S. Stippling is where the multimodel average change exceeds the standard deviation of the models
19 Projected Soil Moisture Change: minus Scenario A1B Drier Wetter
20 Climate changes due to human activity Virtually certain > 99% Very likely >90% Likely >66% More likely than not > 50% IPCC 2006
21 Changes in extremes Distribution (Gaussian) changes in mean or changes in shape Gaussian Example Probability DF Cumulative DF Change in mean # of events fraction of events intensity More intense events intensity Change in shape # of events fraction of events intensity intensity
 Wheat (17%) Sugar Cane (8%) Maize (6%) Nuts (5%) Casava (4%) Other (34%) These are countries with a large population of the very poor who depend heavily on agriculture")
22 Food availability and the developing world 800 M people are malnourished today 95% are in the tropics/subtropics Lobell et al (2008) What food do they eat? Rice (26%) Wheat (17%) Sugar Cane (8%) Maize (6%) Nuts (5%) Casava (4%) Other (34%) These are countries with a large population of the very poor who depend heavily on agriculture for both food and income.
23 Extreme precipitation events: the wet gets wetter Increase in extreme precipitation greater than increase in mean Warmer climates lead to more intense precipitation events, even when the total precipitation amount is reduced slightly (IPCC AR4) Extreme precipitation matters more than the mean for erosion and natural hazards Leyte, Philippines Landslide, 17 Feb 2006 (U.S. Navy photo by Petty Officer 1st Class Michael D. Kennedy
24 Projected Changes in Africa: minus Annual DJF JJA Drying in Northern & Southern Africa projected by more than 16 of 21 models: 10-15% of annual mean in S. Africa; 20-30% in N. Africa (regions that are marginal for agriculture today). About 20% wetter in E. Africa The models diverge for the Sahel: half the models show drying Scenario A1B
25 A word of caution Projections based on global models with coarse resolution Regional features have large uncertainties We have techniques to guide us Statistical downscaling Regional models embedded in a GCM Little of this has research has been done for the developing world Lack of data Lack of support Following example for Pacific Northwest

26 Regional climate change Use nested, high-resolution modeling Limited number of centers for this type of research, but growing Climate science in the public interest


27 Temperature trends 2020s 2050s 2090s Change in Winter Temperature (degrees C)

28
29 Large Drop in Snowpack in the Mountains
30 Streamflow Impacts Higher winter streamflows Earlier and lower peak runoff (mid/high basins) Lower late spring streamflow Lower, warmer summer streamflow Projected streamflow changes in the Quinalt and Yakima Rivers ~2050s to 2080s ~2050s to 2080s +3.6 (~2050s) to +5.4 F (~2080s)
31 Salmon Impacted Across Full Life-Cycle Floods Warm, low streamflow?? Early peak flows
32 Impacts of climate change Increased temperatures Reduced crop yields and reduced nutritional content in developing countries Loss of water storage in mountain glaciers and snow reduced river flow in amount and timing Additional stress on wildlife species, particularly fish that are adapted to current water cycles

33 Impacts of climate change Changes in precipitation Decreased precipitation in dryer areas Reduced yields and abandonment of some areas Uncertain impacts on monsoons likely to be more variable Increased flooding in equatorial rain areas and midlatitudes Soil erosion and nutrient leaching Likely increase in strength of hurricanes/typhoons Hurricane Katrina

34 Impacts of climate change Sea-level rise minimum of.3 to.5 m by 2100 Could be more if ice sheets collapse Changes in pests and pathogens: unknown
35 Solutions
36 Mitigation Solving the Global Warming Problem We want to stabilize climate (no more climate change due to greenhouse gases) Therefore, we must stabilize CO2 at some relatively low concentration (2 x industrial level?) Therefore, we must stop emitting CO2 completely! But how do we get there?
37 Historical Emissions 16 Billions of Tons Carbon Emitted per Year 8 Historical emissions
38 The Stabilization Triangle 16 Billions of Tons Carbon Emitted per Year Stabilization Triangle Current path = ramp Interim Goal 8 Historical emissions Flat path
39 Stabilization Wedges 16 8 Billions of Tons Carbon Emitted per Year Historical emissions Current path = ramp Flat path 16 GtC/y Eight wedges Goal: In 50 years, same global emissions as today
40 Wedge strategies Energy Efficiency & Conservation 16 GtC/y Fuel Switching CO 2 Capture & Storage Stabilization Triangle 8 GtC/y Nuclear Fission Renewable Fuels & Electricity Forest and Soil Storage Carbon Mitigation Institute, Princeton University


41
42 Climate change and energy policy: Reduce What needs to be done Dependence on foreign oil Greenhouse gas emissions By promoting Conservation Alternative energy technologies Infrastructure development Using a balance between Government regulation (CO2 emissions) Market forces (cost of energy)

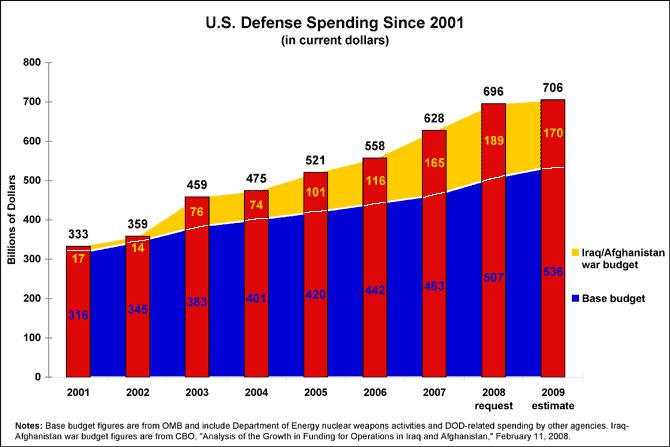
43 Can we afford this? US 2008 budget = $2,900 Billion Mandatory = $1788 Discretionary = $1114 DoD and War on Terror = 56% of Discretionary spending
44


45 DOE R&D Investment Gibbons and Blair, 1991, Physics Today
46 Some comparisons 1% of Defense + War budget = $7 B Current Energy R&D = $4.5 B US global change research program = $2 B (about same as military spending per day) ALL science and space = $30 B Cumulative funding ( ) by DOE on Renewable energy = $4 B Energy efficiency = $6 B
47 In closing. Climate is changing and we are responsible Projected climate change will have many devastating effects, globally and regionally This is an ethical and moral issue there will be losers (and a few winners) We can solve this problem by a combination of adaptation and mitigation We need to start NOW!
 Thanks for")
48 Do we have the will to change our lifestyle? (and help save the planet at the same time) Thanks for your attention!