Perris Circle 3 NOISE IMPACT ANALYSIS CITY OF PERRIS
|
|
|
- Ruby Bruce
- 5 years ago
- Views:
Transcription

 336-5979 Alex Wolfe, INCE")
1 Perris Circle 3 NOISE IMPACT ANALYSIS CITY OF PERRIS PREPARED BY: Bill Lawson, PE, INCE blawson@urbanxroads.com (949) Alex Wolfe, INCE awolfe@urbanxroads.com (949) MARCH 2018
2 II
3 TABLE OF CONTENTS TABLE OF CONTENTS... III APPENDICES... IV LIST OF EXHIBITS... IV LIST OF TABLES... V LIST OF ABBREVIATED TERMS... VI EXECUTIVE SUMMARY... 1 Off-Site Traffic Noise Analysis... 1 Operational Noise Analysis... 1 Operational Vibration Analysis... 2 Construction Noise Analysis... 2 Construction Vibration Analysis... 2 Significance Findings INTRODUCTION Site Location Project Description FUNDAMENTALS REGULATORY SETTING State of California Noise Requirements State of California Green Building Standards Code City of Perris General Plan Operational Noise Standards Construction Noise Standards Vibration Standards March Air Reserve Base/Inland Port Airport Land Use Compatibility SIGNIFICANCE CRITERIA PVCC SP EIR Thresholds Significance Criteria Summary EXISTING NOISE LEVEL MEASUREMENTS Measurement Procedure and Criteria Noise Measurement Locations Noise Measurement Results METHODS AND PROCEDURES FHWA Traffic Noise Prediction Model Off-Site Traffic Noise Prediction Model Inputs Vibration Assessment OFF-SITE TRANSPORTATION NOISE IMPACTS Traffic Noise Contours Existing Condition Project Traffic Noise Level Contributions Existing Plus Ambient Project Traffic Noise Level Contributions Existing Plus Ambient Plus Cumulative Project Traffic Noise Level Contributions RECEIVER LOCATIONS III
4 9 OPERATIONAL NOISE IMPACTS Operational Noise Sources Reference Noise Levels Project Operational Noise Levels Project Operational Noise Contribution Operational Vibration Impacts CONSTRUCTION IMPACTS Construction Noise Levels Construction Reference Noise Levels Construction Noise Analysis Construction Noise Thresholds of Significance Construction Vibration Impacts REFERENCES CERTIFICATION APPENDICES APPENDIX 3.1: CITY OF PERRIS MUNICIPAL CODE APPENDIX 5.1: STUDY AREA PHOTOS APPENDIX 5.2: NOISE LEVEL MEASUREMENT WORKSHEETS APPENDIX 7.1: OFF-SITE TRAFFIC NOISE CONTOURS APPENDIX 9.1: REFERENCE DISTRIBUTION/WAREHOUSE NOISE SOURCE PHOTOS APPENDIX 9.2: OPERATIONAL STATIONARY-SOURCE NOISE CALCULATIONS APPENDIX 9.3: OPERATIONAL CNEL ADJUSTMENTS LIST OF EXHIBITS EXHIBIT 1-A: LOCATION MAP... 6 EXHIBIT 1-B: SITE PLAN... 7 EXHIBIT 3-A: MARB/IPA FUTURE AIRPORT NOISE CONTOURS EXHIBIT 5-A: NOISE MEASUREMENT LOCATIONS EXHIBIT 8-A: RECEIVER LOCATIONS EXHIBIT 9-A: OPERATIONAL NOISE SOURCE LOCATIONS EXHIBIT 10-A: CONSTRUCTION NOISE SOURCE LOCATIONS IV
5 LIST OF TABLES TABLE ES-1: SUMMARY OF SIGNIFICANCE FINDINGS... 3 TABLE 3-1: OPERATIONAL NOISE STANDARDS TABLE 3-2: CONSTRUCTION NOISE STANDARDS TABLE 4-2: SIGNIFICANCE CRITERIA SUMMARY TABLE 5-1: 24-HOUR AMBIENT NOISE LEVEL MEASUREMENTS TABLE 6-1: OFF-SITE ROADWAY PARAMETERS TABLE 6-2: AVERAGE DAILY TRAFFIC VOLUMES TABLE 6-3: TIME OF DAY VEHICLE SPLITS TABLE 6-4: WITHOUT PROJECT CONDITIONS VEHICLE MIX TABLE 6-5: EXISTING WITH PROJECT CONDITIONS VEHICLE MIX TABLE 6-6: EXISTING PLUS AMBIENT WITH PROJECT CONDITIONS VEHICLE MIX TABLE 6-7: EA PLUS CUMULATIVE WITH PROJECT CONDITIONS VEHICLE MIX TABLE 6-8: VIBRATION SOURCE LEVELS FOR CONSTRUCTION EQUIPMENT TABLE 7-1: EXISTING WITHOUT PROJECT CONDITIONS NOISE CONTOURS TABLE 7-2: EXISTING WITH PROJECT CONDITIONS NOISE CONTOURS TABLE 7-3: EXISTING PLUS AMBIENT WITHOUT PROJECT CONDITIONS NOISE CONTOURS TABLE 7-4: EXISTING PLUS AMBIENT WITH PROJECT CONDITIONS NOISE CONTOURS TABLE 7-5: EA PLUS CUMULATIVE WITHOUT PROJECT CONDITIONS NOISE CONTOURS TABLE 7-6: EA PLUS CUMULATIVE WITH PROJECT CONDITIONS NOISE CONTOURS TABLE 7-7: EXISTING CONDITION OFF-SITE PROJECT-RELATED TRAFFIC NOISE IMPACTS TABLE 7-8: EA OFF-SITE PROJECT-RELATED TRAFFIC NOISE IMPACTS TABLE 7-9: EAC OFF-SITE PROJECT-RELATED TRAFFIC NOISE IMPACTS TABLE 9-1: REFERENCE NOISE LEVEL MEASUREMENTS TABLE 9-2: OPERATIONAL NOISE LEVEL COMPLIANCE (DBA L EQ) TABLE 9-3: OPERATIONAL NOISE LEVEL COMPLIANCE (DBA CNEL) TABLE 9-4: PROJECT DAYTIME NOISE LEVEL CONTRIBUTIONS TABLE 9-5: PROJECT NIGHTTIME NOISE LEVEL CONTRIBUTIONS TABLE 10-1: CONSTRUCTION REFERENCE NOISE LEVELS TABLE 10-2: SITE PREPARATION EQUIPMENT NOISE LEVELS TABLE 10-3: GRADING EQUIPMENT NOISE LEVELS TABLE 10-4: BUILDING CONSTRUCTION EQUIPMENT NOISE LEVELS TABLE 10-5: PAVING EQUIPMENT NOISE LEVELS TABLE 10-6: ARCHITECTURAL COATING EQUIPMENT NOISE LEVELS TABLE 10-7: UNMITIGATED CONSTRUCTION EQUIPMENT NOISE LEVEL SUMMARY (DBA L EQ) TABLE 10-8: UNMITIGATED CONSTRUCTION EQUIPMENT NOISE LEVEL COMPLIANCE TABLE 10-9: UNMITIGATED CONSTRUCTION EQUIPMENT VIBRATION LEVELS V
6 LIST OF ABBREVIATED TERMS (1) Reference ADT Average Daily Traffic ANSI American National Standards Institute Calveno California Vehicle Noise CEQA California Environmental Quality Act CNEL Community Noise Equivalent Level dba A-weighted decibels EIR Environmental Impact Report EPA Environmental Protection Agency FHWA Federal Highway Administration FTA Federal Transit Administration Hz Hertz I-215 Interstate 215 INCE Institute of Noise Control Engineering L eq Equivalent continuous (average) sound level L max Maximum level measured over the time interval L min Minimum level measured over the time interval LUCP Land Use Compatibility Plan MARB/IPA March Air Reserve Base/Inland Port Airport mph Miles per hour OPR Office of Planning and Research PVCC SP Perris Valley Commerce Center Specific Plan PPV Peak particle velocity Project Perris Circle 3 REMEL Reference Energy Mean Emission Level RMS Root-mean-square VdB Vibration Decibels VI
7 EXECUTIVE SUMMARY Urban Crossroads, Inc. has prepared this noise study to determine the noise exposure and the necessary noise mitigation measures for the proposed Perris Circle 3 development ( Project ). The Project site is located on the southwest corner of Harley Knox Boulevard and Redlands Avenue, in the City of Perris Perris Valley Commerce Center Specific Plan (PVCC SP) area. The Project is proposed to consist of a single warehouse building at approximately 210,900 square feet. This study has been prepared to satisfy the City of Perris noise standards and derives thresholds of significance based on the Perris Valley Commerce Center Specific Plan Environmental Impact Report (PVCC SP EIR), and Appendix G of the California Environmental Quality Act (CEQA) Guidelines. (1; 2) OFF-SITE TRAFFIC NOISE ANALYSIS Traffic generated by the operation of the proposed Project will influence the traffic noise levels in surrounding off-site areas. To quantify the off-site traffic noise increases on the surrounding off-site areas, the changes in traffic noise levels on six roadway segments surrounding the Project site were calculated based on the change in the average daily traffic (ADT) volumes. The traffic noise levels provided in this analysis are based on the traffic forecasts found in the Perris Circle 3 Traffic Impact Analysis prepared by Urban Crossroads, Inc. (3) To assess the off-site noise level impacts associated with the proposed Project, noise contour boundaries were developed for Existing, Existing plus Ambient (EA), and EA plus Cumulative (EAC) traffic conditions. The analysis shows that the Project-related traffic noise level increases under all traffic scenarios will be less than significant. OPERATIONAL NOISE ANALYSIS Using reference noise levels to represent the expected noise sources from the Perris Circle 3 site, this analysis estimates the Project-related operational noise levels at nearby sensitive receiver locations. The normal activities associated with the proposed Perris Circle 3 are anticipated to include idling trucks, delivery truck activities, backup alarms, as well as loading and unloading of dry goods, roof-top air conditioning units, and parking lot vehicle movements. The operational noise analysis shows that the Project-related operational noise levels due to the idling trucks, delivery truck activities, backup alarms, as well as loading and unloading of dry goods, roof-top air conditioning units, and parking lot vehicle movements will satisfy the City of Perris Municipal Code exterior noise level standards at all nearby sensitive receiver locations. In addition, this analysis demonstrates that the Project will contribute less than significant operational noise level contributions to the existing ambient noise environment during the daytime and nighttime hours at all nearby sensitive receiver locations. Therefore, the operational noise level impacts associated with the proposed 24-hour seven days per week Project activities will be less than significant. 1
8 OPERATIONAL VIBRATION ANALYSIS The operation of the Project site will include heavy trucks transiting on site to and from the loading dock areas. Truck vibration levels are dependent on vehicle characteristics, load, speed, and pavement conditions. Typical vibration levels for heavy trucks at normal traffic speeds do not exceed 65 VdB, and therefore, will be below the Federal Transit Administration (FTA) vibration threshold of 80 VdB at nearby sensitive receiver locations. Since truck deliveries transiting on site will be travelling at very low speeds it is expected that delivery truck vibration impacts at nearby homes will be less than significant. CONSTRUCTION NOISE ANALYSIS Construction noise represents a short-term increase on the ambient noise levels. Constructionrelated noise impacts are expected to create temporary and intermittent high-level noise conditions at receivers surrounding the Project site when certain activities occur at the Project site boundary. Using sample reference noise levels to represent the planned construction activities of the Perris Circle 3 site, this analysis estimates the Project-related construction noise levels at nearby sensitive receiver locations. The Project-related short-term construction noise levels are expected to range from 51.4 to 69.4 dba Leq and will satisfy the City of Perris Municipal Code 80 dba Leq noise level threshold at all nearby noise-sensitive receiver locations. Therefore, based on the results of this analysis, all receiver locations will experience less than significant impacts due to Project construction noise levels. CONSTRUCTION VIBRATION ANALYSIS Construction activity can result in varying degrees of ground vibration, depending on the equipment and methods used, distance to the affected structures and soil type. It is expected that ground-borne vibration from Project construction activities would cause only intermittent, localized intrusion. The analysis shows that the unmitigated Project-construction vibration levels of up to 62.7 VdB will remain below the Federal Transit Administration (FTA) 80 VdB threshold at all receiver locations, and are therefore, considered a less than significant impact. Further, vibration levels at the site of the closest sensitive receiver are unlikely to be sustained during the entire construction period, but will occur rather only during the times that heavy construction equipment is operating at the Project site perimeter. Moreover, construction at the Project site will be restricted to daytime hours consistent with City of Perris requirements thereby eliminating potential vibration impacts during the sensitive nighttime hours. Although Project construction noise and vibration impacts will be less than significant, the Project is required to incorporate the following mitigation measures (MM) from the PVCC Specific Plan Environmental Impact Report: MM Noise 1 During all project site excavation and grading on site, the construction contractors shall equip all construction equipment, fixed or mobile, with properly operating and maintained mufflers consistent with manufacturer s standards. The construction contractor shall place all stationary construction equipment so that emitted noise is directed away from 2
9 MM Noise 2 MM Noise 3 MM Noise 4 the noise sensitive receptors nearest the project site. During construction, stationary construction equipment, stockpiling and vehicle staging areas would be placed a minimum of 446 feet away from the closest sensitive receptor. No combustion-powered equipment, such as pumps or generators, shall be allowed to operate within 446 feet of any occupied residence unless the equipment is surrounded by a noise protection barrier. Construction contractors of implementing development projects shall limit haul truck deliveries to the same hours specified for construction equipment. To the extent feasible, haul routes shall not pass sensitive land uses or residential dwellings. SIGNIFICANCE FINDINGS The results of this Perris Circle 3 Noise Impact Analysis are summarized below based on the significance criteria in Section 4 of this report. Table ES-1 shows the findings of significance for each potential noise and/or vibration impact before and after any required mitigation measures. TABLE ES-1: SUMMARY OF SIGNIFICANCE FINDINGS Analysis Report Section Unmitigated Significance Findings Mitigated Off-Site Traffic Noise 7 Less Than Significant n/a Operational Noise Less Than Significant n/a 9 Operational Vibration Less Than Significant n/a Construction Noise Less Than Significant n/a 10 Construction Vibration Less Than Significant n/a "n/a" = No mitigation is required. 3
10 This page intentionally left blank 4
11 1 INTRODUCTION This noise analysis has been completed to determine the noise impacts associated with the development of the proposed Perris Circle 3 ( Project ). This noise study briefly describes the proposed Project, provides information regarding noise fundamentals, describes the local regulatory setting, provides the study methods and procedures for traffic noise analysis, and evaluates the future exterior noise environment. In addition, this study includes an analysis of the potential Project-related long-term operational and short-term construction noise impacts. 1.1 SITE LOCATION The proposed Perris Circle 3 site is located on the southwest corner of Harley Knox Boulevard and Redlands Avenue, in the City of Perris Perris Valley Commerce Center Specific Plan (PVCC SP), as shown on Exhibit 1-A. Land uses adjacent to the Project site include industrial/warehouse uses to the east and south, undeveloped land to the north, and undeveloped land with vacant mobile structures and scattered debris to the west. The March Air Reserve Base/Inland Port Airport (MARB/IPA) is located approximately one-mile northwest of the Project site, and the Interstate 215 (I-215) Freeway is located roughly 2 miles west of the Project site. 1.2 PROJECT DESCRIPTION The Project is proposed to consist of a single warehouse building at approximately 210,900 square feet, as shown on Exhibit 1-B. At the time this noise analysis was prepared the future tenants of the proposed Project were unknown. To present the potential worst-case noise conditions, this analysis assumes the Project would be operational 24 hours per day, seven days per week. The Project business operations would primarily be conducted within the enclosed buildings, except for traffic movement, parking, as well as loading and unloading of trucks at designated loading bays. The on-site Project-related noise sources are expected to include: idling trucks, delivery truck activities, backup alarms, as well as loading and unloading of dry goods, roof-top air conditioning units, and parking lot vehicle movements. This noise analysis is intended to describe noise level impacts associated with the expected typical warehouse and distribution storage activities at the Project site. At the time of this analysis, no cold storage was planned at the Project site, and therefore is not analyzed in this report. According to the Perris Circle 3 Traffic Impact Analysis prepared by Urban Crossroads, Inc., the Project is expected to generate a total of approximately 367 trip-ends per day (actual vehicles). (3) The net Project trip generation includes 118 truck trip-ends per day from the proposed buildings within the Project site. This noise study relies on the net Project trips to accurately account for the effect of individual truck trips on the study area roadway network. 5

12 EXHIBIT 1-A: LOCATION MAP 6

13 EXHIBIT 1-B: SITE PLAN 7
14 This page intentionally left blank 8
15 2 FUNDAMENTALS For consistency with the PVCC SP EIR, the fundamentals discussion provided below was obtained from the EIR, Section 4.9 Noise, Page 4.9-2: (1) The PVCC SP EIR defines noise as unwanted or objectionable sound. The effect of noise on people can include general annoyance, interference with speech communication, sleep disturbance and, in the extreme, hearing impairment. The unit of measurement used to describe a noise level is the decibel (db). However, since the human ear is not equally sensitive to all frequencies within the sound spectrum, the A-weighted noise scale, which weights the frequencies to which humans are sensitive, is used for measurements. Noise levels using A-weighted measurements are written db(a) or dba. Decibels are measured on a logarithmic scale which quantifies sound intensity in a manner that is similar to the Richter scale used for earthquake magnitudes. In the case of noise, a doubling of the energy from a noise source, such as the doubling of a traffic volume, would increase the noise level by 3 dba; a halving of the energy would result in a 3 dba decrease. The PVCC SP EIR further states that average noise levels over a period of minutes or hours are usually expressed as db Leq or the equivalent noise level for that period of time. For example, Leq(3) would represent a three hour average. When no time-period is specified, a one-hour average is assumed. Noise standards for land use compatibility are stated in terms of the Community Noise Equivalent Level (CNEL) and the Day-Night Average Noise Level (Ldn). CNEL is a 24-hour weighted average measure of community noise. The computation of CNEL adds 5 dba to the average hourly noise levels between 7 p.m. and 10 p.m. (evening hours), and 10 dba to the average hourly noise levels between 10p.m. to 7 a.m. (nighttime hours). This weighting accounts for the increased human sensitivity to noise in the evening and nighttime hours. Ldn is a very similar 24-hour weighted average which weights only the nighttime hours and not the evening hours. CNEL is normally about 1 db higher than Ldn for typical traffic and other community noise levels. 9
16 This page intentionally left blank 10
17 3 REGULATORY SETTING To limit population exposure to physically and/or psychologically damaging as well as intrusive noise levels, the federal government, the State of California, various county governments, and most municipalities in the state have established standards and ordinances to control noise. In most areas, automobile and truck traffic is the major source of environmental noise. Traffic activity generally produces an average sound level that remains fairly constant with time. Air and rail traffic, and commercial and industrial activities are also major sources of noise in some areas. Federal, state, and local agencies regulate different aspects of environmental noise. Federal and state agencies generally set noise standards for mobile sources such as aircraft and motor vehicles, while regulation of stationary sources is left to local agencies. 3.1 STATE OF CALIFORNIA NOISE REQUIREMENTS The State of California regulates freeway noise, sets standards for sound transmission, provides occupational noise control criteria, identifies noise standards, and provides guidance for local land use compatibility. State law requires that each county and city adopt a General Plan that includes a Noise Element which is to be prepared according to guidelines adopted by the Governor s Office of Planning and Research (OPR). (4) The purpose of the Noise Element is to limit the exposure of the community to excessive noise levels. 3.2 STATE OF CALIFORNIA GREEN BUILDING STANDARDS CODE The 2016 State of California s Green Building Standards Code contains mandatory measures for non-residential building construction in Section on Environmental Comfort. (5) These noise standards are applied to new construction in California for the purpose of controlling interior noise levels resulting from exterior noise sources. The regulations specify that acoustical studies must be prepared when non-residential structures are developed in areas where the exterior noise levels exceed 65 dba CNEL, such as within a noise contour of an airport, freeway, railroad, and other areas where noise contours are not readily available. If the development falls within an airport or freeway 65 dba CNEL noise contour, the combined sound transmission class (STC) rating of the wall and roof-ceiling assemblies must be at least 50. For those developments in areas where noise contours are not readily available, and the noise level exceeds 65 dba Leq for any hour of operation, a wall and roof-ceiling combined STC rating of 45, and exterior windows with a minimum STC rating of 40 are required (Section ). 3.3 CITY OF PERRIS GENERAL PLAN The City of Perris has adopted a Noise Element of the General Plan (6) to control and abate environmental noise, and to protect the citizens of Perris from excessive exposure to noise. The Noise Element specifies the maximum allowable unmitigated exterior noise levels for new developments impacted by transportation noise sources such as arterial roads, freeways, airports, and railroads. In addition, the Noise Element identifies noise polices and implementation measures designed to protect, create, and maintain an environment free from noise that may jeopardize the health or welfare of sensitive receptors, or degrade quality of life. 11
18 The noise standards identified in the City of Perris General Plan are guidelines to evaluate the acceptability of the transportation related noise level impacts. These standards are based on the Governor s Office of Planning and Research (OPR) and are used to assess the long-term traffic noise impacts on land uses. According to the City s Land Use Compatibility for Community Noise Exposure (Exhibit N-1), noise-sensitive land uses such as single-family residences are normally acceptable with exterior noise levels below 60 dba CNEL and conditionally acceptable with noise levels below 65 dba CNEL. Industrial uses, such as the Project, are considered normally acceptable with exterior noise levels of up to 70 dba CNEL, and conditionally acceptable with exterior noise levels between 70 to 80 dba CNEL. (6) 3.4 OPERATIONAL NOISE STANDARDS To analyze noise impacts originating from a designated fixed location or private property such as the Perris Circle 3 Project, operational noise such as the expected idling trucks, delivery truck activities, backup alarms, as well as loading and unloading of dry goods, roof-top air conditioning units, and parking lot vehicle movements are typically evaluated against standards established under a City s Municipal Code. The City of Perris Municipal Code, Chapter 7.34 Noise Control, Section , establishes the permissible noise level that may intrude into a neighbor s property from the use of sound amplifying equipment. The Municipal Code exterior noise level criteria for residential properties affected by operational noise sources is included in Section General Prohibition, which states that the Section sound amplifying equipment noise standards shall apply. Therefore, for residential properties, the exterior noise level shall not exceed 80 dba Leq during daytime hours (7:01 a.m. to 10:00 p.m.) and shall not exceed 60 dba Leq during the nighttime hours (10:01 p.m. to 7:00 a.m.), as shown on Table 3-1. (7) The City of Perris Municipal Code is included in Appendix 3.1. Additional exterior noise level standards are identified in the City of Perris General Plan Noise Element Implementation Measure V.A.1 which requires that new industrial facilities, such as the Project, within 160 feet of existing noise-sensitive land uses must demonstrate compliance with a 60 dba CNEL exterior noise level standard at the property line of the sensitive use. Table 3-1, therefore, shows the Municipal Code and General Plan standards used in this analysis to evaluate the potential operational noise levels from the Project. 12
19 TABLE 3-1: OPERATIONAL NOISE STANDARDS Jurisdiction Land Use Time Period Noise Level Standard (dba) 3 City of Perris 1 Residential 1 Daytime (7:01 a.m. - 10:00 p.m.) Nighttime (10:01 p.m. - 7:00 a.m.) 80 dba Leq 60 dba Leq Within 160 Feet of PL 2 24-Hours 60 dba CNEL 1 Source: City of Perris Municipal Code, Sections & (Appendix 3.1). 2 Source: City of Perris General Plan Noise Element, Implementation Measure V.A.1. 3 Leq represents a steady state sound level containing the same total energy as a time varying signal over a given sample period. "PL" = Property line. 3.5 CONSTRUCTION NOISE STANDARDS To analyze noise impacts originating from the construction of the Perris Circle 3 site, noise from construction activities are typically evaluated against standards established under a City s Municipal Code. The City of Perris Municipal Code, Section , identifies the City s construction noise standards and permitted hours of construction activity (refer to Table 3-2). Further, the City of Perris Municipal Code, Section , noise level standard of 80 dba Leq at residential properties shall apply to the noise-sensitive receiver locations located in the City of Perris. (7) TABLE 3-2: CONSTRUCTION NOISE STANDARDS Jurisdiction Permitted Hours of Construction Activity Construction Noise Level Standard (dba Leq) City of Perris 1 7:00 a.m. to 7:00 p.m. on any day except Sundays and legal holidays (with the exception of Columbus Day and Washington s birthday). 1 Source: City of Perris Municipal Code, Section (Appendix 3.1) VIBRATION STANDARDS The City of Perris has not identified or adopted specific vibration level standards. However, the United States Department of Transportation Federal Transit Administration (FTA) provides guidelines for maximum-acceptable vibration criteria for different types of land uses. These guidelines allow 80 VdB for residential uses and buildings where people normally sleep. (8) Operational and construction activities can result in varying degrees of ground-borne vibration, depending on the equipment and methods used, distance to the affected structures and soil type. Construction vibration is generally associated with pile driving and rock blasting. Other construction equipment such as air compressors, light trucks, hydraulic loaders, etc., generates little or no ground vibration. Large bulldozers and loaded trucks can cause perceptible vibration levels proximate receptors. The FTA guidelines of 80 VdB for sensitive land uses provide a 13
20 substantiated basis for determining the relative significance of potential Project-related vibration impacts due to on-site operational and construction activities. 3.7 MARCH AIR RESERVE BASE/INLAND PORT AIRPORT LAND USE COMPATIBILITY The March Air Reserve Base/Inland Port Airport (MARB/IPA) is located approximately one-mile northwest of the Project site. The March Air Reserve Base/Inland Port Airport Land Use Compatibility Plan (MARB/IPA LUCP) includes the policies for determining the land use compatibility of the Project since it is located within 2 miles of an airport runway. The MARB/IPA, Map MA-1, indicates that the Project site is located within Compatibility Zone D, and the Table MA-1 Compatibility Zone Factors indicates that this area is considered to have a moderate to low noise impact, and is mostly within the 55 dba CNEL contour. Further, the Basic Compatibility Criteria, listed in Table MA-2 of the MARB/IPA LUCP identifies no prohibited uses other than those that would pose a safety risk due to building height. (9) The MARB/IPA LUCP does not identify industrial-use specific noise compatibility standards, and therefore, the Governor s Office of Planning and Research (OPR) Land Use Compatibility for Community Noise Exposure, previously discussed in Section 3.3, is used to assess potential aircraft-related noise levels at the Project site. The OPR guidelines indicate that industrial uses, such as the Project, are considered normally acceptable with exterior noise levels of up to 70 dba CNEL. (6) The noise contour boundaries of MARB/IPA are presented on Exhibit 3-A of this report and show that the Project is located outside of the 60 dba CNEL noise level contours, consistent with the Compatibility Zone Factors for Zone D 55 dba CNEL contour location, and therefore, the Project industrial use represents normally compatible land use and no noise mitigation is required with typical building construction. 14

21 EXHIBIT 3-A: MARB/IPA FUTURE AIRPORT NOISE CONTOURS 15
22 This page intentionally left blank 16
23 4 SIGNIFICANCE CRITERIA The following significance criteria are based on guidance provided by Appendix G of the California Environmental Quality Act (CEQA) Guidelines. For the purposes of this report, impacts would be potentially significant if the Project results in or causes: A. Exposure of persons to or generation of noise levels in excess of standards established in the local general plan or noise ordinance, or applicable standards of other agencies; B. Exposure of persons to or generation of excessive ground-borne vibration or ground-borne noise levels. C. A substantial permanent increase in ambient noise levels in the Project vicinity above existing levels without the proposed Project; or D. A substantial temporary or periodic increase in ambient noise levels in the Project vicinity above noise levels existing without the proposed Project. E. For a project located within an airport land use plan or, where such a plan has not been adopted, within two miles of a public airport or public use airport, expose people residing or working in the Project area to excessive noise levels. F. For a project within the vicinity of a private airstrip, expose people residing or working in the Project area to excessive noise levels. While the CEQA Guidelines and the City of Perris General Plan Guidelines provide direction on noise compatibility and establish noise standards by land use type that are sufficient to assess the significance of noise impacts under CEQA Threshold A, they do not define the levels at which increases are considered substantial for use under Thresholds B, C, and D. Existing ambient noise level measurements, later described in Section 5, indicate that existing transportation-related noise levels near the Project site approach 66.8 dba CNEL. Based on the OPR land use compatibility criteria, previously discussed in Section 3.3, Project industrial uses are considered normally acceptable with exterior noise levels of up to 70 dba CNEL. As such, the exposure of persons working within the Project site under CEQA Guideline A would remain below the OPR guidelines for industrial uses, thereby resulting in less than significant on-site impacts. Therefore, no further analysis is included in this noise study with regard to on-site transportationrelated noise levels. CEQA Thresholds E and F apply to nearby public and private airports, if any, and the Project s land use compatibility. The closest airport which would require additional noise analysis under CEQA guidelines E and F is the MARB/IPA. As previously shown on Exhibit 3-A, the Project site is located outside of the 60 dba CNEL noise level contour boundary of the MARB/IPA. Based on the MARB/IPA LUCP noise level contours for the MARB/IPA, the Project is located outside of the 60 dba CNEL noise level contours, and therefore, represents normally acceptable land use based on the OPR land use compatibility criteria, and no noise mitigation is required with typical building construction. Therefore, the potential impacts under CEQA guidelines E and F are less than significant, and are not further analyzed in this noise study. 17
24 4.1 PVCC SP EIR THRESHOLDS As identified in the PVCC SP EIR, sensitive receivers are areas where humans are participating in activities that may be subject to the stress of significant interference from noise and often include residential dwellings, mobile homes, hotels, motels, hospitals, nursing homes, educational facilities, and libraries. Other receivers include office and industrial buildings, which are not considered as sensitive as single-family homes, but are still protected by City of Perris land use compatibility standards, as discussed below. Noise level increases at nearby receiver locations resulting from the Project are evaluated based on the PVCC SP EIR Thresholds described below at nearby sensitive receiver locations. Further, CEQA requires that consideration be given to the magnitude of the increase, the existing ambient noise levels, and the location of noise-sensitive receivers to determine if a noise increase represents a significant adverse environmental impact. This approach recognizes that there is no single noise increase that renders the noise impact significant. (10) According to the PVCC SP EIR, there is no official industry standard of determining significance of noise impacts. However, typically, a jurisdiction will identify either 3 dba or 5 dba increase as being the threshold because these levels represent varying levels of perceived noise increases. The PVCC SP EIR indicates that a 5 dba noise level increase is considered discernable to most people in an exterior environment when the existing noise levels are below 60 dba. Further, it identifies a 3 dba increase threshold when the existing ambient noise levels already exceed 60 dba. In addition, according to the PVCC SP EIR, an increase of 5 dba or more above without Project noise levels is considered a significant impact at all non-noise-sensitive land uses. (1) 4.2 SIGNIFICANCE CRITERIA SUMMARY Noise impacts shall be considered significant if any of the following occur as a direct result of the proposed development. Table 4-2 shows the significance criteria summary matrix. OFF-SITE TRAFFIC NOISE When the noise levels at noise-sensitive land uses (e.g. residential, etc.): o are less than 60 dba CNEL and the Project creates a 5 dba CNEL or greater Project-related noise level increase; or o exceed 60 dba CNEL and the Project creates a 3 dba CNEL or greater Project-related noise level increase (PVCC SP EIR, Page ). OPERATIONAL NOISE If Project-related operational noise levels: o exceed the 80 dba L eq daytime or 60 dba L eq nighttime noise level standards at the nearby sensitive receiver locations in the City of Perris (City of Perris Municipal Code, Section ); or o exceed the 60 dba CNEL exterior noise level standard at residential receiver locations within 160 feet of the Project site, in the City of Perris (City of Perris General Plan Noise Element, Implementation Measure V.A.1). 18
25 If the existing ambient noise levels at the nearby noise-sensitive receivers near the Project site: o o are less than 60 dba L eq and the Project creates a 5 dba L eq or greater Project-related noise level increase; or exceed 60 dba L eq and the Project creates a 3 dba L eq or greater Project-related noise level increase (PVCC SP EIR, Page ). If long-term project generated operational source vibration levels could exceed the FTA maximum acceptable vibration standard of 80 vibration decibels (VdB) at noise-sensitive receiver locations. CONSTRUCTION NOISE AND VIBRATION If Project-related construction activities: o o occur at any time other than the permitted hours of 7:00 a.m. to 7:00 p.m. on any day except Sundays and holidays provided by the City of Perris Municipal Code; or create noise levels at sensitive receiver locations in the City of Perris which exceed the construction noise level limit of 80 dba L eq (City of Perris Municipal Code ). If short-term project generated construction source vibration levels could exceed the FTA maximum acceptable vibration standard of 80 vibration decibels (VdB) at noise-sensitive receiver locations. TABLE 4-2: SIGNIFICANCE CRITERIA SUMMARY Analysis Receiving Land Use Condition(s) Significance Criteria Daytime Nighttime Off-Site Noise- Sensitive 1 Non-Noise- Sensitive 1 if ambient is < 60 dba CNEL if ambient is > 60 dba CNEL Exterior Noise Level Increase Threshold 5 dba CNEL Project increase 3 dba CNEL Project increase 5 dba CNEL Project increase Operational Noise & Vibration Construction Noise & Vibration Perris Noise- Sensitive At residential land use 2 80 dba Leq 60 dba Leq Within 160 Feet of residential use 3 60 dba CNEL if ambient is < 60 dba Leq 1 5 dba Leq Project increase if ambient is > 60 dba Leq 1 3 dba Leq Project increase Vibration Level Threshold 4 80 VdB n/a Permitted hours of 7:00 a.m. to 7:00 p.m. on any day except Perris Sundays and holidays. 7 Noise Level Threshold 5 80 dba Leq n/a Noise-Sensitive Vibration Level Threshold 4 80 VdB n/a 1 Source: PVCC SP EIR, Page ). 2 Source: City of Perris Municipal Code, Section (Appendix 3.1). 3 Source: City of Perris General Plan Noise Element, Implementation Measure V.A.1. 4 Source: Federal Transit Administration, Transit Noise and Vibration Impact Assessment, May Source: City of Perris Municipal Code, Section (Appendix 3.1). "Daytime" = 7:01 a.m. - 10:00 p.m.; "Nighttime" = 10:01 p.m. - 7:00 a.m. 19
26 This page intentionally left blank 20
27 5 EXISTING NOISE LEVEL MEASUREMENTS To assess the existing noise level environment, three 24-hour noise level measurements were taken at potential receiver locations in the Project study area. The receiver locations were selected to describe and document the existing noise environment within the Project study area. Exhibit 5-A provides the boundaries of the Project study area and the noise level measurement locations. To fully describe the existing noise conditions, noise level measurements were collected by Urban Crossroads, Inc. from Tuesday, August 15 th, to Wednesday, August 16 th, Appendix 5.1 includes study area photos. 5.1 MEASUREMENT PROCEDURE AND CRITERIA To describe the existing noise environment, the hourly noise levels were measured during typical weekday conditions over a 24-hour period. By collecting individual hourly noise level measurements, it is possible to describe the daytime and nighttime hourly noise levels and calculate the 24-hour CNEL. The long-term noise readings were recorded using Piccolo Type 2 integrating sound level meter and dataloggers. The Piccolo sound level meters were calibrated using a Larson-Davis calibrator, Model CAL 150. All noise meters were programmed in "slow" mode to record noise levels in "A" weighted form. The sound level meters and microphones were equipped with a windscreen during all measurements. All noise level measurement equipment satisfies the American National Standards Institute (ANSI) standard specifications for sound level meters ANSI S /IEC :2013. (11) 5.2 NOISE MEASUREMENT LOCATIONS The long-term noise level measurements were positioned as close to the nearest sensitive receiver locations as possible to assess the existing ambient hourly noise levels surrounding the Project site. Both Caltrans and the FTA recognize that it is not reasonable to collect noise level measurements that can fully represent every part of a private yard, patio, deck, or balcony normally used for human activity when estimating impacts for new development projects. This is demonstrated in the Caltrans general site location guidelines which indicate that, sites must be free of noise contamination by sources other than sources of interest. Avoid sites located near sources such as barking dogs, lawnmowers, pool pumps, and air conditioners unless it is the express intent of the analyst to measure these sources. (12) Further, FTA guidance states, that it is not necessary nor recommended that existing noise exposure be determined by measuring at every noise-sensitive location in the project area. Rather, the recommended approach is to characterize the noise environment for clusters of sites based on measurements or estimates at representative locations in the community. (8) Based on recommendations of Caltrans and the FTA, it is not necessary to collect measurements at each individual building or residence, because each receiver measurement represents a group of buildings that share acoustical equivalence. (8) In other words, the area represented by the receiver shares similar shielding, terrain, and geometric relationship to the reference noise source. Receivers represent a location of noise sensitive areas and are used to estimate the future noise level impacts. Collecting reference ambient noise level measurements at the nearby 21
28 sensitive receiver locations allows for a comparison of the before and after Project noise levels and is necessary to assess potential noise impacts due to the Project s contribution to the ambient noise levels. 5.3 NOISE MEASUREMENT RESULTS The noise measurements presented below focus on the average or equivalent sound levels (Leq). The equivalent sound level (Leq) represents a steady state sound level containing the same total energy as a time varying signal over a given sample period. Table 5-1 identifies the hourly daytime (7:01 a.m. to 10:00 p.m.) and nighttime (10:01 p.m. to 7:00 a.m.) noise levels at each noise level measurement location consistent with the City of Perris Municipal Code. Appendix 5.2 provides a summary of the existing hourly ambient noise levels described below: Location L1 represents the noise levels on Harley Knox Boulevard north of the Project site near existing residential homes. The noise level measurements collected show an overall 24-hour exterior noise level of 66.8 dba CNEL. The hourly noise levels measured at location L1 ranged from 59.2 to 65.2 dba L eq during the daytime hours and from 53.1 to 62.6 dba L eq during the nighttime hours. The energy (logarithmic) average daytime noise level was calculated at 62.6 dba L eq with an average nighttime noise level of 59.3 dba L eq. Location L2 represents the noise levels on Nance Street and Las Palmas near existing residential homes. The noise level measurements collected show an overall 24-hour exterior noise level of 60.3 dba CNEL. The hourly noise levels measured at location L2 ranged from 47.5 to 57.8 dba Leq during the daytime hours and from 47.2 to 58.1 dba Leq during the nighttime hours. The energy (logarithmic) average daytime noise level was calculated at 53.8 dba Leq with an average nighttime noise level of 53.4 dba Leq. Location L3 represents the noise levels on Nance Street near existing residential homes. The noise level measurements collected show an overall 24-hour exterior noise level of 77.5 dba CNEL. The hourly noise levels measured at location L3 ranged from 70.2 to 76.6 dba Leq during the daytime hours and from 65.8 to 72.7 dba Leq during the nighttime hours. The energy (logarithmic) average daytime noise level was calculated at 73.3 dba Leq with an average nighttime noise level of 69.9 dba Leq. Table 5-1 provides the (energy average) noise levels used to describe the daytime and nighttime ambient conditions. These daytime and nighttime energy average noise levels represent the average of all hourly noise levels observed during these time periods expressed as a single number. Appendix 5.2 provides summary worksheets of the noise levels for each hour as well as the minimum, maximum, L1, L2, L5, L8, L25, L50, L90, L95, and L99 percentile noise levels observed during the daytime and nighttime periods. The background ambient noise levels in the Project study area are dominated by the transportation-related noise associated with the arterial roadway network. This includes the auto and heavy truck activities on Redlands Avenue near the noise level measurement locations. Additional background noise sources in the Project study area include aircraft overflight noise from the MARB/IPA. The 24-hour existing noise level measurements are shown on Table
29 TABLE 5-1: 24-HOUR AMBIENT NOISE LEVEL MEASUREMENTS Location 1 Distance To Project Boundary (Feet) L1 620' L2 635' Description Located on Harley Knox Boulevard north of the Project site near existing residential homes. Located on Nance Street and Las Palmas near existing residential homes. Energy Average Hourly Noise Level (dba Leq) 2 Daytime Nighttime CNEL L3 1,745' Located on Nance Street near existing residential homes See Exhibit 5-A for the noise level measurement locations. 2 The long-term 24-hour measurement printouts are included in Appendix 5.2. "Daytime" = 7:01 a.m. to 10:00 p.m.; "Nighttime" = 10:01 p.m. to 7:00 a.m. 23

30 EXHIBIT 5-A: NOISE MEASUREMENT LOCATIONS 24
31 6 METHODS AND PROCEDURES The following section outlines the methods and procedures used to model and analyze the future traffic noise environment. 6.1 FHWA TRAFFIC NOISE PREDICTION MODEL The expected roadway noise level increases from vehicular traffic were calculated by Urban Crossroads, Inc. using a computer program that replicates the Federal Highway Administration (FHWA) Traffic Noise Prediction Model- FHWA-RD (13) The FHWA Model arrives at a predicted noise level through a series of adjustments to the Reference Energy Mean Emission Level (REMEL). In California the national REMELs are substituted with the California Vehicle Noise (Calveno) Emission Levels. (14) Adjustments are then made to the REMEL to account for: the roadway classification (e.g., collector, secondary, major or arterial), the roadway active width (i.e., the distance between the center of the outermost travel lanes on each side of the roadway), the total average daily traffic (ADT), the travel speed, the percentages of automobiles, medium trucks, and heavy trucks in the traffic volume, the roadway grade, the angle of view (e.g., whether the roadway view is blocked), the site conditions ("hard" or "soft" relates to the absorption of the ground, pavement, or landscaping), and the percentage of total ADT which flows each hour throughout a 24-hour period. Research conducted by Caltrans has shown that the use of soft site conditions is appropriate for the application of the FHWA traffic noise prediction model used in this analysis. (15) 6.2 OFF-SITE TRAFFIC NOISE PREDICTION MODEL INPUTS Table 6-1 presents the roadway parameters used to assess the Project s off-site transportation noise impacts. Table 6-1 identifies the six study area roadway segments, the distance from the centerline to adjacent land use based on the functional roadway classifications according to the City of Perris General Plan Circulation Element, and the posted vehicle speeds. The ADT volumes used in this study are presented on Table 6-2 were obtained from the Perris Circle 3 Traffic Impact Analysis prepared by Urban Crossroads, Inc., for the following traffic scenarios: Existing, Existing plus Ambient (EA), and EA plus Cumulative (EAC) conditions. (3) Table 6-3 provides the time of day (daytime, evening, and nighttime) vehicle splits. 25
32 ID Roadway Segment TABLE 6-1: OFF-SITE ROADWAY PARAMETERS Existing Adjacent Land Use 1 Distance from Centerline to Nearest Adjacent Land Use (Feet) 2 1 Redlands Av. s/o Harley Knox Bl. Industrial 47' 40 2 Redlands Av. s/o Nance St. Industrial 47' 40 3 Harley Knox Bl. w/o Driveway 1 Vacant, Residential 47' 45 4 Harley Knox Bl. w/o Redlands Av. Vacant 47' 45 5 Nance St. e/o Driveway 2 Industrial 30' 40 6 Nance St. w/o Redlands Av. Industrial 30' 40 1 Sources: Google Earth aerial imagery. 2 Distance to adjacent land use is based upon the right-of-way distances for each functional roadway classification provided in the General Plan Circulation Element. Posted Speed Limit (mph) TABLE 6-2: AVERAGE DAILY TRAFFIC VOLUMES Average Daily Traffic Volumes 1 ID Roadway Segment Existing (2017) Existing plus Ambient (EA) EA plus Cumulative (EAC) Without Project With Project Without Project With Project Without Project With Project 1 Redlands Av. s/o Harley Knox Bl. 4,572 4,827 4,757 5,012 7,257 7,512 2 Redlands Av. s/o Nance St. 4,530 4,592 4,713 4,775 6,113 6,175 3 Harley Knox Bl. w/o Driveway 1 4,428 4,733 4,607 4,912 7,107 7,412 4 Harley Knox Bl. w/o Redlands Av. 4,428 4,733 4,607 4,912 7,107 7,412 5 Nance St. e/o Driveway Nance St. w/o Redlands Av ,044 1,128 1 Source: Perris Circle 3 Traffic Impact Analysis, Urban Crossroads, Inc., March Vehicle Type TABLE 6-3: TIME OF DAY VEHICLE SPLITS Time of Day Splits 1 Daytime Evening Nighttime Total of Time of Day Splits Autos 77.50% 12.90% 9.60% % Medium Trucks 84.80% 4.90% 10.30% % Heavy Trucks 86.50% 2.70% 10.80% % 1 Typical Southern California vehicle mix. "Daytime" = 7:00 a.m. to 7:00 p.m.; "Evening" = 7:00 p.m. to 10:00 p.m.; "Nighttime" = 10:00 p.m. to 7:00 a.m. 26
33 According to the Perris Circle 3 Traffic Impact Analysis prepared by Urban Crossroads, Inc., the Project is expected to generate a net total of approximately 367 trip-ends per day (actual vehicles). (3) The Project trip generation includes 118 truck trip-ends per day from the proposed building within the Project site. This noise study relies on the net Project trips to accurately account for the effect of individual truck trips on the study area roadway network. To quantify the off-site noise levels, the Project related truck trips were added to the heavy truck category in the FHWA noise prediction model. The addition of the Project related truck trips increases the percentage of heavy trucks in the vehicle mix. This approach recognizes that the FHWA noise prediction model is significantly influenced by the number of heavy trucks in the vehicle mix. The 249 daily Project automobile and 118 daily Project truck trip-ends were assigned to the sixindividual off-site study area roadway segments based on the Project automobile and truck trip distribution percentages documented in the Traffic Impact Analysis. Using the Project truck trips in combination with the Project trip distribution, Urban Crossroads, Inc. calculated the number of additional Project truck trips and vehicle mix percentages for each of the study area roadway segments. Table 6-4 shows the traffic flow by vehicle type (vehicle mix) used for all without Project traffic scenarios, and Tables 6-5 to 6-7 show the vehicle mixes used for the with Project traffic scenarios. TABLE 6-4: WITHOUT PROJECT CONDITIONS VEHICLE MIX Total Daily % Traffic Flow 1 Classification Total Autos Medium Trucks Heavy Trucks All Segments 88.83% 3.05% 8.12% % 1 Based on an existing PM peak hour count by vehicle type taken on 12/6/2017 on Redlands Avenue and Harley Knox Boulevard (Perris Circle 3 Traffic Impact Analysis, Urban Crossroads, Inc., March 2018). TABLE 6-5: EXISTING WITH PROJECT CONDITIONS VEHICLE MIX ID Roadway Segment Autos With Project 1 Medium Trucks Heavy Trucks Total 2 1 Redlands Av. s/o Harley Knox Bl % 3.30% 9.72% % 2 Redlands Av. s/o Nance St % 3.00% 8.01% % 3 Harley Knox Bl. w/o Driveway % 3.27% 9.67% % 4 Harley Knox Bl. w/o Redlands Av % 3.27% 9.67% % 5 Nance St. e/o Driveway % 4.50% 16.38% % 6 Nance St. w/o Redlands Av % 4.50% 16.38% % 1 Source: Perris Circle 3 Traffic Impact Analysis, Urban Crossroads, Inc., March Total of vehicle mix percentage values rounded to the nearest one-hundredth. 27
34 TABLE 6-6: EXISTING PLUS AMBIENT WITH PROJECT CONDITIONS VEHICLE MIX ID Roadway Segment Autos With Project 1 Medium Trucks Heavy Trucks Total 2 1 Redlands Av. s/o Harley Knox Bl % 3.29% 9.66% % 2 Redlands Av. s/o Nance St % 3.01% 8.02% % 3 Harley Knox Bl. w/o Driveway % 3.26% 9.61% % 4 Harley Knox Bl. w/o Redlands Av % 3.26% 9.61% % 5 Nance St. e/o Driveway % 4.46% 16.11% % 6 Nance St. w/o Redlands Av % 4.46% 16.11% % 1 Source: Perris Circle 3 Traffic Impact Analysis, Urban Crossroads, Inc., March Total of vehicle mix percentage values rounded to the nearest one-hundredth. TABLE 6-7: EA PLUS CUMULATIVE WITH PROJECT CONDITIONS VEHICLE MIX ID Roadway Segment Autos With Project 1 Medium Trucks Heavy Trucks Total 2 1 Redlands Av. s/o Harley Knox Bl % 3.21% 9.15% % 2 Redlands Av. s/o Nance St % 3.01% 8.04% % 3 Harley Knox Bl. w/o Driveway % 3.19% 9.11% % 4 Harley Knox Bl. w/o Redlands Av % 3.19% 9.11% % 5 Nance St. e/o Driveway % 3.94% 13.22% % 6 Nance St. w/o Redlands Av % 3.71% 11.86% % 1 Source: Perris Circle 3 Traffic Impact Analysis, Urban Crossroads, Inc., March Total of vehicle mix percentage values rounded to the nearest one-hundredth. 6.3 VIBRATION ASSESSMENT This analysis focuses on the potential ground-borne vibration associated with vehicular traffic and construction activities. Ground-borne vibration levels from automobile traffic are generally overshadowed by vibration generated by heavy trucks that roll over the same uneven roadway surfaces. However, due to the rapid drop-off rate of ground-borne vibration and the short duration of the associated events, vehicular traffic-induced ground-borne vibration is rarely perceptible beyond the roadway right-of-way, and rarely results in vibration levels that cause damage to buildings in the vicinity. However, while vehicular traffic is rarely perceptible, construction has the potential to result in varying degrees of temporary ground vibration, depending on the specific construction activities and equipment used. Ground vibration levels associated with various types of construction equipment are summarized on Table 6-8. Based on the representative vibration levels presented for various construction equipment types, it is possible to estimate the human response (annoyance) using the following vibration assessment methods defined by the FTA. To describe 28
35 the human response (annoyance) associated with vibration impacts the FTA provides the following equation: LVdB(D) = LVdB(25 ft) 30log(D/25) TABLE 6-8: VIBRATION SOURCE LEVELS FOR CONSTRUCTION EQUIPMENT Equipment Vibration Decibels (VdB) at 25 feet 1 Small bulldozer 58 Jackhammer 79 Loaded Trucks 86 Large bulldozer 87 Source: Federal Transit Administration, Transit Noise and Vibration Impact Assessment, May
36 This page intentionally left blank 30
37 7 OFF-SITE TRANSPORTATION NOISE IMPACTS To assess the off-site transportation CNEL noise level impacts associated with the proposed Project, noise contours were developed based on the Perris Circle 3 Traffic Impact Analysis. (3) Noise contour boundaries represent the equal levels of noise exposure and are measured in CNEL from the center of the roadway. Noise contours were developed for the following traffic scenarios: Existing Without / With Project: This scenario refers to the existing present-day noise conditions, without and with the proposed Project. Existing plus Ambient (EA) Without / With Project: This scenario refers to the background noise conditions without and with the proposed Project plus ambient growth. EA plus Cumulative (EAC) Without / With Project: This scenario refers to the background noise conditions without and with the proposed Project plus ambient growth. This scenario corresponds to future conditions, and includes all cumulative projects identified in the Traffic Impact Analysis. 7.1 TRAFFIC NOISE CONTOURS Noise contours were used to assess the Project's incremental traffic-related noise impacts at land uses adjacent to roadways conveying Project traffic based on the PVCC SP EIR significance criteria discussed in Section 4.1. The noise contours represent the distance to noise levels of a constant value and are measured from the center of the roadway for the 70, 65, and 60 dba noise levels. The noise contours do not take into account the effect of any existing noise barriers or topography that may attenuate ambient noise levels. In addition, because the noise contours reflect modeling of vehicular noise on area roadways, they appropriately do not reflect noise contributions from the surrounding stationary noise sources within the Project study area. Tables 7-1 through 7-6 present a summary of the exterior traffic noise levels, without barrier attenuation, for the six study area roadway segments analyzed from the without Project to the with Project conditions in each of the three timeframes: Existing, Existing plus Ambient (EA), and EA plus Cumulative (EAC) conditions. Appendix 7.1 includes a summary of the traffic noise level contours for each of the six traffic scenarios. 31
38 TABLE 7-1: EXISTING WITHOUT PROJECT CONDITIONS NOISE CONTOURS ID Road Segment Adjacent Existing Land Use 1 CNEL at Nearest Adjacent Land Use (dba) 2 Distance to Contour from Centerline (Feet) 70 dba CNEL 65 dba CNEL 1 Redlands Av. s/o Harley Knox Bl. Industrial 68.5 RW Redlands Av. s/o Nance St. Industrial 68.5 RW Harley Knox Bl. w/o Driveway 1 Vacant, Residential 69.2 RW Harley Knox Bl. w/o Redlands Av. Vacant 69.2 RW Nance St. e/o Driveway 2 Industrial 59.8 RW RW RW 6 Nance St. w/o Redlands Av. Industrial 59.8 RW RW RW 1 Source: Google Earth aerial imagery. 2 The CNEL is calculated at the boundary of the right-of-way of each roadway and the property line of the nearest adjacent land use. "RW" = Location of the respective noise contour falls within the right-of-way of the road. 60 dba CNEL TABLE 7-2: EXISTING WITH PROJECT CONDITIONS NOISE CONTOURS ID Road Segment Adjacent Existing Land Use 1 CNEL at Nearest Adjacent Land Use (dba) 2 Distance to Contour from Centerline (Feet) 70 dba CNEL 65 dba CNEL 1 Redlands Av. s/o Harley Knox Bl. Industrial 69.3 RW Redlands Av. s/o Nance St. Industrial 68.5 RW Harley Knox Bl. w/o Driveway 1 Vacant, Residential Harley Knox Bl. w/o Redlands Av. Vacant Nance St. e/o Driveway 2 Industrial 63.1 RW RW 48 6 Nance St. w/o Redlands Av. Industrial 63.1 RW RW 48 1 Source: Google Earth aerial imagery. 2 The CNEL is calculated at the boundary of the right-of-way of each roadway and the property line of the nearest adjacent land use. "RW" = Location of the respective noise contour falls within the right-of-way of the road. 60 dba CNEL 32
39 TABLE 7-3: EXISTING PLUS AMBIENT WITHOUT PROJECT CONDITIONS NOISE CONTOURS ID Road Segment Adjacent Existing Land Use 1 CNEL at Nearest Adjacent Land Use (dba) 2 Distance to Contour from Centerline (Feet) 70 dba CNEL 65 dba CNEL 1 Redlands Av. s/o Harley Knox Bl. Industrial 68.7 RW Redlands Av. s/o Nance St. Industrial 68.6 RW Harley Knox Bl. w/o Driveway 1 Vacant, Residential 69.3 RW Harley Knox Bl. w/o Redlands Av. Vacant 69.3 RW Nance St. e/o Driveway 2 Industrial 60.0 RW RW 30 6 Nance St. w/o Redlands Av. Industrial 60.0 RW RW 30 1 Source: Google Earth aerial imagery. 2 The CNEL is calculated at the boundary of the right-of-way of each roadway and the property line of the nearest adjacent land use. "RW" = Location of the respective noise contour falls within the right-of-way of the road. 60 dba CNEL TABLE 7-4: EXISTING PLUS AMBIENT WITH PROJECT CONDITIONS NOISE CONTOURS ID Road Segment Adjacent Existing Land Use 1 CNEL at Nearest Adjacent Land Use (dba) 2 Distance to Contour from Centerline (Feet) 70 dba CNEL 65 dba CNEL 1 Redlands Av. s/o Harley Knox Bl. Industrial 69.5 RW Redlands Av. s/o Nance St. Industrial 68.7 RW Harley Knox Bl. w/o Driveway 1 Vacant, Residential Harley Knox Bl. w/o Redlands Av. Vacant Nance St. e/o Driveway 2 Industrial 63.1 RW RW 49 6 Nance St. w/o Redlands Av. Industrial 63.1 RW RW 49 1 Source: Google Earth aerial imagery. 2 The CNEL is calculated at the boundary of the right-of-way of each roadway and the property line of the nearest adjacent land use. "RW" = Location of the respective noise contour falls within the right-of-way of the road. 60 dba CNEL 33
40 TABLE 7-5: EA PLUS CUMULATIVE WITHOUT PROJECT CONDITIONS NOISE CONTOURS ID Road Segment Adjacent Existing Land Use 1 CNEL at Nearest Adjacent Land Use (dba) 2 Distance to Contour from Centerline (Feet) 70 dba CNEL 65 dba CNEL 1 Redlands Av. s/o Harley Knox Bl. Industrial Redlands Av. s/o Nance St. Industrial 69.8 RW Harley Knox Bl. w/o Driveway 1 Vacant, Residential Harley Knox Bl. w/o Redlands Av. Vacant Nance St. e/o Driveway 2 Industrial 62.2 RW RW 42 6 Nance St. w/o Redlands Av. Industrial 63.7 RW RW 53 1 Source: Google Earth aerial imagery. 2 The CNEL is calculated at the boundary of the right-of-way of each roadway and the property line of the nearest adjacent land use. "RW" = Location of the respective noise contour falls within the right-of-way of the road. 60 dba CNEL TABLE 7-6: EA PLUS CUMULATIVE WITH PROJECT CONDITIONS NOISE CONTOURS ID Road Segment Adjacent Existing Land Use 1 CNEL at Nearest Adjacent Land Use (dba) 2 Distance to Contour from Centerline (Feet) 70 dba CNEL 65 dba CNEL 1 Redlands Av. s/o Harley Knox Bl. Industrial Redlands Av. s/o Nance St. Industrial 69.8 RW Harley Knox Bl. w/o Driveway 1 Vacant, Residential Harley Knox Bl. w/o Redlands Av. Vacant Nance St. e/o Driveway 2 Industrial 64.4 RW RW 59 6 Nance St. w/o Redlands Av. Industrial 65.3 RW Source: Google Earth aerial imagery. 2 The CNEL is calculated at the boundary of the right-of-way of each roadway and the property line of the nearest adjacent land use. "RW" = Location of the respective noise contour falls within the right-of-way of the road. 60 dba CNEL 7.2 EXISTING CONDITION PROJECT TRAFFIC NOISE LEVEL CONTRIBUTIONS Table 7-1 presents the Existing without Project conditions CNEL noise levels. The Exiting without Project exterior noise levels are expected to range from 59.8 to 69.2 dba CNEL, without accounting for any noise attenuation features such as noise barriers or topography. Table 7-2 shows the Existing with Project conditions will range from 63.1 to 70.0 dba CNEL. As shown on Table 7-7 the Project is expected to generate an exterior noise level increase of up to 3.3 dba CNEL, which will remain below the significance thresholds identified in Section 4. Therefore, the off-site Project-related traffic noise level increase is considered a less than significant impact under Existing with Project conditions. 34
41 TABLE 7-7: EXISTING CONDITION OFF-SITE PROJECT-RELATED TRAFFIC NOISE IMPACTS ID Road Segment Adjacent Existing Land Use 1 No Project CNEL at Adjacent Land Use (dba) 2 With Project Project Addition Noise- Sensitive Land Use? 3 Threshold Exceeded? 4 1 Redlands Av. s/o Harley Knox Bl. Industrial No No 2 Redlands Av. s/o Nance St. Industrial No No 3 Harley Knox Bl. w/o Driveway 1 Vacant, Residential Yes No 4 Harley Knox Bl. w/o Redlands Av. Vacant No No 5 Nance St. e/o Driveway 2 Industrial No No 6 Nance St. w/o Redlands Av. Industrial No No 1 Source: Google Earth aerial imagery. 2 The CNEL is calculated at the boundary of the right-of-way of each roadway and the property line of the nearest adjacent land use. 3 "Yes" = Existing, noise-sensitive land uses adjacent to the study area roadway segment. 4 Significance Criteria (Section 4). 7.3 EXISTING PLUS AMBIENT PROJECT TRAFFIC NOISE LEVEL CONTRIBUTIONS Table 7-8 presents a comparison of the Existing plus Ambient (EA) without and with Project conditions CNEL noise levels. Table 7-3 shows that the exterior noise levels without accounting for any noise attenuation features are expected to range from 60.0 to 69.3 dba CNEL without the Project. Table 7-4 presents the EA with Project conditions noise level contours that are expected to range from 63.1 to 70.2 dba CNEL. As shown on Table 7-8 the Project is expected to generate an exterior noise level increase of up to 3.1 dba CNEL, which will remain below the significance thresholds identified in Section 4. Therefore, the off-site Project-related traffic noise level increase is considered a less than significant impact under EA conditions. 35
42 TABLE 7-8: EA OFF-SITE PROJECT-RELATED TRAFFIC NOISE IMPACTS ID Road Segment Adjacent Existing Land Use 1 No Project CNEL at Adjacent Land Use (dba) 2 With Project Project Addition Noise- Sensitive Land Use? 3 Threshold Exceeded? 4 1 Redlands Av. s/o Harley Knox Bl. Industrial No No 2 Redlands Av. s/o Nance St. Industrial No No 3 Harley Knox Bl. w/o Driveway 1 Vacant, Residential Yes No 4 Harley Knox Bl. w/o Redlands Av. Vacant No No 5 Nance St. e/o Driveway 2 Industrial No No 6 Nance St. w/o Redlands Av. Industrial No No 1 Source: Google Earth aerial imagery. 2 The CNEL is calculated at the boundary of the right-of-way of each roadway and the property line of the nearest adjacent land use. 3 "Yes" = Existing, noise-sensitive land uses adjacent to the study area roadway segment. 4 Significance Criteria (Section 4). 7.4 EXISTING PLUS AMBIENT PLUS CUMULATIVE PROJECT TRAFFIC NOISE LEVEL CONTRIBUTIONS Table 7-9 presents a comparison of the EA plus Cumulative (EAC) without and with Project conditions CNEL noise levels. Table 7-5 shows that the exterior noise levels without accounting for any noise attenuation features are expected to range from 62.2 to 71.2 dba CNEL without the Project. Table 7-6 presents the EAC with Project conditions noise level contours that are expected to range from 64.4 to 71.8 dba CNEL. As shown on Table 7-9 the Project is expected to generate an exterior noise level increase of up to 2.2 dba CNEL, which would remain below the significance thresholds identified in Section 4. Therefore, the off-site Project-related traffic noise level increase is considered a less than significant impact under EAC conditions. TABLE 7-9: EAC OFF-SITE PROJECT-RELATED TRAFFIC NOISE IMPACTS ID Road Segment Adjacent Existing Land Use 1 No Project CNEL at Adjacent Land Use (dba) 2 With Project Project Addition Noise- Sensitive Land Use? 3 Threshold Exceeded? 4 1 Redlands Av. s/o Harley Knox Bl. Industrial No No 2 Redlands Av. s/o Nance St. Industrial No No 3 Harley Knox Bl. w/o Driveway 1 Vacant, Residential Yes No 4 Harley Knox Bl. w/o Redlands Av. Vacant No No 5 Nance St. e/o Driveway 2 Industrial No No 6 Nance St. w/o Redlands Av. Industrial No No 1 Source: Google Earth aerial imagery. 2 The CNEL is calculated at the boundary of the right-of-way of each roadway and the property line of the nearest adjacent land use. 3 "Yes" = Existing, noise-sensitive land uses adjacent to the study area roadway segment. 4 Significance Criteria (Section 4). 36
43 8 RECEIVER LOCATIONS To assess the potential for long-term operational and short-term construction noise impacts, the following four receiver locations, as shown on Exhibit 8-A, were identified as representative locations for analysis. As identified in the PVCC SP EIR, sensitive receivers are areas where humans are participating in activities that may be subject to the stress of significant interference from noise and often include residential dwellings, mobile homes, hotels, motels, hospitals, nursing homes, educational facilities, and libraries. Other receivers include office and industrial buildings, which are not considered as sensitive as single-family homes, but are still protected by City of Perris land use compatibility standards, as discussed below. Representative sensitive receivers in the Project study area include single-family residential homes as described below. Other sensitive land uses in the Project study area that are located at greater distances than those identified in this noise study will experience lower noise levels than those presented in this report due to the additional attenuation from distance and the shielding of intervening structures. R1: Located approximately 442 feet northwest of the Project site, R1 represents an existing residential home on Harley Knox Boulevard. A long-term noise measurement was taken near this location, L1, to describe the existing ambient noise environment. R2: Located approximately 161 feet southwest of the Project site, R2 represents an existing residential home on Nance Street. A long-term noise measurement was taken near this location, L2, to describe the existing ambient noise environment. R3: Location R3 represents an existing residential home located roughly 539 feet west of the Project site on Nance Street. A long-term noise measurement was taken near this location, L2, to describe the existing ambient noise environment. R4: Location R4 represents an existing residential home located roughly 1,239 feet southwest of the Project site on Nance Street. A long-term noise measurement was taken near this location, L3, to describe the existing ambient noise environment. 37

44 EXHIBIT 8-A: RECEIVER LOCATIONS 38
45 9 OPERATIONAL NOISE IMPACTS This section analyzes the potential operational noise impacts at the nearby receiver locations, identified in Section 8, resulting from operation of the proposed Perris Circle 3 Project. Exhibit 9-A identifies the representative receiver locations and noise source locations used to assess the operational noise levels. 9.1 OPERATIONAL NOISE SOURCES At the time this noise analysis was prepared the future tenants of the proposed Project were unknown. To present the potential worst-case noise conditions, this analysis assumes the Project would be operational 24 hours per day, seven days per week. The Project business operations would primarily be conducted within the enclosed buildings, except for traffic movement, parking, as well as loading and unloading of trucks at designated loading bays. The on-site Project-related noise sources are expected to include: idling trucks, delivery truck activities, backup alarms, as well as loading and unloading of dry goods, roof-top air conditioning units, and parking lot vehicle movements. This noise analysis is intended to describe noise level impacts associated with the expected typical warehouse and distribution storage activities at the Project site. At the time of this analysis, no cold storage was planned at the Project site, and therefore is not analyzed in this report. 9.2 REFERENCE NOISE LEVELS Since the future tenants of the proposed Project are unknown, the Project s operational noise levels were estimated based on reference noise level measurements of similar operational activities. The reference noise levels are intended to describe the expected operational noise sources that may include idling trucks, delivery truck activities, backup alarms, as well as loading and unloading of dry goods, roof-top air conditioning units, and parking lot vehicle movements. To estimate the Project off-site operational noise impacts associated with the Perris Circle 3, the following reference noise level measurements were collected from existing logistics warehouse operations containing similar operational noise sources, as shown on Table 9-1. Appendix 9.1 includes reference noise source photos MOTIVATIONAL FULFILLMENT & LOGISTICS SERVICES DISTRIBUTION FACILITY (DRY GOODS) Short-term reference noise level measurements were collected on Wednesday, January 7 th, 2015, by Urban Crossroads, Inc. at the Motivational Fulfillment & Logistics Services distribution facility located at 6810 Bickmore Avenue in the City of Chino. The noise level measurements represent the typical weekday dry goods logistics warehouse operation in a single building with a loading dock area on the western side of the building façade. Up to ten trucks were observed in the loading dock area including a combination of track trailer semi-trucks, two-axle delivery trucks, and background forklift operations. 39
46 IDLING, DELIVERY TRUCK ACTIVITIES, BACKUP ALARMS, & LOADING/UNLOADING OF DRY GOODS The unloading/docking activity noise level measurement was taken over a fifteen-minute period and represents multiple noise sources taken from the center of loading dock activities generating a reference noise level of 62.8 dba Leq at a uniform distance of 50 feet. At this measurement location, the noise sources associated with employees unloading a docked truck container included the squeaking of the truck s shocks when weight was removed from the truck, employees playing music over a radio, as well as a forklift horn and backup alarm. In addition, during the noise level measurement a truck entered the loading dock area and proceeded to reverse and dock in a nearby loading bay, adding truck engine and air brakes noise. While the specific noise levels at the Project site will depend on the actual tenant, the intensity and the daytime / nighttime hours of operation, a reference noise level of 62.8 dba Leq for the unloading/docking activity at a normalized distance of 50 feet is used to describe the peak Project operational noise activity since it represents similar operational characteristics. The reference noise level of 62.8 dba Leq at 50 feet is intended to describe the worst-case noise levels associated with the expected typical warehouse and distribution storage operations at the Project site ROOF-TOP AIR CONDITIONING UNITS To assess the impacts created by the roof-top air conditioning units at the Project buildings, reference noise levels measurements were taken at the Santee Walmart on July 27 th, Located at 170 Town Center Parkway in the City of Santee, the noise level measurements describe a single mechanical roof-top air conditioning unit on the roof of an existing Walmart store. The reference noise level represents a Lennox SCA120 series 10-ton model packaged air conditioning unit. At 5 feet from the roof-top air conditioning unit, the exterior noise levels were measured at 77.2 dba Leq. Using the uniform reference distance of 50 feet, the noise level is 57.2 dba Leq. The operating conditions of the reference noise level measurement reflect peak summer cooling requirements with measured temperatures approaching 96 degrees Fahrenheit ( F) with average daytime temperatures of 82 F. The roof-top air condition units were observed to operate the most during the daytime hours, for a total of 39 minutes per hour, and are anticipated to operate during the daytime and nighttime hours at the Project site. The noise attenuation provided by a parapet wall is not reflected in this reference noise level measurement PARKING LOT VEHICLE MOVEMENTS (AUTOS) To determine the noise levels associated with parking lot vehicle movements, Urban Crossroads collected reference noise level measurements over a 24-hour period on May 17 th, 2017 at the parking lot for the Panasonic Avionics Corporation in the City of Lake Forest. The peak hour of activity measured over the 24-hour noise level measurement period occurred between 12:00 p.m. to 1:00 p.m., or the typical lunch hour for employees working in the area. The measured reference noise level at 50 feet from parking lot vehicle movements was measured at 41.7 dba Leq. The parking lot noise levels are mainly due to cars pulling in and out of spaces during peak lunch hour activity and employees talking. Noise associated with parking lot vehicle movements is expected to operate for the entire hour (60 minutes). 40
47 Noise Source TABLE 9-1: REFERENCE NOISE LEVEL MEASUREMENTS Duration (hh:mm:ss) Distance From Source (Feet) Noise Source Height (Feet) Hourly Activity (Minutes) 3 Noise Level (dba Ref. Distance Unloading/Docking Activity 1 00:15:00 30' 8' Roof-Top Air Conditioning Units 2 96:00:00 5' 25' Parking Lot Vehicle Movements 3 01:00:00 10' 5' Reference noise level measurements were collected on 1/7/2015 from the existing operations of the Motivational Fulfillment & Logistics Services distribution facility located at 6810 Bickmore Avenue in the City of Chino. 2 As measured by Urban Crossroads, Inc. on 7/27/2015 at the Santee Walmart located at 170 Town Center Parkway. 3 As measured by Urban Crossroads, Inc. on 5/17/2017 at the Panasonic Avionics Corporation parking lot in the City of Lake Forest. 4 Anticipated duration (minutes within the hour) of noise activity during typical hourly conditions expected at the Project site based on the reference noise level measurement 50 Feet 41

48 EXHIBIT 9-A: OPERATIONAL NOISE SOURCE LOCATIONS 42
49 9.3 PROJECT OPERATIONAL NOISE LEVELS Using the reference noise levels to represent the proposed warehouse operations that include idling trucks, delivery truck activities, backup alarms, as well as loading and unloading of dry goods, roof-top air conditioning units, and parking lot vehicle movements, Urban Crossroads, Inc. calculated the operational source noise levels that are expected to be generated at the Project site and the Project-related noise level increases that would be experienced at each of the sensitive receiver locations. The operational noise level calculations, shown on Table 9-2, account for the distance attenuation provided due to geometric spreading when sound from a localized stationary source (i.e., a point source) propagates uniformly outward in a spherical pattern. With geometric spreading, sound levels attenuate (or decrease) at a rate of 6 db for each doubling of distance from a point source (e.g. idling trucks, delivery truck activities, backup alarms, as well as loading and unloading of dry goods, roof-top air conditioning units, and parking lot vehicle movements). Table 9-2 presents the combined total Project-only operational noise level projections at the nearby sensitive receiver locations in comparison with the City of Perris Municipal Code exterior noise level standards. The Project operational noise levels at the nearby sensitive receiver locations are shown to range from 34.7 to 46.7 dba Leq. Based on the results of this analysis, the Project operational noise levels associated with the Perris Circle 3 will satisfy the City of Perris Municipal Code exterior noise level standards. The operational noise level calculations are included in Appendix 9.2. TABLE 9-2: OPERATIONAL NOISE LEVEL COMPLIANCE (DBA L EQ) Receiver Location 1 Unloading/ Docking Activity Noise Sources 2 Roof-Top Air Conditioning Unit Parking Lot Vehicle Movements Combined Operational Noise Levels (dba Leq) 3 Noise Level Standard (dba Leq) 4 Threshold Exceeded? 5 Daytime Nighttime Daytime Nighttime R No No R No No R No No R No No 1 See Exhibit 9-A for the receiver and noise source locations. 2 Reference noise sources as shown on Table Calculations for each noise source are provided in Appendix Exterior noise level standard as shown on Table Do the estimated Project operational noise source activities exceed the noise level threshold? 43
50 Consistent with the City of Perris General Plan Noise Element, Implementation Measure V.A.1, Project operational noise levels at nearby sensitive receiver locations cannot exceed 60 dba CNEL. The CNEL metric is typically used to describe 24-hour transportation-related noise levels, however, the City of Perris General Plan Noise Element requires new industrial land use such as the Project to demonstrate compliance at any noise-sensitive land use within 160 feet of the Project site. Table 9-3 includes the evening and nighttime adjustments made to the operational noise levels during the applicable hours to convert the worst-case hourly operational noise levels (Leq) to 24-hour CNELs. Table 9-3 indicates that the 24-hour noise levels associated with the Perris Circle 3 Project at the nearby sensitive receiver locations are expected to range from 41.1 to 53.1 dba CNEL. The Project-related operational noise levels shown on Table 9-3 will satisfy the City of Perris 60 dba CNEL exterior noise level standards at the nearby sensitive receiver locations. Appendix 9.3 includes the CNEL adjustment calculations for each hour at each of the noise-sensitive receiver locations. TABLE 9-3: OPERATIONAL NOISE LEVEL COMPLIANCE (DBA CNEL) Receiver Location 1 Combined Operational Noise Levels (dba CNEL) 2 Noise Level Standard (dba CNEL) 3 Threshold Exceeded? 4 R No R No R No R No 1 See Exhibit 9-A for the receiver and noise source locations. 2 The CNEL adjustments add 5 decibels to dba Leq sound levels in the evening from 7:00 p.m. to 10:00 p.m., and 10 decibels to dba Leq sound levels at night between 10:00 p.m. and 7:00 a.m., provided in Appendix Exterior noise level standard as shown on Table Do the estimated Project operational noise source activities exceed the noise level threshold? 44
51 9.4 PROJECT OPERATIONAL NOISE CONTRIBUTION To describe the Project operational noise level contributions, the Project operational noise levels are combined with the existing ambient noise levels measurements for the nearby receiver locations potentially impacted by Project operational noise sources. Since the units used to measure noise, decibels (db), are logarithmic units, the Project-operational and existing ambient noise levels cannot be combined using standard arithmetic equations. (12) Instead, they must be logarithmically added using the following base equation: SPLTotal = 10log10[10 SPL1/ SPL2/ SPLn/10 ] Where SPL1, SPL2, etc. are equal to the sound pressure levels being combined, or in this case, the Project-operational and existing ambient noise levels. The difference between the combined Project and ambient noise levels describe the Project noise level contributions to the existing ambient noise environment. Noise levels that would be experienced at receiver locations when Project-source noise is added to the ambient daytime and nighttime conditions are presented on Tables 9-4 and 9-5. As indicated on Tables 9-4 and 9-5, the Project will contribute a daytime operational noise level increase of up to 0.8 dba Leq and a nighttime operational noise level increase of up to 0.8 dba Leq at the sensitive receiver locations. Since the Project-related operational noise level contributions would not exceed the significance criteria discussed in Section 4, the increases at the sensitive receiver locations are considered less than significant. On this basis, Project operational noise would not result in a substantial temporary/periodic, or permanent increase in ambient noise levels in the Project vicinity above levels existing without the Project, and impacts in these regards will be less than significant. TABLE 9-4: PROJECT DAYTIME NOISE LEVEL CONTRIBUTIONS Receiver Location 1 Total Project Operational Noise Level 2 Measurement Location 3 Reference Ambient Noise Levels 4 Combined Project and Ambient 5 Project Contribution 6 Threshold Exceeded? 7 R L No R L No R L No R L No 1 See Exhibit 9-A for the sensitive receiver locations. 2 Total Project operational noise levels as shown on Table Reference noise level measurement locations as shown on Exhibit 5-A. 4 Observed daytime ambient noise levels as shown on Table Represents the combined ambient conditions plus the Project activities. 6 The noise level increase expected with the addition of the proposed Project activities. 7 Significance Criteria as defined in Section 4. 45
52 TABLE 9-5: PROJECT NIGHTTIME NOISE LEVEL CONTRIBUTIONS Receiver Location 1 Total Project Operational Noise Level 2 Measurement Location 3 Reference Ambient Noise Levels 4 Combined Project and Ambient 5 Project Contribution 6 Threshold Exceeded? 7 R L No R L No R L No R L No 1 See Exhibit 9-A for the sensitive receiver locations. 2 Total Project operational noise levels as shown on Table Reference noise level measurement locations as shown on Exhibit 5-A. 4 Observed nighttime ambient noise levels as shown on Table Represents the combined ambient conditions plus the Project activities. 6 The noise level increase expected with the addition of the proposed Project activities. 7 Significance Criteria as defined in Section OPERATIONAL VIBRATION IMPACTS Although the human threshold of perception for vibration is around 65 VdB, human response to vibration is not usually significant unless the vibration exceeds 70 VdB. Truck vibration levels are dependent on vehicle characteristics, load, speed, and pavement condition. Typical vibration levels for heavy trucks at normal traffic speeds do not exceed 65 VdB, and therefore, will be below the FTA vibration threshold of 80 VdB at nearby sensitive receiver locations. Truck deliveries transiting on site will be travelling at very low speeds, so it is expected that delivery truck vibration impacts at nearby homes will not exceed the 80 VdB vibration threshold. 46
53 10 CONSTRUCTION IMPACTS This section analyzes potential impacts resulting from the short-term construction activities associated with the development of the Project. Exhibit 10-A shows the construction noise source locations in relation to the nearby sensitive receiver locations previously described in Section CONSTRUCTION NOISE LEVELS Noise generated by the Project construction equipment will include a combination of trucks, power tools, concrete mixers, and portable generators that when combined can reach high levels. The number and mix of construction equipment is expected to occur in the following stages: Site Preparation Grading Building Construction Paving Architectural Coating This construction noise analysis was prepared using reference noise level measurements taken by Urban Crossroads, Inc. to describe the typical construction activity noise levels for each stage of Project construction. The construction reference noise level measurements represent a list of typical construction activity noise levels. Noise levels generated by heavy construction equipment can range from approximately 68 dba to in excess of 80 dba when measured at 50 feet. However, these noise levels diminish with distance from the construction site at a rate of 6 dba per doubling of distance. For example, a noise level of 80 dba measured at 50 feet from the noise source to the receiver would be reduced to 74 dba at 100 feet from the source to the receiver, and would be further reduced to 68 dba at 200 feet from the source to the receiver. The construction stages are based on the Perris Circle 3 Air Quality Impact Analysis prepared by Urban Crossroads, Inc. (16) 47
54 EXHIBIT 10-A: CONSTRUCTION NOISE SOURCE LOCATIONS 48
55 10.2 CONSTRUCTION REFERENCE NOISE LEVELS To describe the Project construction noise levels, measurements were collected for similar activities at several construction sites. Table 10-1 provides a summary of the 17-construction reference noise level measurements. Since the reference noise levels were collected at varying distances of 30 feet and 50 feet, all construction noise level measurements presented on Table 10-1 have been adjusted for consistency to describe a common reference distance of 50 feet. TABLE 10-1: CONSTRUCTION REFERENCE NOISE LEVELS ID Noise Source Reference Distance From Source (Feet) Reference Noise Reference Distance (dba Leq) Reference Noise 50 Feet (dba Leq) 7 1 Truck Pass-Bys & Dozer Activity 1 30' Dozer Activity 1 30' Construction Vehicle Maintenance Activities 2 30' Foundation Trenching 2 30' Rough Grading Activities 2 30' Residential Framing 3 30' Water Truck Pass-By & Backup Alarm 4 30' Dozer Pass-By 4 30' Two Scrapers & Water Truck Pass-By 4 30' Two Scrapers Pass-By 4 30' Scraper, Water Truck, & Dozer Activity 4 30' Concrete Mixer Truck Movements 5 50' Concrete Paver Activities 5 30' Concrete Mixer Pour & Paving Activities 5 30' Concrete Mixer Backup Alarms & Air Brakes 5 50' Concrete Mixer Pour Activities 5 50' Forklift, Jackhammer, & Metal Truck Bed Loading 50' As measured by Urban Crossroads, Inc. on 10/14/15 at a business park construction site located at the northwest corner of Barranca Parkway and Alton Parkway in the City of Irvine. 2 As measured by Urban Crossroads, Inc. on 10/20/15 at a construction site located in Rancho Mission Viejo. 3 As measured by Urban Crossroads, Inc. on 10/20/15 at a residential construction site located in Rancho Mission Viejo. 4 As measured by Urban Crossroads, Inc. on 10/30/15 during grading operations within an industrial construction site located in the City of Ontario. 5 Reference noise level measurements were collected from a nighttime concrete pour at an industrial construction site, located at San Bernardino Avenue in the City of Redlands, between 1:00 a.m. to 2:00 a.m. on 7/1/15. 6 As measured by Urban Crossroads, Inc. on 9/9/16 during the demolition of an existing paved parking lot at 41 Corporate Park in Irvine. 7 Reference noise levels are calculated at 50 feet using a drop off rate of 6 dba per doubling of distance (point source). 49
56 10.3 CONSTRUCTION NOISE ANALYSIS Using the reference construction equipment noise levels, calculations of the Project construction noise level impacts at the nearby sensitive receiver locations were completed. Tables 10-2 to 10-6 present the short-term construction noise levels for each stage of construction. Table 10-7 provides a summary of the construction noise levels by phase at the noise receiver locations. Based on the stages of construction, the noise impacts associated with the proposed Project are expected to create temporarily high noise levels at the nearby receiver locations. To assess the highest construction noise levels, this analysis shows the noise impacts when the equipment with the highest reference noise level is operating at the closest point from the primary construction activity to each receiver location. TABLE 10-2: SITE PREPARATION EQUIPMENT NOISE LEVELS Reference Construction Activity 1 Reference Noise 50 Feet (dba Leq) Truck Pass-Bys & Dozer Activity 59.2 Dozer Activity 64.2 Dozer Pass-By 79.6 Highest Reference Noise Level at 50 Feet (dba Leq): 79.6 Receiver Location Distance To Construction Activity (Feet) 2 Distance Attenuation (dba Leq) 3 Estimated Noise Barrier Attenuation (dba Leq) 4 Construction Noise Level (dba Leq) R1 485' R2 161' R3 549' R4 1,276' Reference construction noise level measurements taken by Urban Crossroads, Inc. 2 Distance from the nearest point of construction activity to the nearest receiver. 3 Point (stationary) source drop off rate of 6.0 dba per doubling of distance. 4 Estimated barrier/berm attenuation from existing barriers/berms in the Project study area. 50
57 TABLE 10-3: GRADING EQUIPMENT NOISE LEVELS Reference Construction Activity 1 Reference Noise 50 Feet (dba Leq) Truck Pass-Bys & Dozer Activity 59.2 Dozer Activity 64.2 Rough Grading Activities 73.5 Dozer Pass-By 79.6 Highest Reference Noise Level at 50 Feet (dba Leq): 79.6 Receiver Location Distance To Construction Activity (Feet) 2 Distance Attenuation (dba Leq) 3 Estimated Noise Barrier Attenuation (dba Leq) 4 Construction Noise Level (dba Leq) R1 485' R2 161' R3 549' R4 1,276' Reference construction noise level measurements taken by Urban Crossroads, Inc. 2 Distance from the nearest point of construction activity to the nearest receiver. 3 Point (stationary) source drop off rate of 6.0 dba per doubling of distance. 4 Estimated barrier/berm attenuation from existing barriers/berms in the Project study area. 51
58 TABLE 10-4: BUILDING CONSTRUCTION EQUIPMENT NOISE LEVELS Reference Construction Activity 1 Reference Noise 50 Feet (dba Leq) Construction Vehicle Maintenance Activities 67.5 Foundation Trenching 68.2 Highest Reference Noise Level at 50 Feet (dba Leq): 68.2 Receiver Location Distance To Construction Activity (Feet) 2 Distance Attenuation (dba Leq) 3 Estimated Noise Barrier Attenuation (dba Leq) 4 Construction Noise Level (dba Leq) R1 485' R2 161' R3 549' R4 1,276' Reference construction noise level measurements taken by Urban Crossroads, Inc. 2 Distance from the nearest point of construction activity to the nearest receiver. 3 Point (stationary) source drop off rate of 6.0 dba per doubling of distance. 4 Estimated barrier/berm attenuation from existing barriers/berms in the Project study area. 52
59 TABLE 10-5: PAVING EQUIPMENT NOISE LEVELS Reference Construction Activity 1 Reference Noise 50 Feet (dba Leq) Concrete Mixer Truck Movements 71.2 Concrete Paver Activities 65.6 Concrete Mixer Pour & Paving Activities 65.9 Concrete Mixer Backup Alarms & Air Brakes 71.6 Concrete Mixer Pour Activities 67.7 Highest Reference Noise Level at 50 Feet (dba Leq): 71.6 Receiver Location Distance To Construction Activity (Feet) 2 Distance Attenuation (dba Leq) 3 Estimated Noise Barrier Attenuation (dba Leq) 4 Construction Noise Level (dba Leq) R1 485' R2 161' R3 549' R4 1,276' Reference construction noise level measurements taken by Urban Crossroads, Inc. 2 Distance from the nearest point of construction activity to the nearest receiver. 3 Point (stationary) source drop off rate of 6.0 dba per doubling of distance. 4 Estimated barrier/berm attenuation from existing barriers/berms in the Project study area. 53
60 TABLE 10-6: ARCHITECTURAL COATING EQUIPMENT NOISE LEVELS Reference Construction Activity 1 Reference Noise 50 Feet (dba Leq) Construction Vehicle Maintenance Activities 67.5 Highest Reference Noise Level at 50 Feet (dba Leq): 67.5 Receiver Location Distance To Construction Activity (Feet) 2 Distance Attenuation (dba Leq) 3 Estimated Noise Barrier Attenuation (dba Leq) 4 Construction Noise Level (dba Leq) R1 485' R2 161' R3 549' R4 1,276' Reference construction noise level measurements taken by Urban Crossroads, Inc. 2 Distance from the nearest point of construction activity to the nearest receiver. 3 Point (stationary) source drop off rate of 6.0 dba per doubling of distance. 4 Estimated barrier/berm attenuation from existing barriers/berms in the Project study area CONSTRUCTION NOISE THRESHOLDS OF SIGNIFICANCE The construction noise analysis shows that the highest construction noise levels will occur when equipment is operating at the closest point from primary construction activity to each sensitive receiver location. As shown on Table 10-7, the highest unmitigated construction noise levels are expected to range from 51.4 to 69.4 dba Leq at the nearby sensitive receiver locations. TABLE 10-7: UNMITIGATED CONSTRUCTION EQUIPMENT NOISE LEVEL SUMMARY (DBA L EQ) Construction Phase Hourly Noise Level (dba Leq) Receiver Highest Location 1 Site Building Architectural Construction Grading Paving Preparation Construction Coating Noise Levels 2 R R R R Noise receiver locations are shown on Exhibit 10-A. 2 Estimated construction noise levels during peak operating conditions. 54
61 As shown on Table 10-8, the highest Project construction noise levels will satisfy the 80 dba Leq City of Perris Municipal Code threshold for construction activity at the sensitive receiver locations. Therefore, impacts from Project construction noise levels are considered less than significant. TABLE 10-8: UNMITIGATED CONSTRUCTION EQUIPMENT NOISE LEVEL COMPLIANCE Receiver Location 1 Highest Activity Noise Levels 2 Construction Noise Levels (dba Leq) Threshold 3 Threshold Exceeded? 4 R No R No R No R No 1 Noise receiver locations are shown on Exhibit 10-A. 2 Highest construction noise levels during peak operating conditions, as shown on Table Construction noise level threshold as shown on Table Do the estimated Project construction noise levels meet the construction noise level threshold? 10.5 CONSTRUCTION VIBRATION IMPACTS Construction activity can result in varying degrees of ground vibration, depending on the equipment and methods used, distance to the affected structures and soil type. It is expected that ground-borne vibration from Project construction activities would cause only intermittent, localized intrusion. The proposed Project s construction activities most likely to cause vibration impacts are: Heavy Construction Equipment: Although all heavy mobile construction equipment has the potential of causing at least some perceptible vibration while operating close to building, the vibration is usually short-term and is not of sufficient magnitude to cause building damage. It is not expected that heavy equipment such as large bulldozers would operate close enough to any residences to cause a vibration impact. Trucks: Trucks hauling building materials to construction sites can be sources of vibration intrusion if the haul routes pass through residential neighborhoods on streets with bumps or potholes. Repairing the bumps and potholes generally eliminates the problem. Ground-borne vibration levels resulting from construction activities occurring within the Project site were estimated by data published by the Federal Transit Administration. Construction activities that would have the potential to generate low levels of ground-borne vibration within the Project site include grading. Using the vibration source level of construction equipment provided on Table 6-8 and the construction vibration assessment methodology published by the FTA, it is possible to estimate the Project vibration impacts. Table 10-9 presents the expected Project related vibration levels at the nearby receiver locations. 55
62 Based on the reference vibration levels provided by the FTA, a large bulldozer represents the peak source of vibration with a reference level of 87 VdB at 25 feet. At distances ranging from 161 to 1,276 feet from the Project construction activities, construction vibration levels are expected to range from 35.8 to 62.7 VdB, as shown on Table Using the construction vibration assessment methods provided by the FTA, Project construction vibration levels will remain below the FTA 80 VdB threshold at all sensitive receiver locations, and therefore, is considered a less than significant impact. Further, vibration levels at the site of the closest sensitive receiver are unlikely to be sustained during the entire construction period, but will occur rather only during the times that heavy construction equipment is operating at the Project site perimeter. Moreover, construction at the Project site will be restricted to daytime hours consistent with City of Perris requirements thereby eliminating potential vibration impacts during the sensitive nighttime hours. TABLE 10-9: UNMITIGATED CONSTRUCTION EQUIPMENT VIBRATION LEVELS Receiver Location 1 Distance to Construction Activity (Feet) Small Bulldozer Receiver Vibration Levels (VdB) 2 Jackhammer Loaded Trucks Large Bulldozer Highest Vibration Levels Threshold Exceeded? 3 R1 485' No R2 161' No R3 549' No R4 1,276' No 1 Noise receiver locations are shown on Exhibit 10-A. 2 Based on the Vibration Source Levels of Construction Equipment included on Table Does the peak vibration exceed the FTA maximum acceptable vibration standard of 80 VdB? Although Project construction noise and vibration impacts will be less than significant, the Project is required to incorporate the following mitigation measures (MM) from the PVCC Specific Plan Environmental Impact Report: MM Noise 1 MM Noise 2 MM Noise 3 MM Noise 4 During all project site excavation and grading on site, the construction contractors shall equip all construction equipment, fixed or mobile, with properly operating and maintained mufflers consistent with manufacturer s standards. The construction contractor shall place all stationary construction equipment so that emitted noise is directed away from the noise sensitive receptors nearest the project site. During construction, stationary construction equipment, stockpiling and vehicle staging areas would be placed a minimum of 446 feet away from the closest sensitive receptor. No combustion-powered equipment, such as pumps or generators, shall be allowed to operate within 446 feet of any occupied residence unless the equipment is surrounded by a noise protection barrier. Construction contractors of implementing development projects shall limit haul truck deliveries to the same hours specified for construction equipment. To the extent feasible, haul routes shall not pass sensitive land uses or residential dwellings. 56
63 11 REFERENCES 1. City of Perris. Perris Valley Commerce Center Specific Plan Environmental Impact Report. July State of California. California Environmental Quality Act, Appendix G Urban Crossroads, Inc. Perris Circle 3 Traffic Impact Analysis. March Office of Planning and Research. State of California General Plan Guidelines. October State of California California Green Building Standards Code. January City of Perris. General Plan Noise Element. August Municipal Code, Chapter 7.34 Noise Control. 8. U.S. Department of Transportation, Federal Transit Administration. Transit Noise and Vibration Impact Assessment. May FTA-VA Riverside County Airport Land Use Commission. March Air Reserve Base/Inland Port Airport Land Use Compatibility Plan. November California Court of Appeal. Gray v. County of Madera, F Cal.App.4th 1099; - Cal.Rptr.3d, October American National Standards Institute (ANSI). Specification for Sound Level Meters ANSI S /IEC : California Department of Transportation Environmental Program. Technical Noise Supplement - A Technical Supplement to the Traffic Noise Analysis Protocol. Sacramento, CA : s.n., September U.S. Department of Transportation, Federal Highway Administration. FHWA Highway Traffic Noise Prediction Model. December FHWA-RD California Department of Transportation Environmental Program, Office of Environmental Engineering. Use of California Vehicle Noise Reference Energy Mean Emission Levels (Calveno REMELs) in FHWA Highway Traffic Noise Prediction. September TAN California Department of Transportation. Traffic Noise Attenuation as a Function of Ground and Vegetation Final Report. June FHWA/CA/TL-95/ Urban Crossroads, Inc. Perris Circle 3 Air Quality Impact Analysis. March
64 This page intentionally left blank 58
 336-5979.")
65 12 CERTIFICATION The contents of this noise study report represent an accurate depiction of the noise environment and impacts associated with the proposed Perris Circle 3 Project. The information contained in this noise study report is based on the best available data at the time of preparation. If you have any questions, please contact me directly at (949) Bill Lawson, P.E., INCE Principal URBAN CROSSROADS, INC. 260 E. Baker St., Suite 200 Costa Mesa, CA (949) blawson@urbanxroads.com EDUCATION Master of Science in Civil and Environmental Engineering California Polytechnic State University, San Luis Obispo December, 1993 Bachelor of Science in City and Regional Planning California Polytechnic State University, San Luis Obispo June, 1992 PROFESSIONAL REGISTRATIONS PE Registered Professional Traffic Engineer TR 2537 January, 2009 AICP American Institute of Certified Planners June, 1997 January 1, 2012 PTP Professional Transportation Planner May, 2007 May, 2013 INCE Institute of Noise Control Engineering March, 2004 PROFESSIONAL AFFILIATIONS ASA Acoustical Society of America ITE Institute of Transportation Engineers PROFESSIONAL CERTIFICATIONS Certified Acoustical Consultant County of Orange February, 2011 FHWA-NHI Highway Traffic Noise Certificate of Training February,
66 This page intentionally left blank 60
67 APPENDIX 3.1: CITY OF PERRIS MUNICIPAL CODE 61
68 This page intentionally left blank 62
69 CHAPTER NOISE CONTROL Sec Declaration of policy. Excessive noise levels are detrimental to the health and safety of individuals. Noise is considered a public nuisance, and the city discourages unnecessary, excessive or annoying noises from all sources. Creating, maintaining, causing, or allowing to be created, caused or maintained, any noise or vibration in a manner prohibited by the provisions of the ordinance codi ed in this chapter is a public nuisance and shall be punishable as a misdemeanor. (Code 1972, ; Ord. No. 1082, 2(part), 2000) Sec De nitions. (a) General. The following words, terms and phrases, when used in this chapter, shall have the meanings ascribed to them in this section, except where the context clearly indicates a di erent meaning: Ambient noise means the all-encompassing noise associated with a given environment usually being composed of sounds from many sources near and far. For the purpose of this chapter, ambient noise level is the level obtained when the noise level is averaged over a period of ve minutes without inclusion of noise from isolated identi able sources at the location and time of day near that at which a comparison is to be made. Decibel (db) means an intensity unit which denotes the ratio between two quantities which are proportional to power; the number of decibels corresponding to the ratio is ten times the common logarithm of this ratio. Sound amplifying equipment means any machine or device for the ampli cation of the human voice, music or any other sound. The term "sound amplifying equipment" does not include standard vehicle radios when used and heard only by the occupants of the vehicle in which the vehicle radio is installed. The term "sound amplifying equipment," as used in this chapter, does not include warning devices on any vehicle used only for tra c safety purposes and shall not include communications equipment used by public or private utilities when restoring utility service following a public emergency or when doing work required to protect person or property from an imminent exposure to danger. Sound level (noise level) in decibels is the value of a sound measurement using the "A" weighting network of a sound level meter. Slow response of the sound level meter needle shall be used except where the sound is impulsive or rapidly varying in nature, in which case, fast response shall be used. Sound level meter means an instrument, including a microphone, an ampli er, an output meter and frequency weighting networks, for the measurement of sound levels, which satis es the pertinent requirements in American National Standards Institute's speci cation S or the most recent revision for type S-2A general purpose sound level meters. (b) Supplementary de nitions of technical terms. De nitions of technical terms not de ned in this section shall be obtained from the American National Standards Institute's Acoustical Terminology S or the most recent revision thereof. (Code 1972, ; Ord. No. 1082, 2(part), 2000) Sec Measurement methods. (a) Sound shall be measured with a sound level meter as de ned in section (b) Unless otherwise provided, outdoor measurements shall be taken with the microphone located at any point on the property line of the noise source but no closer than ve feet from any wall or vertical obstruction and three to ve feet above ground level whenever possible. (c) Unless otherwise provided, indoor measurements shall be taken inside the structure with the microphone located at any point as follows: (1) No less than three feet above oor level; (2) No less than ve feet from any wall or vertical obstruction; and (3) Not under common possession and control with the building or portion of the building from which the sound is emanating. (Code 1972, ; Ord. No. 1082, 2(part), 2000) Sec Sound ampli cation. No person shall amplify sound using sound amplifying equipment contrary to any of the following: (1) (2) The only ampli ed sound permitted shall be either music or the human voice, or both. The volume of ampli ed sound shall not exceed the noise levels set forth in this subsection when measured outdoors at or beyond the property line of the property from which the sound emanates. Time Period Maximum Noise Level 10:01 p.m. 7:00 a.m. 60 dba 7:01 a.m. 10:00 p.m. 80 dba 63
70 (Code 1972, ; Ord. No. 1082, 2(part), 2000) Sec General prohibition. (a) It unlawful for any person to willfully make, cause or su er, or permit to be made or caused, any loud excessive or o ensive noises or sounds which unreasonably disturb the peace and quiet of any residential neighborhood or which are physically annoying to persons of ordinary sensitivity or which are so harsh, prolonged or unnatural or unusual in their use, time or place as to occasion physical discomfort to the inhabitants of the city, or any section thereof. The standards for dba noise level in section shall apply to this section. To the extent that the noise created causes the noise level at the property line to exceed the ambient noise level by more than 1.0 decibels, it shall be presumed that the noise being created also is in violation of this section. (b) The characteristics and conditions which should be considered in determining whether a violation of the provisions of this section exists should include, but not be limited to, the following: (1) The level of the noise; (2) Whether the nature of the noise is usual or unusual; (3) Whether the origin of the noise is natural or unnatural; (4) The level of the ambient noise; (5) The proximity of the noise to sleeping facilities; (6) The nature and zoning of the area from which the noise emanates and the area where it is received; (7) The time of day or night the noise occurs; (8) The duration of the noise; and (9) Whether the noise is recurrent, intermittent or constant. (Code 1972, ; Ord. No. 1082, 2(part), 2000) Sec Construction noise. It is unlawful for any person between the hours of 7:00 p.m. of any day and 7:00 a.m. of the following day, or on a legal holiday, with the exception of Columbus Day and Washington's birthday, or on Sundays to erect, construct, demolish, excavate, alter or repair any building or structure in such a manner as to create disturbing, excessive or o ensive noise. Construction activity shall not exceed 80 dba in residential zones in the city. (Code 1972, ; Ord. No. 1082, 2(part), 2000) Sec Refuse vehicles and parking lot sweepers. No person shall operate or permit to be operated a refuse compacting, processing or collection vehicle or parking lot sweeper between the hours of 7:00 p.m. to 7:00 a.m. in any residential area unless a permit has been applied for and granted by the city. (Code 1972, ; Ord. No. 1082, 2(part), 2000) Sec Disturbing, excessive, o ensive noises; declaration of certain acts constituting. The following activities, among others, are declared to cause loud, disturbing, excessive or o ensive noises in violation of this section and are unlawful, namely: (1) (2) (3) (4) (5) Horns, signaling devices, etc. Unnecessary use or operation of horns, signaling devices or other similar devices on automobiles, motorcycles or any other vehicle. Radios, television sets, phonographs, loud speaking ampli ers and similar devices. The use or operation of any sound production or reproduction device, radio receiving set, musical instrument, drums, phonograph, television set, loudspeakers, sound ampli er, or other similar machine or device for the producing or reproducing of sound, in such a manner as to disturb the peace, quiet or comfort of any reasonable person of normal sensitivity in any area of the city is prohibited. This provision shall not apply to any participant in a licensed parade or to any person who has been otherwise duly authorized by the city to engage in such conduct. Animals. a. b. The keeping or maintenance, or the permitting to be kept or maintained, upon any premises owned, occupied or controlled by any person of any animal or animals which by any frequent or long-continued noise shall cause annoyance or discomfort to a reasonable person of normal sensitiveness in the vicinity. The noise from any such animal or animals that disturbs two or more residents residing in separate residences adjacent to any part of the property on which the subject animal or animals are kept or maintained, or three or more residents residing in separate residences in close proximity to the property on which the subject animal or animals are kept or maintained, shall be prima facie evidence of a violation of this section. Hospitals, schools, libraries, rest homes, long-term medical or mental care facilities. To make loud, disturbing, excessive noises adjacent to a hospital, school, library, rest home or long-term medical or mental care facility, which noise unreasonably interferes with the workings of such institutions or which disturbs or unduly annoys occupants in said institutions. Playing of radios on buses and trolleys. The operation of any radio, phonograph or tape player on an urban transit bus or trolley so as to emit noise 64
71 that is audible to any other person in the vehicle is prohibited. (6) (7) Playing of radios, phonographs and other sound production or reproduction devices in public parks and public parking lots and streets adjacent thereto. The operation of any radio, phonograph, television set or any other sound production or reproduction device in any public park or any public parking lot, or street adjacent to such park or beach, without the prior written approval of the city manager or the administrator, in such a manner that such radio, phonograph, television set or sound production or reproduction device emits a sound level exceeding those found in the table in section Leaf blowers. a. The term "leaf blower" means any portable, hand-held or backpack, engine-powered device with a nozzle that creates a directable airstream which is capable of and intended for moving leaves and light materials. b. No person shall operate a leaf blower in any residential zoned area between the hours of 7:00 p.m. and 8:00 a.m. on weekdays and 5:00 p.m. and 9:00 a.m. on weekends or on legal holidays. c. No person may operate any leaf blower at a sound level in excess of 80 decibels measured at a distance of 50 feet or greater from the point of noise origin. d. Leaf blowers shall be equipped with functional mu ers and an approved sound limiting device required to ensure that the leaf blower is not capable of generating a sound level exceeding any limit prescribed in this section. (Code 1972, ; Ord. No. 1082, 2(part), 2000) Sec Burglar alarms. (a) Audible burglar alarms for structures or motor vehicles are prohibited unless the operation of such burglar alarm can be terminated within 20 minutes of being activated. (b) Notwithstanding the requirements of this provision, any member of the county sheri 's department, Perris Division, shall have the right to take such steps as may be reasonable and necessary to disconnect any such alarm installed in any building, dwelling or motor vehicle at any time during the period of its activation. On or after 30 days from the e ective date of the ordinance codi ed in this chapter, any building, dwelling or motor vehicle upon which a burglar alarm has been installed shall prominently display the telephone number at which communication may be made with the owner of such building, dwelling or motor vehicle. (Code 1972, ; Ord. No. 1082, 2(part), 2000) Sec Motor vehicles. (a) O -highway. (1) Except as otherwise provided for in this chapter, it shall be unlawful to operate any motor vehicle of any type on any site, other than on a public street or highway as de ned in the California Vehicle Code, in any manner so as to cause noise in excess of those noise levels permitted for onhighway motor vehicles as speci ed in the table for "45-mile-per-hour or less speed limits" contained in section of the California Vehicle Code and as corrected for distances set forth in subsection (a)(2) of this section. (2) The maximum noise level as the on-highway vehicle passes may be measured at a distance of other than 50 feet from the centerline of travel, provided the measurement is further adjusted by adding algebraically the application correction as follows: Distance (feet) Correction (decibels) (preferred distance)
72 (b) Nothing in this section shall apply to authorized emergency vehicles when being used in emergency situations including the blowing of sirens and/or horns. (Code 1972, ; Ord. No. 1082, 2(part), 2000) 66
73 APPENDIX 5.1: STUDY AREA PHOTOS 67
74 This page intentionally left blank 68


75 JN:10962 Perris Circle 3 L1_E 33, 51' ", 117, 13' " L1_N 33, 51' ", 117, 13' " L1_S 33, 51' ", 117, 13' " L1_W 33, 51' ", 117, 13' " L2_N 33, 51' ", 117, 13' " L2_S 33, 51' ", 117, 13' " 69


76 JN:10962 Perris Circle 3 L2_W 33, 51' ", 117, 13' " L3_E 33, 51' ", 117, 13' " L3_N 33, 51' ", 117, 13' " L3_W 33, 51' ", 117, 13' " 70
77 APPENDIX 5.2: NOISE LEVEL MEASUREMENT WORKSHEETS 71
78 This page intentionally left blank 72
79 Project Name: Perris Circle 3 JN: Energy Average Leq 24-Hour Hourly Leq dba Readings (unadjusted) Hourly Leq (dba) Analyst: A. Wolfe Day Night CNEL Date: 8/15/ Time Period Hour Leq Lmax Lmin L1% L2% L5% L8% L25% L50% L90% L95% L99% Min Day Max Energy Average: 62.6 Average: Min Night Max Energy Average: 59.3 Average: Hourly Summary Night Day Night Location: Hour Noise Level Measurement Summary L1- Located on Harley Knox Boulevard north of the Project site near existing residential homes Hour Beginning
80 Project Name: Perris Circle 3 JN: Energy Average Leq 24-Hour Hourly Leq dba Readings (unadjusted) Hourly Leq (dba) Analyst: A. Wolfe Day Night CNEL Date: 8/15/ Time Period Hour Leq Lmax Lmin L1% L2% L5% L8% L25% L50% L90% L95% L99% Min Day Max Energy Average: 53.8 Average: Min Night Max Energy Average: 53.4 Average: Hourly Summary Night Day Night 24-Hour Noise Level Measurement Summary Location: L2- Located on Nance Street and Las Palmas near existing residential homes Hour Beginning

81 Project Name: Perris Circle 3 JN: Energy Average Leq 24-Hour Hourly Leq dba Readings (unadjusted) Hourly Leq (dba) Analyst: A. Wolfe Day Night CNEL Date: 8/15/ Time Period Hour Leq Lmax Lmin L1% L2% L5% L8% L25% L50% L90% L95% L99% Min Day Max Energy Average: 73.3 Average: Min Night Max Energy Average: 69.9 Average: Hourly Summary Night Day Night Location: L3- Located on Nance Street near existing residential homes Hour Noise Level Measurement Summary Hour Beginning
82 This page intentionally left blank 76
83 APPENDIX 7.1: OFF-SITE TRAFFIC NOISE CONTOURS 77
84 This page intentionally left blank 78
85 Scenario: Existing Without Project Road Name: Redlands Av. Road Segment: s/o Harley Knox Bl. SITE SPECIFIC INPUT DATA Highway Data Average Daily Traffic (Adt): Peak Hour Percentage: Peak Hour Volume: FHWA-RD HIGHWAY NOISE PREDICTION MODEL 4,572 vehicles 10% 457 vehicles 40 mph 56 feet Project Name: Brodiaea Job Number: NOISE MODEL INPUTS Site Conditions (Hard = 10, Soft = 15) Autos: 15 Medium Trucks (2 Axles): 15 Heavy Trucks (3+ Axles): 15 Vehicle Speed: Vehicle Mix Near/Far Lane Distance: VehicleType Day Evening Night Daily Site Data Autos: 77.5% 12.9% 9.6% 88.83% Barrier Height: 0.0 feet Medium Trucks: 84.8% 4.9% 10.3% 3.05% Barrier Type (0-Wall, 1-Berm): 0.0 Heavy Trucks: 86.5% 2.7% 10.8% 8.12% Centerline Dist. to Barrier: 47.0 feet Noise Source Elevations (in feet) Centerline Dist. to Observer: 47.0 feet Autos: Barrier Distance to Observer: 0.0 feet Medium Trucks: Observer Height (Above Pad): 5.0 feet Heavy Trucks: Grade Adjustment: 0.0 Pad Elevation: 0.0 feet Road Elevation: 0.0 feet Lane Equivalent Distance (in feet) Road Grade: 0.0% Autos: Left View: degrees Medium Trucks: Right View: 90.0 degrees Heavy Trucks: FHWA Noise Model Calculations VehicleType REMEL Traffic Flow Distance Finite Road Fresnel Barrier Atten Berm Atten Autos: Medium Trucks: Heavy Trucks: Unmitigated Noise Levels (without Topo and barrier attenuation) VehicleType Leq Peak Hour Leq Day Leq Evening Leq Night Ldn CNEL Autos: Medium Trucks: Heavy Trucks: Vehicle Noise: Centerline Distance to Noise Contour (in feet) Ldn: CNEL: 70 dba 65 dba 60 dba 55 dba Scenario: Existing Without Project Road Name: Redlands Av. Road Segment: s/o Nance St. SITE SPECIFIC INPUT DATA Highway Data Average Daily Traffic (Adt): Peak Hour Percentage: Peak Hour Volume: FHWA-RD HIGHWAY NOISE PREDICTION MODEL 4,530 vehicles 10% 453 vehicles 40 mph 56 feet Project Name: Brodiaea Job Number: NOISE MODEL INPUTS Site Conditions (Hard = 10, Soft = 15) Autos: 15 Medium Trucks (2 Axles): 15 Heavy Trucks (3+ Axles): 15 Vehicle Speed: Vehicle Mix Near/Far Lane Distance: VehicleType Day Evening Night Daily Site Data Autos: 77.5% 12.9% 9.6% 88.83% Barrier Height: 0.0 feet Medium Trucks: 84.8% 4.9% 10.3% 3.05% Barrier Type (0-Wall, 1-Berm): 0.0 Heavy Trucks: 86.5% 2.7% 10.8% 8.12% Centerline Dist. to Barrier: 47.0 feet Noise Source Elevations (in feet) Centerline Dist. to Observer: 47.0 feet Autos: Barrier Distance to Observer: 0.0 feet Medium Trucks: Observer Height (Above Pad): 5.0 feet Heavy Trucks: Grade Adjustment: 0.0 Pad Elevation: 0.0 feet Road Elevation: 0.0 feet Lane Equivalent Distance (in feet) Road Grade: 0.0% Autos: Left View: degrees Medium Trucks: Right View: 90.0 degrees Heavy Trucks: FHWA Noise Model Calculations VehicleType REMEL Traffic Flow Distance Finite Road Fresnel Barrier Atten Berm Atten Autos: Medium Trucks: Heavy Trucks: Unmitigated Noise Levels (without Topo and barrier attenuation) VehicleType Leq Peak Hour Leq Day Leq Evening Leq Night Ldn CNEL Autos: Medium Trucks: Heavy Trucks: Vehicle Noise: Centerline Distance to Noise Contour (in feet) Ldn: CNEL: 70 dba 65 dba 60 dba 55 dba Tuesday, January 16, 2018 Tuesday, January 16, 2018 Scenario: Existing Without Project Road Name: Harley Knox Bl. Road Segment: w/o Driveway 1 SITE SPECIFIC INPUT DATA Highway Data Average Daily Traffic (Adt): Peak Hour Percentage: Peak Hour Volume: FHWA-RD HIGHWAY NOISE PREDICTION MODEL 4,428 vehicles 10% 443 vehicles 45 mph 54 feet Project Name: Brodiaea Job Number: NOISE MODEL INPUTS Site Conditions (Hard = 10, Soft = 15) Autos: 15 Medium Trucks (2 Axles): 15 Heavy Trucks (3+ Axles): 15 Vehicle Speed: Vehicle Mix Near/Far Lane Distance: VehicleType Day Evening Night Daily Site Data Autos: 77.5% 12.9% 9.6% 88.83% Barrier Height: 0.0 feet Medium Trucks: 84.8% 4.9% 10.3% 3.05% Barrier Type (0-Wall, 1-Berm): 0.0 Heavy Trucks: 86.5% 2.7% 10.8% 8.12% Centerline Dist. to Barrier: 47.0 feet Noise Source Elevations (in feet) Centerline Dist. to Observer: 47.0 feet Autos: Barrier Distance to Observer: 0.0 feet Medium Trucks: Observer Height (Above Pad): 5.0 feet Heavy Trucks: Grade Adjustment: 0.0 Pad Elevation: 0.0 feet Road Elevation: 0.0 feet Lane Equivalent Distance (in feet) Road Grade: 0.0% Autos: Left View: degrees Medium Trucks: Right View: 90.0 degrees Heavy Trucks: FHWA Noise Model Calculations VehicleType REMEL Traffic Flow Distance Finite Road Fresnel Barrier Atten Berm Atten Autos: Medium Trucks: Heavy Trucks: Unmitigated Noise Levels (without Topo and barrier attenuation) VehicleType Leq Peak Hour Leq Day Leq Evening Leq Night Ldn CNEL Autos: Medium Trucks: Heavy Trucks: Vehicle Noise: Centerline Distance to Noise Contour (in feet) Ldn: CNEL: 70 dba 65 dba 60 dba 55 dba Scenario: Existing Without Project Road Name: Harley Knox Bl. Road Segment: w/o Redlands Av. SITE SPECIFIC INPUT DATA Highway Data Average Daily Traffic (Adt): Peak Hour Percentage: Peak Hour Volume: FHWA-RD HIGHWAY NOISE PREDICTION MODEL 4,428 vehicles 10% 443 vehicles 45 mph 54 feet Project Name: Brodiaea Job Number: NOISE MODEL INPUTS Site Conditions (Hard = 10, Soft = 15) Autos: 15 Medium Trucks (2 Axles): 15 Heavy Trucks (3+ Axles): 15 Vehicle Speed: Vehicle Mix Near/Far Lane Distance: VehicleType Day Evening Night Daily Site Data Autos: 77.5% 12.9% 9.6% 88.83% Barrier Height: 0.0 feet Medium Trucks: 84.8% 4.9% 10.3% 3.05% Barrier Type (0-Wall, 1-Berm): 0.0 Heavy Trucks: 86.5% 2.7% 10.8% 8.12% Centerline Dist. to Barrier: 47.0 feet Noise Source Elevations (in feet) Centerline Dist. to Observer: 47.0 feet Autos: Barrier Distance to Observer: 0.0 feet Medium Trucks: Observer Height (Above Pad): 5.0 feet Heavy Trucks: Grade Adjustment: 0.0 Pad Elevation: 0.0 feet Road Elevation: 0.0 feet Lane Equivalent Distance (in feet) Road Grade: 0.0% Autos: Left View: degrees Medium Trucks: Right View: 90.0 degrees Heavy Trucks: FHWA Noise Model Calculations VehicleType REMEL Traffic Flow Distance Finite Road Fresnel Barrier Atten Berm Atten Autos: Medium Trucks: Heavy Trucks: Unmitigated Noise Levels (without Topo and barrier attenuation) VehicleType Leq Peak Hour Leq Day Leq Evening Leq Night Ldn CNEL Autos: Medium Trucks: Heavy Trucks: Vehicle Noise: Centerline Distance to Noise Contour (in feet) Ldn: CNEL: 70 dba 65 dba 60 dba 55 dba Tuesday, January 16, 2018 Tuesday, January 16,
86 Scenario: Existing Without Project Road Name: Nance St. Road Segment: e/o Driveway 2 SITE SPECIFIC INPUT DATA Highway Data Average Daily Traffic (Adt): Peak Hour Percentage: Peak Hour Volume: FHWA-RD HIGHWAY NOISE PREDICTION MODEL 427 vehicles 10% 43 vehicles 40 mph 12 feet Project Name: Brodiaea Job Number: NOISE MODEL INPUTS Site Conditions (Hard = 10, Soft = 15) Autos: 15 Medium Trucks (2 Axles): 15 Heavy Trucks (3+ Axles): 15 Vehicle Speed: Vehicle Mix Near/Far Lane Distance: VehicleType Day Evening Night Daily Site Data Autos: 77.5% 12.9% 9.6% 88.83% Barrier Height: 0.0 feet Medium Trucks: 84.8% 4.9% 10.3% 3.05% Barrier Type (0-Wall, 1-Berm): 0.0 Heavy Trucks: 86.5% 2.7% 10.8% 8.12% Centerline Dist. to Barrier: 30.0 feet Noise Source Elevations (in feet) Centerline Dist. to Observer: 30.0 feet Autos: Barrier Distance to Observer: 0.0 feet Medium Trucks: Observer Height (Above Pad): 5.0 feet Heavy Trucks: Grade Adjustment: 0.0 Pad Elevation: 0.0 feet Road Elevation: 0.0 feet Lane Equivalent Distance (in feet) Road Grade: 0.0% Autos: Left View: degrees Medium Trucks: Right View: 90.0 degrees Heavy Trucks: FHWA Noise Model Calculations VehicleType REMEL Traffic Flow Distance Finite Road Fresnel Barrier Atten Berm Atten Autos: Medium Trucks: Heavy Trucks: Unmitigated Noise Levels (without Topo and barrier attenuation) VehicleType Leq Peak Hour Leq Day Leq Evening Leq Night Ldn CNEL Autos: Medium Trucks: Heavy Trucks: Vehicle Noise: Centerline Distance to Noise Contour (in feet) Ldn: CNEL: 70 dba 65 dba 60 dba 55 dba Scenario: Existing Without Project Road Name: Nance St. Road Segment: w/o Redlands Av. SITE SPECIFIC INPUT DATA Highway Data Average Daily Traffic (Adt): Peak Hour Percentage: Peak Hour Volume: FHWA-RD HIGHWAY NOISE PREDICTION MODEL 427 vehicles 10% 43 vehicles 40 mph 12 feet Project Name: Brodiaea Job Number: NOISE MODEL INPUTS Site Conditions (Hard = 10, Soft = 15) Autos: 15 Medium Trucks (2 Axles): 15 Heavy Trucks (3+ Axles): 15 Vehicle Speed: Vehicle Mix Near/Far Lane Distance: VehicleType Day Evening Night Daily Site Data Autos: 77.5% 12.9% 9.6% 88.83% Barrier Height: 0.0 feet Medium Trucks: 84.8% 4.9% 10.3% 3.05% Barrier Type (0-Wall, 1-Berm): 0.0 Heavy Trucks: 86.5% 2.7% 10.8% 8.12% Centerline Dist. to Barrier: 30.0 feet Noise Source Elevations (in feet) Centerline Dist. to Observer: 30.0 feet Autos: Barrier Distance to Observer: 0.0 feet Medium Trucks: Observer Height (Above Pad): 5.0 feet Heavy Trucks: Grade Adjustment: 0.0 Pad Elevation: 0.0 feet Road Elevation: 0.0 feet Lane Equivalent Distance (in feet) Road Grade: 0.0% Autos: Left View: degrees Medium Trucks: Right View: 90.0 degrees Heavy Trucks: FHWA Noise Model Calculations VehicleType REMEL Traffic Flow Distance Finite Road Fresnel Barrier Atten Berm Atten Autos: Medium Trucks: Heavy Trucks: Unmitigated Noise Levels (without Topo and barrier attenuation) VehicleType Leq Peak Hour Leq Day Leq Evening Leq Night Ldn CNEL Autos: Medium Trucks: Heavy Trucks: Vehicle Noise: Centerline Distance to Noise Contour (in feet) Ldn: CNEL: 70 dba 65 dba 60 dba 55 dba Tuesday, January 16, 2018 Tuesday, January 16, 2018 Scenario: Existing + Project Road Name: Redlands Av. Road Segment: s/o Harley Knox Bl. SITE SPECIFIC INPUT DATA Highway Data Average Daily Traffic (Adt): Peak Hour Percentage: Peak Hour Volume: FHWA-RD HIGHWAY NOISE PREDICTION MODEL 4,827 vehicles 10% 483 vehicles 40 mph 56 feet Project Name: Brodiaea Job Number: NOISE MODEL INPUTS Site Conditions (Hard = 10, Soft = 15) Autos: 15 Medium Trucks (2 Axles): 15 Heavy Trucks (3+ Axles): 15 Vehicle Speed: Vehicle Mix Near/Far Lane Distance: VehicleType Day Evening Night Daily Site Data Autos: 77.5% 12.9% 9.6% 86.98% Barrier Height: 0.0 feet Medium Trucks: 84.8% 4.9% 10.3% 3.30% Barrier Type (0-Wall, 1-Berm): 0.0 Heavy Trucks: 86.5% 2.7% 10.8% 9.72% Centerline Dist. to Barrier: 47.0 feet Noise Source Elevations (in feet) Centerline Dist. to Observer: 47.0 feet Autos: Barrier Distance to Observer: 0.0 feet Medium Trucks: Observer Height (Above Pad): 5.0 feet Heavy Trucks: Grade Adjustment: 0.0 Pad Elevation: 0.0 feet Road Elevation: 0.0 feet Lane Equivalent Distance (in feet) Road Grade: 0.0% Autos: Left View: degrees Medium Trucks: Right View: 90.0 degrees Heavy Trucks: FHWA Noise Model Calculations VehicleType REMEL Traffic Flow Distance Finite Road Fresnel Barrier Atten Berm Atten Autos: Medium Trucks: Heavy Trucks: Unmitigated Noise Levels (without Topo and barrier attenuation) VehicleType Leq Peak Hour Leq Day Leq Evening Leq Night Ldn CNEL Autos: Medium Trucks: Heavy Trucks: Vehicle Noise: Centerline Distance to Noise Contour (in feet) Ldn: CNEL: 70 dba 65 dba 60 dba 55 dba Scenario: Existing + Project Road Name: Redlands Av. Road Segment: s/o Nance St. SITE SPECIFIC INPUT DATA Highway Data Average Daily Traffic (Adt): Peak Hour Percentage: Peak Hour Volume: FHWA-RD HIGHWAY NOISE PREDICTION MODEL 4,592 vehicles 10% 459 vehicles 40 mph 56 feet Project Name: Brodiaea Job Number: NOISE MODEL INPUTS Site Conditions (Hard = 10, Soft = 15) Autos: 15 Medium Trucks (2 Axles): 15 Heavy Trucks (3+ Axles): 15 Vehicle Speed: Vehicle Mix Near/Far Lane Distance: VehicleType Day Evening Night Daily Site Data Autos: 77.5% 12.9% 9.6% 88.98% Barrier Height: 0.0 feet Medium Trucks: 84.8% 4.9% 10.3% 3.00% Barrier Type (0-Wall, 1-Berm): 0.0 Heavy Trucks: 86.5% 2.7% 10.8% 8.01% Centerline Dist. to Barrier: 47.0 feet Noise Source Elevations (in feet) Centerline Dist. to Observer: 47.0 feet Autos: Barrier Distance to Observer: 0.0 feet Medium Trucks: Observer Height (Above Pad): 5.0 feet Heavy Trucks: Grade Adjustment: 0.0 Pad Elevation: 0.0 feet Road Elevation: 0.0 feet Lane Equivalent Distance (in feet) Road Grade: 0.0% Autos: Left View: degrees Medium Trucks: Right View: 90.0 degrees Heavy Trucks: FHWA Noise Model Calculations VehicleType REMEL Traffic Flow Distance Finite Road Fresnel Barrier Atten Berm Atten Autos: Medium Trucks: Heavy Trucks: Unmitigated Noise Levels (without Topo and barrier attenuation) VehicleType Leq Peak Hour Leq Day Leq Evening Leq Night Ldn CNEL Autos: Medium Trucks: Heavy Trucks: Vehicle Noise: Centerline Distance to Noise Contour (in feet) Ldn: CNEL: 70 dba 65 dba 60 dba 55 dba Tuesday, January 16, 2018 Tuesday, January 16,
87 Scenario: Existing + Project Road Name: Harley Knox Bl. Road Segment: w/o Driveway 1 SITE SPECIFIC INPUT DATA Highway Data Average Daily Traffic (Adt): Peak Hour Percentage: Peak Hour Volume: FHWA-RD HIGHWAY NOISE PREDICTION MODEL 4,733 vehicles 10% 473 vehicles 45 mph 54 feet Project Name: Brodiaea Job Number: NOISE MODEL INPUTS Site Conditions (Hard = 10, Soft = 15) Autos: 15 Medium Trucks (2 Axles): 15 Heavy Trucks (3+ Axles): 15 Vehicle Speed: Vehicle Mix Near/Far Lane Distance: VehicleType Day Evening Night Daily Site Data Autos: 77.5% 12.9% 9.6% 87.06% Barrier Height: 0.0 feet Medium Trucks: 84.8% 4.9% 10.3% 3.27% Barrier Type (0-Wall, 1-Berm): 0.0 Heavy Trucks: 86.5% 2.7% 10.8% 9.67% Centerline Dist. to Barrier: 47.0 feet Noise Source Elevations (in feet) Centerline Dist. to Observer: 47.0 feet Autos: Barrier Distance to Observer: 0.0 feet Medium Trucks: Observer Height (Above Pad): 5.0 feet Heavy Trucks: Grade Adjustment: 0.0 Pad Elevation: 0.0 feet Road Elevation: 0.0 feet Lane Equivalent Distance (in feet) Road Grade: 0.0% Autos: Left View: degrees Medium Trucks: Right View: 90.0 degrees Heavy Trucks: FHWA Noise Model Calculations VehicleType REMEL Traffic Flow Distance Finite Road Fresnel Barrier Atten Berm Atten Autos: Medium Trucks: Heavy Trucks: Unmitigated Noise Levels (without Topo and barrier attenuation) VehicleType Leq Peak Hour Leq Day Leq Evening Leq Night Ldn CNEL Autos: Medium Trucks: Heavy Trucks: Vehicle Noise: Centerline Distance to Noise Contour (in feet) Ldn: CNEL: 70 dba 65 dba 60 dba 55 dba Scenario: Existing + Project Road Name: Harley Knox Bl. Road Segment: w/o Redlands Av. SITE SPECIFIC INPUT DATA Highway Data Average Daily Traffic (Adt): Peak Hour Percentage: Peak Hour Volume: FHWA-RD HIGHWAY NOISE PREDICTION MODEL 4,733 vehicles 10% 473 vehicles 45 mph 54 feet Project Name: Brodiaea Job Number: NOISE MODEL INPUTS Site Conditions (Hard = 10, Soft = 15) Autos: 15 Medium Trucks (2 Axles): 15 Heavy Trucks (3+ Axles): 15 Vehicle Speed: Vehicle Mix Near/Far Lane Distance: VehicleType Day Evening Night Daily Site Data Autos: 77.5% 12.9% 9.6% 87.06% Barrier Height: 0.0 feet Medium Trucks: 84.8% 4.9% 10.3% 3.27% Barrier Type (0-Wall, 1-Berm): 0.0 Heavy Trucks: 86.5% 2.7% 10.8% 9.67% Centerline Dist. to Barrier: 47.0 feet Noise Source Elevations (in feet) Centerline Dist. to Observer: 47.0 feet Autos: Barrier Distance to Observer: 0.0 feet Medium Trucks: Observer Height (Above Pad): 5.0 feet Heavy Trucks: Grade Adjustment: 0.0 Pad Elevation: 0.0 feet Road Elevation: 0.0 feet Lane Equivalent Distance (in feet) Road Grade: 0.0% Autos: Left View: degrees Medium Trucks: Right View: 90.0 degrees Heavy Trucks: FHWA Noise Model Calculations VehicleType REMEL Traffic Flow Distance Finite Road Fresnel Barrier Atten Berm Atten Autos: Medium Trucks: Heavy Trucks: Unmitigated Noise Levels (without Topo and barrier attenuation) VehicleType Leq Peak Hour Leq Day Leq Evening Leq Night Ldn CNEL Autos: Medium Trucks: Heavy Trucks: Vehicle Noise: Centerline Distance to Noise Contour (in feet) Ldn: CNEL: 70 dba 65 dba 60 dba 55 dba Tuesday, January 16, 2018 Tuesday, January 16, 2018 Scenario: Existing + Project Road Name: Nance St. Road Segment: e/o Driveway 2 SITE SPECIFIC INPUT DATA Highway Data Average Daily Traffic (Adt): Peak Hour Percentage: Peak Hour Volume: FHWA-RD HIGHWAY NOISE PREDICTION MODEL 511 vehicles 10% 51 vehicles 40 mph 12 feet Project Name: Brodiaea Job Number: NOISE MODEL INPUTS Site Conditions (Hard = 10, Soft = 15) Autos: 15 Medium Trucks (2 Axles): 15 Heavy Trucks (3+ Axles): 15 Vehicle Speed: Vehicle Mix Near/Far Lane Distance: VehicleType Day Evening Night Daily Site Data Autos: 77.5% 12.9% 9.6% 79.12% Barrier Height: 0.0 feet Medium Trucks: 84.8% 4.9% 10.3% 4.50% Barrier Type (0-Wall, 1-Berm): 0.0 Heavy Trucks: 86.5% 2.7% 10.8% 16.38% Centerline Dist. to Barrier: 30.0 feet Noise Source Elevations (in feet) Centerline Dist. to Observer: 30.0 feet Autos: Barrier Distance to Observer: 0.0 feet Medium Trucks: Observer Height (Above Pad): 5.0 feet Heavy Trucks: Grade Adjustment: 0.0 Pad Elevation: 0.0 feet Road Elevation: 0.0 feet Lane Equivalent Distance (in feet) Road Grade: 0.0% Autos: Left View: degrees Medium Trucks: Right View: 90.0 degrees Heavy Trucks: FHWA Noise Model Calculations VehicleType REMEL Traffic Flow Distance Finite Road Fresnel Barrier Atten Berm Atten Autos: Medium Trucks: Heavy Trucks: Unmitigated Noise Levels (without Topo and barrier attenuation) VehicleType Leq Peak Hour Leq Day Leq Evening Leq Night Ldn CNEL Autos: Medium Trucks: Heavy Trucks: Vehicle Noise: Centerline Distance to Noise Contour (in feet) Ldn: CNEL: 70 dba 65 dba 60 dba 55 dba Scenario: Existing + Project Road Name: Nance St. Road Segment: w/o Redlands Av. SITE SPECIFIC INPUT DATA Highway Data Average Daily Traffic (Adt): Peak Hour Percentage: Peak Hour Volume: FHWA-RD HIGHWAY NOISE PREDICTION MODEL 511 vehicles 10% 51 vehicles 40 mph 12 feet Project Name: Brodiaea Job Number: NOISE MODEL INPUTS Site Conditions (Hard = 10, Soft = 15) Autos: 15 Medium Trucks (2 Axles): 15 Heavy Trucks (3+ Axles): 15 Vehicle Speed: Vehicle Mix Near/Far Lane Distance: VehicleType Day Evening Night Daily Site Data Autos: 77.5% 12.9% 9.6% 79.12% Barrier Height: 0.0 feet Medium Trucks: 84.8% 4.9% 10.3% 4.50% Barrier Type (0-Wall, 1-Berm): 0.0 Heavy Trucks: 86.5% 2.7% 10.8% 16.38% Centerline Dist. to Barrier: 30.0 feet Noise Source Elevations (in feet) Centerline Dist. to Observer: 30.0 feet Autos: Barrier Distance to Observer: 0.0 feet Medium Trucks: Observer Height (Above Pad): 5.0 feet Heavy Trucks: Grade Adjustment: 0.0 Pad Elevation: 0.0 feet Road Elevation: 0.0 feet Lane Equivalent Distance (in feet) Road Grade: 0.0% Autos: Left View: degrees Medium Trucks: Right View: 90.0 degrees Heavy Trucks: FHWA Noise Model Calculations VehicleType REMEL Traffic Flow Distance Finite Road Fresnel Barrier Atten Berm Atten Autos: Medium Trucks: Heavy Trucks: Unmitigated Noise Levels (without Topo and barrier attenuation) VehicleType Leq Peak Hour Leq Day Leq Evening Leq Night Ldn CNEL Autos: Medium Trucks: Heavy Trucks: Vehicle Noise: Centerline Distance to Noise Contour (in feet) Ldn: CNEL: 70 dba 65 dba 60 dba 55 dba Tuesday, January 16, 2018 Tuesday, January 16,
88 Scenario: OY 2022 Without Project Road Name: Redlands Av. Road Segment: s/o Harley Knox Bl. SITE SPECIFIC INPUT DATA Highway Data Average Daily Traffic (Adt): Peak Hour Percentage: Peak Hour Volume: FHWA-RD HIGHWAY NOISE PREDICTION MODEL 4,757 vehicles 10% 476 vehicles 40 mph 56 feet Project Name: Brodiaea Job Number: NOISE MODEL INPUTS Site Conditions (Hard = 10, Soft = 15) Autos: 15 Medium Trucks (2 Axles): 15 Heavy Trucks (3+ Axles): 15 Vehicle Speed: Vehicle Mix Near/Far Lane Distance: VehicleType Day Evening Night Daily Site Data Autos: 77.5% 12.9% 9.6% 88.83% Barrier Height: 0.0 feet Medium Trucks: 84.8% 4.9% 10.3% 3.05% Barrier Type (0-Wall, 1-Berm): 0.0 Heavy Trucks: 86.5% 2.7% 10.8% 8.12% Centerline Dist. to Barrier: 47.0 feet Noise Source Elevations (in feet) Centerline Dist. to Observer: 47.0 feet Autos: Barrier Distance to Observer: 0.0 feet Medium Trucks: Observer Height (Above Pad): 5.0 feet Heavy Trucks: Grade Adjustment: 0.0 Pad Elevation: 0.0 feet Road Elevation: 0.0 feet Lane Equivalent Distance (in feet) Road Grade: 0.0% Autos: Left View: degrees Medium Trucks: Right View: 90.0 degrees Heavy Trucks: FHWA Noise Model Calculations VehicleType REMEL Traffic Flow Distance Finite Road Fresnel Barrier Atten Berm Atten Autos: Medium Trucks: Heavy Trucks: Unmitigated Noise Levels (without Topo and barrier attenuation) VehicleType Leq Peak Hour Leq Day Leq Evening Leq Night Ldn CNEL Autos: Medium Trucks: Heavy Trucks: Vehicle Noise: Centerline Distance to Noise Contour (in feet) Ldn: CNEL: 70 dba 65 dba 60 dba 55 dba Scenario: OY 2022 Without Project Road Name: Redlands Av. Road Segment: s/o Nance St. SITE SPECIFIC INPUT DATA Highway Data Average Daily Traffic (Adt): Peak Hour Percentage: Peak Hour Volume: FHWA-RD HIGHWAY NOISE PREDICTION MODEL 4,713 vehicles 10% 471 vehicles 40 mph 56 feet Project Name: Brodiaea Job Number: NOISE MODEL INPUTS Site Conditions (Hard = 10, Soft = 15) Autos: 15 Medium Trucks (2 Axles): 15 Heavy Trucks (3+ Axles): 15 Vehicle Speed: Vehicle Mix Near/Far Lane Distance: VehicleType Day Evening Night Daily Site Data Autos: 77.5% 12.9% 9.6% 88.83% Barrier Height: 0.0 feet Medium Trucks: 84.8% 4.9% 10.3% 3.05% Barrier Type (0-Wall, 1-Berm): 0.0 Heavy Trucks: 86.5% 2.7% 10.8% 8.12% Centerline Dist. to Barrier: 47.0 feet Noise Source Elevations (in feet) Centerline Dist. to Observer: 47.0 feet Autos: Barrier Distance to Observer: 0.0 feet Medium Trucks: Observer Height (Above Pad): 5.0 feet Heavy Trucks: Grade Adjustment: 0.0 Pad Elevation: 0.0 feet Road Elevation: 0.0 feet Lane Equivalent Distance (in feet) Road Grade: 0.0% Autos: Left View: degrees Medium Trucks: Right View: 90.0 degrees Heavy Trucks: FHWA Noise Model Calculations VehicleType REMEL Traffic Flow Distance Finite Road Fresnel Barrier Atten Berm Atten Autos: Medium Trucks: Heavy Trucks: Unmitigated Noise Levels (without Topo and barrier attenuation) VehicleType Leq Peak Hour Leq Day Leq Evening Leq Night Ldn CNEL Autos: Medium Trucks: Heavy Trucks: Vehicle Noise: Centerline Distance to Noise Contour (in feet) Ldn: CNEL: 70 dba 65 dba 60 dba 55 dba Tuesday, January 16, 2018 Tuesday, January 16, 2018 Scenario: OY 2022 Without Project Road Name: Harley Knox Bl. Road Segment: w/o Driveway 1 SITE SPECIFIC INPUT DATA Highway Data Average Daily Traffic (Adt): Peak Hour Percentage: Peak Hour Volume: FHWA-RD HIGHWAY NOISE PREDICTION MODEL 4,607 vehicles 10% 461 vehicles 45 mph 54 feet Project Name: Brodiaea Job Number: NOISE MODEL INPUTS Site Conditions (Hard = 10, Soft = 15) Autos: 15 Medium Trucks (2 Axles): 15 Heavy Trucks (3+ Axles): 15 Vehicle Speed: Vehicle Mix Near/Far Lane Distance: VehicleType Day Evening Night Daily Site Data Autos: 77.5% 12.9% 9.6% 88.83% Barrier Height: 0.0 feet Medium Trucks: 84.8% 4.9% 10.3% 3.05% Barrier Type (0-Wall, 1-Berm): 0.0 Heavy Trucks: 86.5% 2.7% 10.8% 8.12% Centerline Dist. to Barrier: 47.0 feet Noise Source Elevations (in feet) Centerline Dist. to Observer: 47.0 feet Autos: Barrier Distance to Observer: 0.0 feet Medium Trucks: Observer Height (Above Pad): 5.0 feet Heavy Trucks: Grade Adjustment: 0.0 Pad Elevation: 0.0 feet Road Elevation: 0.0 feet Lane Equivalent Distance (in feet) Road Grade: 0.0% Autos: Left View: degrees Medium Trucks: Right View: 90.0 degrees Heavy Trucks: FHWA Noise Model Calculations VehicleType REMEL Traffic Flow Distance Finite Road Fresnel Barrier Atten Berm Atten Autos: Medium Trucks: Heavy Trucks: Unmitigated Noise Levels (without Topo and barrier attenuation) VehicleType Leq Peak Hour Leq Day Leq Evening Leq Night Ldn CNEL Autos: Medium Trucks: Heavy Trucks: Vehicle Noise: Centerline Distance to Noise Contour (in feet) Ldn: CNEL: 70 dba 65 dba 60 dba 55 dba Scenario: OY 2022 Without Project Road Name: Harley Knox Bl. Road Segment: w/o Redlands Av. SITE SPECIFIC INPUT DATA Highway Data Average Daily Traffic (Adt): Peak Hour Percentage: Peak Hour Volume: FHWA-RD HIGHWAY NOISE PREDICTION MODEL 4,607 vehicles 10% 461 vehicles 45 mph 54 feet Project Name: Brodiaea Job Number: NOISE MODEL INPUTS Site Conditions (Hard = 10, Soft = 15) Autos: 15 Medium Trucks (2 Axles): 15 Heavy Trucks (3+ Axles): 15 Vehicle Speed: Vehicle Mix Near/Far Lane Distance: VehicleType Day Evening Night Daily Site Data Autos: 77.5% 12.9% 9.6% 88.83% Barrier Height: 0.0 feet Medium Trucks: 84.8% 4.9% 10.3% 3.05% Barrier Type (0-Wall, 1-Berm): 0.0 Heavy Trucks: 86.5% 2.7% 10.8% 8.12% Centerline Dist. to Barrier: 47.0 feet Noise Source Elevations (in feet) Centerline Dist. to Observer: 47.0 feet Autos: Barrier Distance to Observer: 0.0 feet Medium Trucks: Observer Height (Above Pad): 5.0 feet Heavy Trucks: Grade Adjustment: 0.0 Pad Elevation: 0.0 feet Road Elevation: 0.0 feet Lane Equivalent Distance (in feet) Road Grade: 0.0% Autos: Left View: degrees Medium Trucks: Right View: 90.0 degrees Heavy Trucks: FHWA Noise Model Calculations VehicleType REMEL Traffic Flow Distance Finite Road Fresnel Barrier Atten Berm Atten Autos: Medium Trucks: Heavy Trucks: Unmitigated Noise Levels (without Topo and barrier attenuation) VehicleType Leq Peak Hour Leq Day Leq Evening Leq Night Ldn CNEL Autos: Medium Trucks: Heavy Trucks: Vehicle Noise: Centerline Distance to Noise Contour (in feet) Ldn: CNEL: 70 dba 65 dba 60 dba 55 dba Tuesday, January 16, 2018 Tuesday, January 16,
89 Scenario: OY 2022 Without Project Road Name: Nance St. Road Segment: e/o Driveway 2 SITE SPECIFIC INPUT DATA Highway Data Average Daily Traffic (Adt): Peak Hour Percentage: Peak Hour Volume: FHWA-RD HIGHWAY NOISE PREDICTION MODEL 444 vehicles 10% 44 vehicles 40 mph 12 feet Project Name: Brodiaea Job Number: NOISE MODEL INPUTS Site Conditions (Hard = 10, Soft = 15) Autos: 15 Medium Trucks (2 Axles): 15 Heavy Trucks (3+ Axles): 15 Vehicle Speed: Vehicle Mix Near/Far Lane Distance: VehicleType Day Evening Night Daily Site Data Autos: 77.5% 12.9% 9.6% 88.83% Barrier Height: 0.0 feet Medium Trucks: 84.8% 4.9% 10.3% 3.05% Barrier Type (0-Wall, 1-Berm): 0.0 Heavy Trucks: 86.5% 2.7% 10.8% 8.12% Centerline Dist. to Barrier: 30.0 feet Noise Source Elevations (in feet) Centerline Dist. to Observer: 30.0 feet Autos: Barrier Distance to Observer: 0.0 feet Medium Trucks: Observer Height (Above Pad): 5.0 feet Heavy Trucks: Grade Adjustment: 0.0 Pad Elevation: 0.0 feet Road Elevation: 0.0 feet Lane Equivalent Distance (in feet) Road Grade: 0.0% Autos: Left View: degrees Medium Trucks: Right View: 90.0 degrees Heavy Trucks: FHWA Noise Model Calculations VehicleType REMEL Traffic Flow Distance Finite Road Fresnel Barrier Atten Berm Atten Autos: Medium Trucks: Heavy Trucks: Unmitigated Noise Levels (without Topo and barrier attenuation) VehicleType Leq Peak Hour Leq Day Leq Evening Leq Night Ldn CNEL Autos: Medium Trucks: Heavy Trucks: Vehicle Noise: Centerline Distance to Noise Contour (in feet) Ldn: CNEL: 70 dba 65 dba 60 dba 55 dba Scenario: OY 2022 Without Project Road Name: Nance St. Road Segment: w/o Redlands Av. SITE SPECIFIC INPUT DATA Highway Data Average Daily Traffic (Adt): Peak Hour Percentage: Peak Hour Volume: FHWA-RD HIGHWAY NOISE PREDICTION MODEL 444 vehicles 10% 44 vehicles 40 mph 12 feet Project Name: Brodiaea Job Number: NOISE MODEL INPUTS Site Conditions (Hard = 10, Soft = 15) Autos: 15 Medium Trucks (2 Axles): 15 Heavy Trucks (3+ Axles): 15 Vehicle Speed: Vehicle Mix Near/Far Lane Distance: VehicleType Day Evening Night Daily Site Data Autos: 77.5% 12.9% 9.6% 88.83% Barrier Height: 0.0 feet Medium Trucks: 84.8% 4.9% 10.3% 3.05% Barrier Type (0-Wall, 1-Berm): 0.0 Heavy Trucks: 86.5% 2.7% 10.8% 8.12% Centerline Dist. to Barrier: 30.0 feet Noise Source Elevations (in feet) Centerline Dist. to Observer: 30.0 feet Autos: Barrier Distance to Observer: 0.0 feet Medium Trucks: Observer Height (Above Pad): 5.0 feet Heavy Trucks: Grade Adjustment: 0.0 Pad Elevation: 0.0 feet Road Elevation: 0.0 feet Lane Equivalent Distance (in feet) Road Grade: 0.0% Autos: Left View: degrees Medium Trucks: Right View: 90.0 degrees Heavy Trucks: FHWA Noise Model Calculations VehicleType REMEL Traffic Flow Distance Finite Road Fresnel Barrier Atten Berm Atten Autos: Medium Trucks: Heavy Trucks: Unmitigated Noise Levels (without Topo and barrier attenuation) VehicleType Leq Peak Hour Leq Day Leq Evening Leq Night Ldn CNEL Autos: Medium Trucks: Heavy Trucks: Vehicle Noise: Centerline Distance to Noise Contour (in feet) Ldn: CNEL: 70 dba 65 dba 60 dba 55 dba Tuesday, January 16, 2018 Tuesday, January 16, 2018 Scenario: OY 2022 With Project Road Name: Redlands Av. Road Segment: s/o Harley Knox Bl. SITE SPECIFIC INPUT DATA Highway Data Average Daily Traffic (Adt): Peak Hour Percentage: Peak Hour Volume: FHWA-RD HIGHWAY NOISE PREDICTION MODEL 5,012 vehicles 10% 501 vehicles 40 mph 56 feet Project Name: Brodiaea Job Number: NOISE MODEL INPUTS Site Conditions (Hard = 10, Soft = 15) Autos: 15 Medium Trucks (2 Axles): 15 Heavy Trucks (3+ Axles): 15 Vehicle Speed: Vehicle Mix Near/Far Lane Distance: VehicleType Day Evening Night Daily Site Data Autos: 77.5% 12.9% 9.6% 87.05% Barrier Height: 0.0 feet Medium Trucks: 84.8% 4.9% 10.3% 3.29% Barrier Type (0-Wall, 1-Berm): 0.0 Heavy Trucks: 86.5% 2.7% 10.8% 9.66% Centerline Dist. to Barrier: 47.0 feet Noise Source Elevations (in feet) Centerline Dist. to Observer: 47.0 feet Autos: Barrier Distance to Observer: 0.0 feet Medium Trucks: Observer Height (Above Pad): 5.0 feet Heavy Trucks: Grade Adjustment: 0.0 Pad Elevation: 0.0 feet Road Elevation: 0.0 feet Lane Equivalent Distance (in feet) Road Grade: 0.0% Autos: Left View: degrees Medium Trucks: Right View: 90.0 degrees Heavy Trucks: FHWA Noise Model Calculations VehicleType REMEL Traffic Flow Distance Finite Road Fresnel Barrier Atten Berm Atten Autos: Medium Trucks: Heavy Trucks: Unmitigated Noise Levels (without Topo and barrier attenuation) VehicleType Leq Peak Hour Leq Day Leq Evening Leq Night Ldn CNEL Autos: Medium Trucks: Heavy Trucks: Vehicle Noise: Centerline Distance to Noise Contour (in feet) Ldn: CNEL: 70 dba 65 dba 60 dba 55 dba Scenario: OY 2022 With Project Road Name: Redlands Av. Road Segment: s/o Nance St. SITE SPECIFIC INPUT DATA Highway Data Average Daily Traffic (Adt): Peak Hour Percentage: Peak Hour Volume: FHWA-RD HIGHWAY NOISE PREDICTION MODEL 4,775 vehicles 10% 478 vehicles 40 mph 56 feet Project Name: Brodiaea Job Number: NOISE MODEL INPUTS Site Conditions (Hard = 10, Soft = 15) Autos: 15 Medium Trucks (2 Axles): 15 Heavy Trucks (3+ Axles): 15 Vehicle Speed: Vehicle Mix Near/Far Lane Distance: VehicleType Day Evening Night Daily Site Data Autos: 77.5% 12.9% 9.6% 88.98% Barrier Height: 0.0 feet Medium Trucks: 84.8% 4.9% 10.3% 3.01% Barrier Type (0-Wall, 1-Berm): 0.0 Heavy Trucks: 86.5% 2.7% 10.8% 8.02% Centerline Dist. to Barrier: 47.0 feet Noise Source Elevations (in feet) Centerline Dist. to Observer: 47.0 feet Autos: Barrier Distance to Observer: 0.0 feet Medium Trucks: Observer Height (Above Pad): 5.0 feet Heavy Trucks: Grade Adjustment: 0.0 Pad Elevation: 0.0 feet Road Elevation: 0.0 feet Lane Equivalent Distance (in feet) Road Grade: 0.0% Autos: Left View: degrees Medium Trucks: Right View: 90.0 degrees Heavy Trucks: FHWA Noise Model Calculations VehicleType REMEL Traffic Flow Distance Finite Road Fresnel Barrier Atten Berm Atten Autos: Medium Trucks: Heavy Trucks: Unmitigated Noise Levels (without Topo and barrier attenuation) VehicleType Leq Peak Hour Leq Day Leq Evening Leq Night Ldn CNEL Autos: Medium Trucks: Heavy Trucks: Vehicle Noise: Centerline Distance to Noise Contour (in feet) Ldn: CNEL: 70 dba 65 dba 60 dba 55 dba Tuesday, January 16, 2018 Tuesday, January 16,
90 Scenario: OY 2022 With Project Road Name: Harley Knox Bl. Road Segment: w/o Driveway 1 SITE SPECIFIC INPUT DATA Highway Data Average Daily Traffic (Adt): Peak Hour Percentage: Peak Hour Volume: FHWA-RD HIGHWAY NOISE PREDICTION MODEL 4,912 vehicles 10% 491 vehicles 45 mph 54 feet Project Name: Brodiaea Job Number: NOISE MODEL INPUTS Site Conditions (Hard = 10, Soft = 15) Autos: 15 Medium Trucks (2 Axles): 15 Heavy Trucks (3+ Axles): 15 Vehicle Speed: Vehicle Mix Near/Far Lane Distance: VehicleType Day Evening Night Daily Site Data Autos: 77.5% 12.9% 9.6% 87.12% Barrier Height: 0.0 feet Medium Trucks: 84.8% 4.9% 10.3% 3.26% Barrier Type (0-Wall, 1-Berm): 0.0 Heavy Trucks: 86.5% 2.7% 10.8% 9.61% Centerline Dist. to Barrier: 47.0 feet Noise Source Elevations (in feet) Centerline Dist. to Observer: 47.0 feet Autos: Barrier Distance to Observer: 0.0 feet Medium Trucks: Observer Height (Above Pad): 5.0 feet Heavy Trucks: Grade Adjustment: 0.0 Pad Elevation: 0.0 feet Road Elevation: 0.0 feet Lane Equivalent Distance (in feet) Road Grade: 0.0% Autos: Left View: degrees Medium Trucks: Right View: 90.0 degrees Heavy Trucks: FHWA Noise Model Calculations VehicleType REMEL Traffic Flow Distance Finite Road Fresnel Barrier Atten Berm Atten Autos: Medium Trucks: Heavy Trucks: Unmitigated Noise Levels (without Topo and barrier attenuation) VehicleType Leq Peak Hour Leq Day Leq Evening Leq Night Ldn CNEL Autos: Medium Trucks: Heavy Trucks: Vehicle Noise: Centerline Distance to Noise Contour (in feet) Ldn: CNEL: 70 dba 65 dba 60 dba 55 dba Scenario: OY 2022 With Project Road Name: Harley Knox Bl. Road Segment: w/o Redlands Av. SITE SPECIFIC INPUT DATA Highway Data Average Daily Traffic (Adt): Peak Hour Percentage: Peak Hour Volume: FHWA-RD HIGHWAY NOISE PREDICTION MODEL 4,912 vehicles 10% 491 vehicles 45 mph 54 feet Project Name: Brodiaea Job Number: NOISE MODEL INPUTS Site Conditions (Hard = 10, Soft = 15) Autos: 15 Medium Trucks (2 Axles): 15 Heavy Trucks (3+ Axles): 15 Vehicle Speed: Vehicle Mix Near/Far Lane Distance: VehicleType Day Evening Night Daily Site Data Autos: 77.5% 12.9% 9.6% 87.12% Barrier Height: 0.0 feet Medium Trucks: 84.8% 4.9% 10.3% 3.26% Barrier Type (0-Wall, 1-Berm): 0.0 Heavy Trucks: 86.5% 2.7% 10.8% 9.61% Centerline Dist. to Barrier: 47.0 feet Noise Source Elevations (in feet) Centerline Dist. to Observer: 47.0 feet Autos: Barrier Distance to Observer: 0.0 feet Medium Trucks: Observer Height (Above Pad): 5.0 feet Heavy Trucks: Grade Adjustment: 0.0 Pad Elevation: 0.0 feet Road Elevation: 0.0 feet Lane Equivalent Distance (in feet) Road Grade: 0.0% Autos: Left View: degrees Medium Trucks: Right View: 90.0 degrees Heavy Trucks: FHWA Noise Model Calculations VehicleType REMEL Traffic Flow Distance Finite Road Fresnel Barrier Atten Berm Atten Autos: Medium Trucks: Heavy Trucks: Unmitigated Noise Levels (without Topo and barrier attenuation) VehicleType Leq Peak Hour Leq Day Leq Evening Leq Night Ldn CNEL Autos: Medium Trucks: Heavy Trucks: Vehicle Noise: Centerline Distance to Noise Contour (in feet) Ldn: CNEL: 70 dba 65 dba 60 dba 55 dba Tuesday, January 16, 2018 Tuesday, January 16, 2018 Scenario: OY 2022 With Project Road Name: Nance St. Road Segment: e/o Driveway 2 SITE SPECIFIC INPUT DATA Highway Data Average Daily Traffic (Adt): Peak Hour Percentage: Peak Hour Volume: FHWA-RD HIGHWAY NOISE PREDICTION MODEL 528 vehicles 10% 53 vehicles 40 mph 12 feet Project Name: Brodiaea Job Number: NOISE MODEL INPUTS Site Conditions (Hard = 10, Soft = 15) Autos: 15 Medium Trucks (2 Axles): 15 Heavy Trucks (3+ Axles): 15 Vehicle Speed: Vehicle Mix Near/Far Lane Distance: VehicleType Day Evening Night Daily Site Data Autos: 77.5% 12.9% 9.6% 79.43% Barrier Height: 0.0 feet Medium Trucks: 84.8% 4.9% 10.3% 4.46% Barrier Type (0-Wall, 1-Berm): 0.0 Heavy Trucks: 86.5% 2.7% 10.8% 16.11% Centerline Dist. to Barrier: 30.0 feet Noise Source Elevations (in feet) Centerline Dist. to Observer: 30.0 feet Autos: Barrier Distance to Observer: 0.0 feet Medium Trucks: Observer Height (Above Pad): 5.0 feet Heavy Trucks: Grade Adjustment: 0.0 Pad Elevation: 0.0 feet Road Elevation: 0.0 feet Lane Equivalent Distance (in feet) Road Grade: 0.0% Autos: Left View: degrees Medium Trucks: Right View: 90.0 degrees Heavy Trucks: FHWA Noise Model Calculations VehicleType REMEL Traffic Flow Distance Finite Road Fresnel Barrier Atten Berm Atten Autos: Medium Trucks: Heavy Trucks: Unmitigated Noise Levels (without Topo and barrier attenuation) VehicleType Leq Peak Hour Leq Day Leq Evening Leq Night Ldn CNEL Autos: Medium Trucks: Heavy Trucks: Vehicle Noise: Centerline Distance to Noise Contour (in feet) Ldn: CNEL: 70 dba 65 dba 60 dba 55 dba Scenario: OY 2022 With Project Road Name: Nance St. Road Segment: w/o Redlands Av. SITE SPECIFIC INPUT DATA Highway Data Average Daily Traffic (Adt): Peak Hour Percentage: Peak Hour Volume: FHWA-RD HIGHWAY NOISE PREDICTION MODEL 528 vehicles 10% 53 vehicles 40 mph 12 feet Project Name: Brodiaea Job Number: NOISE MODEL INPUTS Site Conditions (Hard = 10, Soft = 15) Autos: 15 Medium Trucks (2 Axles): 15 Heavy Trucks (3+ Axles): 15 Vehicle Speed: Vehicle Mix Near/Far Lane Distance: VehicleType Day Evening Night Daily Site Data Autos: 77.5% 12.9% 9.6% 79.43% Barrier Height: 0.0 feet Medium Trucks: 84.8% 4.9% 10.3% 4.46% Barrier Type (0-Wall, 1-Berm): 0.0 Heavy Trucks: 86.5% 2.7% 10.8% 16.11% Centerline Dist. to Barrier: 30.0 feet Noise Source Elevations (in feet) Centerline Dist. to Observer: 30.0 feet Autos: Barrier Distance to Observer: 0.0 feet Medium Trucks: Observer Height (Above Pad): 5.0 feet Heavy Trucks: Grade Adjustment: 0.0 Pad Elevation: 0.0 feet Road Elevation: 0.0 feet Lane Equivalent Distance (in feet) Road Grade: 0.0% Autos: Left View: degrees Medium Trucks: Right View: 90.0 degrees Heavy Trucks: FHWA Noise Model Calculations VehicleType REMEL Traffic Flow Distance Finite Road Fresnel Barrier Atten Berm Atten Autos: Medium Trucks: Heavy Trucks: Unmitigated Noise Levels (without Topo and barrier attenuation) VehicleType Leq Peak Hour Leq Day Leq Evening Leq Night Ldn CNEL Autos: Medium Trucks: Heavy Trucks: Vehicle Noise: Centerline Distance to Noise Contour (in feet) Ldn: CNEL: 70 dba 65 dba 60 dba 55 dba Tuesday, January 16, 2018 Tuesday, January 16,
91 Scenario: HY 2040 Without Project Road Name: Redlands Av. Road Segment: s/o Harley Knox Bl. SITE SPECIFIC INPUT DATA Highway Data Average Daily Traffic (Adt): Peak Hour Percentage: Peak Hour Volume: FHWA-RD HIGHWAY NOISE PREDICTION MODEL 7,257 vehicles 10% 726 vehicles 40 mph 56 feet Project Name: Brodiaea Job Number: NOISE MODEL INPUTS Site Conditions (Hard = 10, Soft = 15) Autos: 15 Medium Trucks (2 Axles): 15 Heavy Trucks (3+ Axles): 15 Vehicle Speed: Vehicle Mix Near/Far Lane Distance: VehicleType Day Evening Night Daily Site Data Autos: 77.5% 12.9% 9.6% 88.83% Barrier Height: 0.0 feet Medium Trucks: 84.8% 4.9% 10.3% 3.05% Barrier Type (0-Wall, 1-Berm): 0.0 Heavy Trucks: 86.5% 2.7% 10.8% 8.12% Centerline Dist. to Barrier: 47.0 feet Noise Source Elevations (in feet) Centerline Dist. to Observer: 47.0 feet Autos: Barrier Distance to Observer: 0.0 feet Medium Trucks: Observer Height (Above Pad): 5.0 feet Heavy Trucks: Grade Adjustment: 0.0 Pad Elevation: 0.0 feet Road Elevation: 0.0 feet Lane Equivalent Distance (in feet) Road Grade: 0.0% Autos: Left View: degrees Medium Trucks: Right View: 90.0 degrees Heavy Trucks: FHWA Noise Model Calculations VehicleType REMEL Traffic Flow Distance Finite Road Fresnel Barrier Atten Berm Atten Autos: Medium Trucks: Heavy Trucks: Unmitigated Noise Levels (without Topo and barrier attenuation) VehicleType Leq Peak Hour Leq Day Leq Evening Leq Night Ldn CNEL Autos: Medium Trucks: Heavy Trucks: Vehicle Noise: Centerline Distance to Noise Contour (in feet) Ldn: CNEL: 70 dba 65 dba 60 dba 55 dba Scenario: HY 2040 Without Project Road Name: Redlands Av. Road Segment: s/o Nance St. SITE SPECIFIC INPUT DATA Highway Data Average Daily Traffic (Adt): Peak Hour Percentage: Peak Hour Volume: FHWA-RD HIGHWAY NOISE PREDICTION MODEL 6,113 vehicles 10% 611 vehicles 40 mph 56 feet Project Name: Brodiaea Job Number: NOISE MODEL INPUTS Site Conditions (Hard = 10, Soft = 15) Autos: 15 Medium Trucks (2 Axles): 15 Heavy Trucks (3+ Axles): 15 Vehicle Speed: Vehicle Mix Near/Far Lane Distance: VehicleType Day Evening Night Daily Site Data Autos: 77.5% 12.9% 9.6% 88.83% Barrier Height: 0.0 feet Medium Trucks: 84.8% 4.9% 10.3% 3.05% Barrier Type (0-Wall, 1-Berm): 0.0 Heavy Trucks: 86.5% 2.7% 10.8% 8.12% Centerline Dist. to Barrier: 47.0 feet Noise Source Elevations (in feet) Centerline Dist. to Observer: 47.0 feet Autos: Barrier Distance to Observer: 0.0 feet Medium Trucks: Observer Height (Above Pad): 5.0 feet Heavy Trucks: Grade Adjustment: 0.0 Pad Elevation: 0.0 feet Road Elevation: 0.0 feet Lane Equivalent Distance (in feet) Road Grade: 0.0% Autos: Left View: degrees Medium Trucks: Right View: 90.0 degrees Heavy Trucks: FHWA Noise Model Calculations VehicleType REMEL Traffic Flow Distance Finite Road Fresnel Barrier Atten Berm Atten Autos: Medium Trucks: Heavy Trucks: Unmitigated Noise Levels (without Topo and barrier attenuation) VehicleType Leq Peak Hour Leq Day Leq Evening Leq Night Ldn CNEL Autos: Medium Trucks: Heavy Trucks: Vehicle Noise: Centerline Distance to Noise Contour (in feet) Ldn: CNEL: 70 dba 65 dba 60 dba 55 dba Tuesday, January 16, 2018 Tuesday, January 16, 2018 Scenario: HY 2040 Without Project Road Name: Harley Knox Bl. Road Segment: w/o Driveway 1 SITE SPECIFIC INPUT DATA Highway Data Average Daily Traffic (Adt): Peak Hour Percentage: Peak Hour Volume: FHWA-RD HIGHWAY NOISE PREDICTION MODEL 7,107 vehicles 10% 711 vehicles 45 mph 54 feet Project Name: Brodiaea Job Number: NOISE MODEL INPUTS Site Conditions (Hard = 10, Soft = 15) Autos: 15 Medium Trucks (2 Axles): 15 Heavy Trucks (3+ Axles): 15 Vehicle Speed: Vehicle Mix Near/Far Lane Distance: VehicleType Day Evening Night Daily Site Data Autos: 77.5% 12.9% 9.6% 88.83% Barrier Height: 0.0 feet Medium Trucks: 84.8% 4.9% 10.3% 3.05% Barrier Type (0-Wall, 1-Berm): 0.0 Heavy Trucks: 86.5% 2.7% 10.8% 8.12% Centerline Dist. to Barrier: 47.0 feet Noise Source Elevations (in feet) Centerline Dist. to Observer: 47.0 feet Autos: Barrier Distance to Observer: 0.0 feet Medium Trucks: Observer Height (Above Pad): 5.0 feet Heavy Trucks: Grade Adjustment: 0.0 Pad Elevation: 0.0 feet Road Elevation: 0.0 feet Lane Equivalent Distance (in feet) Road Grade: 0.0% Autos: Left View: degrees Medium Trucks: Right View: 90.0 degrees Heavy Trucks: FHWA Noise Model Calculations VehicleType REMEL Traffic Flow Distance Finite Road Fresnel Barrier Atten Berm Atten Autos: Medium Trucks: Heavy Trucks: Unmitigated Noise Levels (without Topo and barrier attenuation) VehicleType Leq Peak Hour Leq Day Leq Evening Leq Night Ldn CNEL Autos: Medium Trucks: Heavy Trucks: Vehicle Noise: Centerline Distance to Noise Contour (in feet) Ldn: CNEL: 70 dba 65 dba 60 dba 55 dba Scenario: HY 2040 Without Project Road Name: Harley Knox Bl. Road Segment: w/o Redlands Av. SITE SPECIFIC INPUT DATA Highway Data Average Daily Traffic (Adt): Peak Hour Percentage: Peak Hour Volume: FHWA-RD HIGHWAY NOISE PREDICTION MODEL 7,107 vehicles 10% 711 vehicles 45 mph 54 feet Project Name: Brodiaea Job Number: NOISE MODEL INPUTS Site Conditions (Hard = 10, Soft = 15) Autos: 15 Medium Trucks (2 Axles): 15 Heavy Trucks (3+ Axles): 15 Vehicle Speed: Vehicle Mix Near/Far Lane Distance: VehicleType Day Evening Night Daily Site Data Autos: 77.5% 12.9% 9.6% 88.83% Barrier Height: 0.0 feet Medium Trucks: 84.8% 4.9% 10.3% 3.05% Barrier Type (0-Wall, 1-Berm): 0.0 Heavy Trucks: 86.5% 2.7% 10.8% 8.12% Centerline Dist. to Barrier: 47.0 feet Noise Source Elevations (in feet) Centerline Dist. to Observer: 47.0 feet Autos: Barrier Distance to Observer: 0.0 feet Medium Trucks: Observer Height (Above Pad): 5.0 feet Heavy Trucks: Grade Adjustment: 0.0 Pad Elevation: 0.0 feet Road Elevation: 0.0 feet Lane Equivalent Distance (in feet) Road Grade: 0.0% Autos: Left View: degrees Medium Trucks: Right View: 90.0 degrees Heavy Trucks: FHWA Noise Model Calculations VehicleType REMEL Traffic Flow Distance Finite Road Fresnel Barrier Atten Berm Atten Autos: Medium Trucks: Heavy Trucks: Unmitigated Noise Levels (without Topo and barrier attenuation) VehicleType Leq Peak Hour Leq Day Leq Evening Leq Night Ldn CNEL Autos: Medium Trucks: Heavy Trucks: Vehicle Noise: Centerline Distance to Noise Contour (in feet) Ldn: CNEL: 70 dba 65 dba 60 dba 55 dba Tuesday, January 16, 2018 Tuesday, January 16,
92 Scenario: HY 2040 Without Project Road Name: Nance St. Road Segment: e/o Driveway 2 SITE SPECIFIC INPUT DATA Highway Data Average Daily Traffic (Adt): Peak Hour Percentage: Peak Hour Volume: FHWA-RD HIGHWAY NOISE PREDICTION MODEL 744 vehicles 10% 74 vehicles 40 mph 12 feet Project Name: Brodiaea Job Number: NOISE MODEL INPUTS Site Conditions (Hard = 10, Soft = 15) Autos: 15 Medium Trucks (2 Axles): 15 Heavy Trucks (3+ Axles): 15 Vehicle Speed: Vehicle Mix Near/Far Lane Distance: VehicleType Day Evening Night Daily Site Data Autos: 77.5% 12.9% 9.6% 88.83% Barrier Height: 0.0 feet Medium Trucks: 84.8% 4.9% 10.3% 3.05% Barrier Type (0-Wall, 1-Berm): 0.0 Heavy Trucks: 86.5% 2.7% 10.8% 8.12% Centerline Dist. to Barrier: 30.0 feet Noise Source Elevations (in feet) Centerline Dist. to Observer: 30.0 feet Autos: Barrier Distance to Observer: 0.0 feet Medium Trucks: Observer Height (Above Pad): 5.0 feet Heavy Trucks: Grade Adjustment: 0.0 Pad Elevation: 0.0 feet Road Elevation: 0.0 feet Lane Equivalent Distance (in feet) Road Grade: 0.0% Autos: Left View: degrees Medium Trucks: Right View: 90.0 degrees Heavy Trucks: FHWA Noise Model Calculations VehicleType REMEL Traffic Flow Distance Finite Road Fresnel Barrier Atten Berm Atten Autos: Medium Trucks: Heavy Trucks: Unmitigated Noise Levels (without Topo and barrier attenuation) VehicleType Leq Peak Hour Leq Day Leq Evening Leq Night Ldn CNEL Autos: Medium Trucks: Heavy Trucks: Vehicle Noise: Centerline Distance to Noise Contour (in feet) Ldn: CNEL: 70 dba 65 dba 60 dba 55 dba Scenario: HY 2040 Without Project Road Name: Nance St. Road Segment: w/o Redlands Av. SITE SPECIFIC INPUT DATA Highway Data Average Daily Traffic (Adt): Peak Hour Percentage: Peak Hour Volume: FHWA-RD HIGHWAY NOISE PREDICTION MODEL 1,044 vehicles 10% 104 vehicles 40 mph 12 feet Project Name: Brodiaea Job Number: NOISE MODEL INPUTS Site Conditions (Hard = 10, Soft = 15) Autos: 15 Medium Trucks (2 Axles): 15 Heavy Trucks (3+ Axles): 15 Vehicle Speed: Vehicle Mix Near/Far Lane Distance: VehicleType Day Evening Night Daily Site Data Autos: 77.5% 12.9% 9.6% 88.83% Barrier Height: 0.0 feet Medium Trucks: 84.8% 4.9% 10.3% 3.05% Barrier Type (0-Wall, 1-Berm): 0.0 Heavy Trucks: 86.5% 2.7% 10.8% 8.12% Centerline Dist. to Barrier: 30.0 feet Noise Source Elevations (in feet) Centerline Dist. to Observer: 30.0 feet Autos: Barrier Distance to Observer: 0.0 feet Medium Trucks: Observer Height (Above Pad): 5.0 feet Heavy Trucks: Grade Adjustment: 0.0 Pad Elevation: 0.0 feet Road Elevation: 0.0 feet Lane Equivalent Distance (in feet) Road Grade: 0.0% Autos: Left View: degrees Medium Trucks: Right View: 90.0 degrees Heavy Trucks: FHWA Noise Model Calculations VehicleType REMEL Traffic Flow Distance Finite Road Fresnel Barrier Atten Berm Atten Autos: Medium Trucks: Heavy Trucks: Unmitigated Noise Levels (without Topo and barrier attenuation) VehicleType Leq Peak Hour Leq Day Leq Evening Leq Night Ldn CNEL Autos: Medium Trucks: Heavy Trucks: Vehicle Noise: Centerline Distance to Noise Contour (in feet) Ldn: CNEL: 70 dba 65 dba 60 dba 55 dba Tuesday, January 16, 2018 Tuesday, January 16, 2018 Scenario: HY 2040 With Project Road Name: Redlands Av. Road Segment: s/o Harley Knox Bl. SITE SPECIFIC INPUT DATA Highway Data Average Daily Traffic (Adt): Peak Hour Percentage: Peak Hour Volume: FHWA-RD HIGHWAY NOISE PREDICTION MODEL 7,512 vehicles 10% 751 vehicles 40 mph 56 feet Project Name: Brodiaea Job Number: NOISE MODEL INPUTS Site Conditions (Hard = 10, Soft = 15) Autos: 15 Medium Trucks (2 Axles): 15 Heavy Trucks (3+ Axles): 15 Vehicle Speed: Vehicle Mix Near/Far Lane Distance: VehicleType Day Evening Night Daily Site Data Autos: 77.5% 12.9% 9.6% 87.64% Barrier Height: 0.0 feet Medium Trucks: 84.8% 4.9% 10.3% 3.21% Barrier Type (0-Wall, 1-Berm): 0.0 Heavy Trucks: 86.5% 2.7% 10.8% 9.15% Centerline Dist. to Barrier: 47.0 feet Noise Source Elevations (in feet) Centerline Dist. to Observer: 47.0 feet Autos: Barrier Distance to Observer: 0.0 feet Medium Trucks: Observer Height (Above Pad): 5.0 feet Heavy Trucks: Grade Adjustment: 0.0 Pad Elevation: 0.0 feet Road Elevation: 0.0 feet Lane Equivalent Distance (in feet) Road Grade: 0.0% Autos: Left View: degrees Medium Trucks: Right View: 90.0 degrees Heavy Trucks: FHWA Noise Model Calculations VehicleType REMEL Traffic Flow Distance Finite Road Fresnel Barrier Atten Berm Atten Autos: Medium Trucks: Heavy Trucks: Unmitigated Noise Levels (without Topo and barrier attenuation) VehicleType Leq Peak Hour Leq Day Leq Evening Leq Night Ldn CNEL Autos: Medium Trucks: Heavy Trucks: Vehicle Noise: Centerline Distance to Noise Contour (in feet) Ldn: CNEL: 70 dba 65 dba 60 dba 55 dba Scenario: HY 2040 With Project Road Name: Redlands Av. Road Segment: s/o Nance St. SITE SPECIFIC INPUT DATA Highway Data Average Daily Traffic (Adt): Peak Hour Percentage: Peak Hour Volume: FHWA-RD HIGHWAY NOISE PREDICTION MODEL 6,175 vehicles 10% 618 vehicles 40 mph 56 feet Project Name: Brodiaea Job Number: NOISE MODEL INPUTS Site Conditions (Hard = 10, Soft = 15) Autos: 15 Medium Trucks (2 Axles): 15 Heavy Trucks (3+ Axles): 15 Vehicle Speed: Vehicle Mix Near/Far Lane Distance: VehicleType Day Evening Night Daily Site Data Autos: 77.5% 12.9% 9.6% 88.95% Barrier Height: 0.0 feet Medium Trucks: 84.8% 4.9% 10.3% 3.01% Barrier Type (0-Wall, 1-Berm): 0.0 Heavy Trucks: 86.5% 2.7% 10.8% 8.04% Centerline Dist. to Barrier: 47.0 feet Noise Source Elevations (in feet) Centerline Dist. to Observer: 47.0 feet Autos: Barrier Distance to Observer: 0.0 feet Medium Trucks: Observer Height (Above Pad): 5.0 feet Heavy Trucks: Grade Adjustment: 0.0 Pad Elevation: 0.0 feet Road Elevation: 0.0 feet Lane Equivalent Distance (in feet) Road Grade: 0.0% Autos: Left View: degrees Medium Trucks: Right View: 90.0 degrees Heavy Trucks: FHWA Noise Model Calculations VehicleType REMEL Traffic Flow Distance Finite Road Fresnel Barrier Atten Berm Atten Autos: Medium Trucks: Heavy Trucks: Unmitigated Noise Levels (without Topo and barrier attenuation) VehicleType Leq Peak Hour Leq Day Leq Evening Leq Night Ldn CNEL Autos: Medium Trucks: Heavy Trucks: Vehicle Noise: Centerline Distance to Noise Contour (in feet) Ldn: CNEL: 70 dba 65 dba 60 dba 55 dba Tuesday, January 16, 2018 Tuesday, January 16,
93 Scenario: HY 2040 With Project Road Name: Harley Knox Bl. Road Segment: w/o Driveway 1 SITE SPECIFIC INPUT DATA Highway Data Average Daily Traffic (Adt): Peak Hour Percentage: Peak Hour Volume: FHWA-RD HIGHWAY NOISE PREDICTION MODEL 7,412 vehicles 10% 741 vehicles 45 mph 54 feet Project Name: Brodiaea Job Number: NOISE MODEL INPUTS Site Conditions (Hard = 10, Soft = 15) Autos: 15 Medium Trucks (2 Axles): 15 Heavy Trucks (3+ Axles): 15 Vehicle Speed: Vehicle Mix Near/Far Lane Distance: VehicleType Day Evening Night Daily Site Data Autos: 77.5% 12.9% 9.6% 87.70% Barrier Height: 0.0 feet Medium Trucks: 84.8% 4.9% 10.3% 3.19% Barrier Type (0-Wall, 1-Berm): 0.0 Heavy Trucks: 86.5% 2.7% 10.8% 9.11% Centerline Dist. to Barrier: 47.0 feet Noise Source Elevations (in feet) Centerline Dist. to Observer: 47.0 feet Autos: Barrier Distance to Observer: 0.0 feet Medium Trucks: Observer Height (Above Pad): 5.0 feet Heavy Trucks: Grade Adjustment: 0.0 Pad Elevation: 0.0 feet Road Elevation: 0.0 feet Lane Equivalent Distance (in feet) Road Grade: 0.0% Autos: Left View: degrees Medium Trucks: Right View: 90.0 degrees Heavy Trucks: FHWA Noise Model Calculations VehicleType REMEL Traffic Flow Distance Finite Road Fresnel Barrier Atten Berm Atten Autos: Medium Trucks: Heavy Trucks: Unmitigated Noise Levels (without Topo and barrier attenuation) VehicleType Leq Peak Hour Leq Day Leq Evening Leq Night Ldn CNEL Autos: Medium Trucks: Heavy Trucks: Vehicle Noise: Centerline Distance to Noise Contour (in feet) Ldn: CNEL: 70 dba 65 dba 60 dba 55 dba Scenario: HY 2040 With Project Road Name: Harley Knox Bl. Road Segment: w/o Redlands Av. SITE SPECIFIC INPUT DATA Highway Data Average Daily Traffic (Adt): Peak Hour Percentage: Peak Hour Volume: FHWA-RD HIGHWAY NOISE PREDICTION MODEL 7,412 vehicles 10% 741 vehicles 45 mph 54 feet Project Name: Brodiaea Job Number: NOISE MODEL INPUTS Site Conditions (Hard = 10, Soft = 15) Autos: 15 Medium Trucks (2 Axles): 15 Heavy Trucks (3+ Axles): 15 Vehicle Speed: Vehicle Mix Near/Far Lane Distance: VehicleType Day Evening Night Daily Site Data Autos: 77.5% 12.9% 9.6% 87.70% Barrier Height: 0.0 feet Medium Trucks: 84.8% 4.9% 10.3% 3.19% Barrier Type (0-Wall, 1-Berm): 0.0 Heavy Trucks: 86.5% 2.7% 10.8% 9.11% Centerline Dist. to Barrier: 47.0 feet Noise Source Elevations (in feet) Centerline Dist. to Observer: 47.0 feet Autos: Barrier Distance to Observer: 0.0 feet Medium Trucks: Observer Height (Above Pad): 5.0 feet Heavy Trucks: Grade Adjustment: 0.0 Pad Elevation: 0.0 feet Road Elevation: 0.0 feet Lane Equivalent Distance (in feet) Road Grade: 0.0% Autos: Left View: degrees Medium Trucks: Right View: 90.0 degrees Heavy Trucks: FHWA Noise Model Calculations VehicleType REMEL Traffic Flow Distance Finite Road Fresnel Barrier Atten Berm Atten Autos: Medium Trucks: Heavy Trucks: Unmitigated Noise Levels (without Topo and barrier attenuation) VehicleType Leq Peak Hour Leq Day Leq Evening Leq Night Ldn CNEL Autos: Medium Trucks: Heavy Trucks: Vehicle Noise: Centerline Distance to Noise Contour (in feet) Ldn: CNEL: 70 dba 65 dba 60 dba 55 dba Tuesday, January 16, 2018 Tuesday, January 16, 2018 Scenario: HY 2040 With Project Road Name: Nance St. Road Segment: e/o Driveway 2 SITE SPECIFIC INPUT DATA Highway Data Average Daily Traffic (Adt): Peak Hour Percentage: Peak Hour Volume: FHWA-RD HIGHWAY NOISE PREDICTION MODEL 828 vehicles 10% 83 vehicles 40 mph 12 feet Project Name: Brodiaea Job Number: NOISE MODEL INPUTS Site Conditions (Hard = 10, Soft = 15) Autos: 15 Medium Trucks (2 Axles): 15 Heavy Trucks (3+ Axles): 15 Vehicle Speed: Vehicle Mix Near/Far Lane Distance: VehicleType Day Evening Night Daily Site Data Autos: 77.5% 12.9% 9.6% 82.84% Barrier Height: 0.0 feet Medium Trucks: 84.8% 4.9% 10.3% 3.94% Barrier Type (0-Wall, 1-Berm): 0.0 Heavy Trucks: 86.5% 2.7% 10.8% 13.22% Centerline Dist. to Barrier: 30.0 feet Noise Source Elevations (in feet) Centerline Dist. to Observer: 30.0 feet Autos: Barrier Distance to Observer: 0.0 feet Medium Trucks: Observer Height (Above Pad): 5.0 feet Heavy Trucks: Grade Adjustment: 0.0 Pad Elevation: 0.0 feet Road Elevation: 0.0 feet Lane Equivalent Distance (in feet) Road Grade: 0.0% Autos: Left View: degrees Medium Trucks: Right View: 90.0 degrees Heavy Trucks: FHWA Noise Model Calculations VehicleType REMEL Traffic Flow Distance Finite Road Fresnel Barrier Atten Berm Atten Autos: Medium Trucks: Heavy Trucks: Unmitigated Noise Levels (without Topo and barrier attenuation) VehicleType Leq Peak Hour Leq Day Leq Evening Leq Night Ldn CNEL Autos: Medium Trucks: Heavy Trucks: Vehicle Noise: Centerline Distance to Noise Contour (in feet) Ldn: CNEL: 70 dba 65 dba 60 dba 55 dba Scenario: HY 2040 With Project Road Name: Nance St. Road Segment: w/o Redlands Av. SITE SPECIFIC INPUT DATA Highway Data Average Daily Traffic (Adt): Peak Hour Percentage: Peak Hour Volume: FHWA-RD HIGHWAY NOISE PREDICTION MODEL 1,128 vehicles 10% 113 vehicles 40 mph 12 feet Project Name: Brodiaea Job Number: NOISE MODEL INPUTS Site Conditions (Hard = 10, Soft = 15) Autos: 15 Medium Trucks (2 Axles): 15 Heavy Trucks (3+ Axles): 15 Vehicle Speed: Vehicle Mix Near/Far Lane Distance: VehicleType Day Evening Night Daily Site Data Autos: 77.5% 12.9% 9.6% 84.43% Barrier Height: 0.0 feet Medium Trucks: 84.8% 4.9% 10.3% 3.71% Barrier Type (0-Wall, 1-Berm): 0.0 Heavy Trucks: 86.5% 2.7% 10.8% 11.86% Centerline Dist. to Barrier: 30.0 feet Noise Source Elevations (in feet) Centerline Dist. to Observer: 30.0 feet Autos: Barrier Distance to Observer: 0.0 feet Medium Trucks: Observer Height (Above Pad): 5.0 feet Heavy Trucks: Grade Adjustment: 0.0 Pad Elevation: 0.0 feet Road Elevation: 0.0 feet Lane Equivalent Distance (in feet) Road Grade: 0.0% Autos: Left View: degrees Medium Trucks: Right View: 90.0 degrees Heavy Trucks: FHWA Noise Model Calculations VehicleType REMEL Traffic Flow Distance Finite Road Fresnel Barrier Atten Berm Atten Autos: Medium Trucks: Heavy Trucks: Unmitigated Noise Levels (without Topo and barrier attenuation) VehicleType Leq Peak Hour Leq Day Leq Evening Leq Night Ldn CNEL Autos: Medium Trucks: Heavy Trucks: Vehicle Noise: Centerline Distance to Noise Contour (in feet) Ldn: CNEL: 70 dba 65 dba 60 dba 55 dba Tuesday, January 16, 2018 Tuesday, January 16,
94 This page intentionally left blank 88
95 APPENDIX 9.1: REFERENCE DISTRIBUTION/WAREHOUSE NOISE SOURCE PHOTOS 89
96 This page intentionally left blank 90


97 Reference Measurement: Motivational Fulfillment 6810 Bickmore Avenue, Chino Motivational Fulfillment_01 Motivational Fulfillment_02 Motivational Fulfillment_03 Source_1-1 Source_1-2 Source_1-3 91
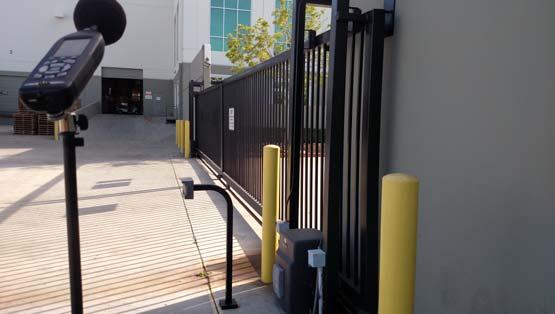
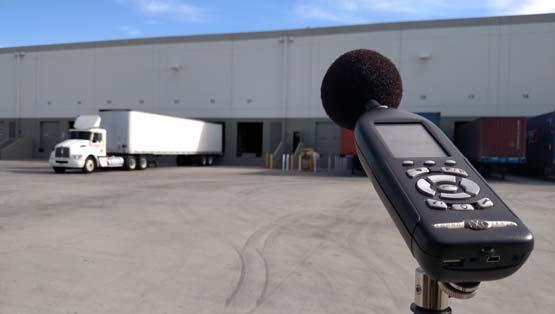

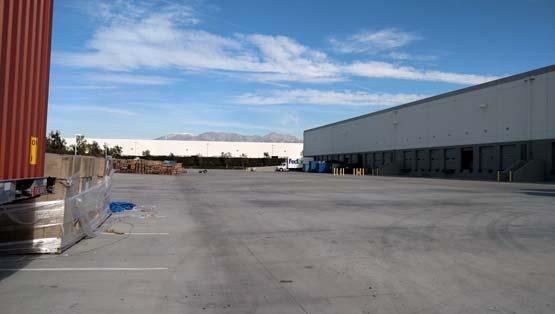
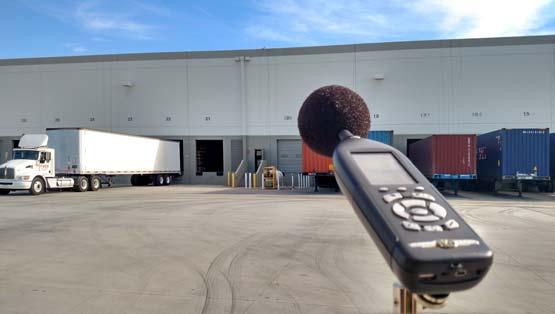

98 Reference Measurement: Motivational Fulfillment 6810 Bickmore Avenue, Chino Source_1-4 Source_2-1 Source_2-2 Source_2-3 Source_2-4 Source_2-5 92


99 Reference Measurement: Motivational Fulfillment 6810 Bickmore Avenue, Chino Source_2-6 Source_2-7 Source_2-8 Source_2-9 93