Reducing Emissions from Deforestation and Forest Degradation (REDD) is an effort to create a financial value for the carbon stored in forests,
|
|
|
- Rosanna Blankenship
- 5 years ago
- Views:
Transcription

1 Carbon Cycling CCT GENERAL QUESTION 6: How do changing freshwater inflows, tidal and storm cycles, and climate patterns affect the magnitude, rates, and pathways of C sequestration, loss, storage, and transport across the land-water continuum?
2

3 Reducing Emissions from Deforestation and Forest Degradation (REDD) is an effort to create a financial value for the carbon stored in forests, offering incentives for developing countries to reduce emissions from forested lands and invest in low-carbon paths to sustainable development. REDD+ goes beyond deforestation and forest degradation, and includes the role of conservation, sustainable management of forests and enhancement of forest carbon stocks. 3

4 How much is CO 2 worth? It is predicted that financial flows for greenhouse gas emission reductions from REDD+ could reach up to US$30 billion a year. Australia s proposed carbon price under the proposed carbon tax is around $20/ton 4


5 Blue Carbon: Organic carbon stored in the ocean s ecosystems 5
6 NEE
7 NEE = GPP ab + GPP bg R exports S NEE = NECB exports (DOC, DIC, POC)
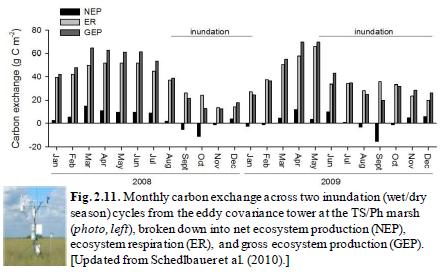
8 Hypothesis 6.1: Temporal variability in C uptake, storage, and transport in the mangrove ecotone reflects the pulsed dynamics of marine water, nutrient, and sediment supplies driven by tides and storms, and freshwater supply driven by seasonal rainfall and water management We expect to find that the temporal variability in the C balance along the FCE transect will reflect the seasonally-adjusted plant eco-physiological and ecosystem respiratory responses to the variable influences of marine and freshwater supplies defined by changes in surface and pore-water conductivity, water residence time, and tidal energy. Hypothesis 6.2: Landscape patterns in C fluxes reveal legacies of exposure of the marsh, mangrove, and seagrass ecosystems to long-term changes in the balance of fresh and marine water We expect that landscape-scale patterns of change in the C balance will be determined by the mitigating or magnifying effects of water management and rainfall variability on the impacts of SLR.


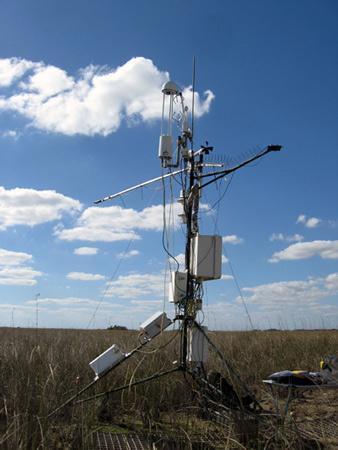
9 We are measuring NEE with flux towers in the sawgrass and mangroves
10
 About CO 2 efflux from Shark River Asymmetry in CO 2 uptake")

11 Net ecosystem CO 2 exchange (NEE) and litter fall Mangrove foliage has a lifetime of ~18 months (TJ Smith, personal communication) About CO 2 efflux from Shark River Asymmetry in CO 2 uptake (-NEE) by foliage and litter fall production NEE reduced after the storm with 1170 g C m -2 in 2004 compared to 796 g C m -2 in 2010 Need to move from point and plot-based to ecotone level estimates.

12 This year we will gear up to measure NEE in the submerged Florida Bay communities using underwater eddy covariance towers
13 Below-canopy components of CO 2 flux at SRS 6 CO 2 flux (μmole m -2 s -1 )

14 We are measuring major components of NPP in sawgrass, mangrove and seagrass parts of the system Herbert and Fourqurean 2009 E&C
15 Two components to the mangrove ecotone carbon budget NEE Land surface Riverine Chapin et al Understanding factors affecting Δ Storage are the key to Blue Carbon schemes Governing equation for Land surface C budget NECB = - NEE + F DIC,DOC,POC Chapin et al. 2006


16 NEE Understanding factors affecting Δ Storage are the key to Blue Carbon schemes
17 Preliminary fluxes (g C m -2 yr -1 ) and estimates of F DOC,DIC,POC Year - NEE NPP Est. from Rivera-Monroy & Castaneda F DOC, DIC, POC Soil Accumulation Barr et al. Litter Wood Roots Total J. Smoak Pre- Wilma Pre (2002) 890 ( ) 123 ( ) ( )* Post- Wilma ( )* N/R ** N/R ** *** *** *** ***

18 Map - SharkTREx Harney River SF6 injection site Tarpon Bay Tarpon Bay SRS-4 SRS-6 SRS-5

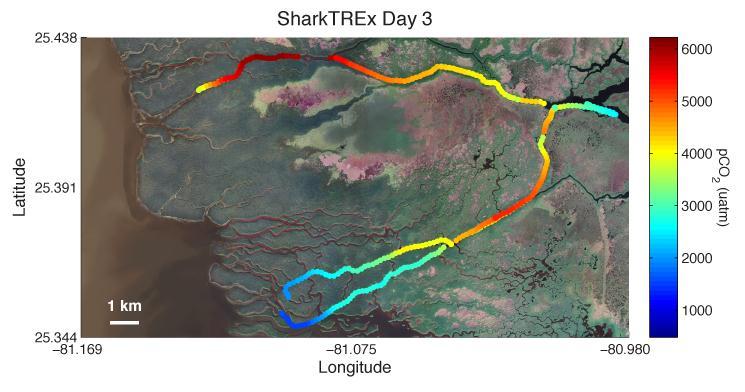
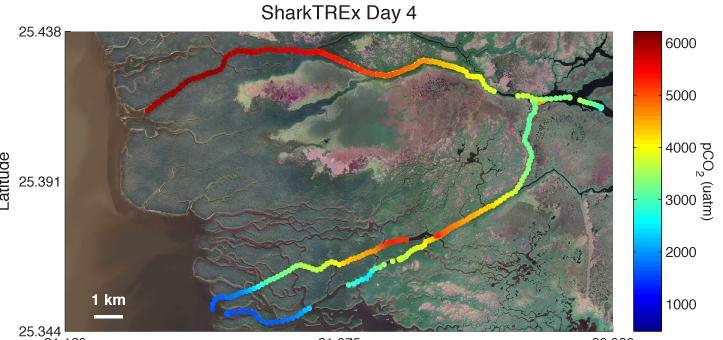
19 Spatial variation of pco2
20 Physicochemical Characteristics of Shark River Clear non-conservative patterns Low ph and O2 saturation levels coincide with high TAlk, DIC and pco2 indicate intense mineralization. Higher DIC concentrations coincide with more depleted δ 13 CDIC Mineralization of mangrove-derived carbon (δ 13 C -28 )
21 Sources/sinks of pco 2 in Shark River Combination of aerobic respiration, sulfate reduction mineralization, CO2 emission and CaCO3 dissolution
22 Temporal patterns of ecosystem gross primary production (GPP) Sufficient process-based knowledge has been gained with Everglades National Park (western region) mangroves to apply functional relationships to estimate ecosystem GPP seasonal patterns using remote sensing information (MODIS). The GPP estimates, using remote sensing data are, are based on the concept of light use efficiency (LUE = GGP/PAR). The GPP estimates are modulated by environmental variables influencing carbon assimilation (e.g., soil pore water salinity, (foliage) temperature, and absorbed photosynthetic active radiation).
23 Temporal patterns of ecosystem gross primary production (GPP) Model captures seasonal minima in GPP? Hurricane impacts likely underestimated
24 Comparison of GPP estimated based on satellite and tower data Modeled daily GPP favorably compared to EC-estimated GPP
25 Summary and future directions - NEE = 850 to 1100 g C m -2 yr -1 Due to year-round growing season, mangroves in the western Everglades assimilate carbon at rates ranging from 8 to 11 tons C per hectare per year. Regional and global drivers modulate carbon sequestration. Carbon flux associated with DIC, DOC, POC represents an important component of the mangrove carbon balance and needs to be experimentally determined. More mangrove end points need to be investigated to verify the state of the mangrove ecotone using remote sensing information.
26 1200 Ecosystem C storage (Mg C org ha -1 ) Boreal Living Biomass Soil C org Temeprate Tropical Upland Oceanic Mangrove * * * * * * * * * * Seagrass
27 Organic C storage in soil Mg C ha Russell 1 Russell 2 Trout 2 Florida Bay Ninemile 2 Ninemile 1 Bob Allen 1 Bob Allen 2 Trout Shark Bay F10b W4b F17b
28 0 Ninemile 1 Ninemile 2 Bob AllenBob Allen Russell Russell 2 Trout 1 Trout 2 C org and P content increase towards the tops of Florida Bay cores increases in P availability influence C org storage Depth (cm) * * * * * * Ninemile Ninemile 2 C org (% dry weight) Bob AllenBob Allen Russell Russell 2 Trout 1 Trout 2 Depth (cm) * * * * * * * * Soil P content ( g g -1 ) 28
29 A very rough estimate of carbon stored in the top meter of seagrass soils in south Florida: 18,000 km 2 of seagrasses 594 tons CO 2 e ha -1 1 x 10 9 tons CO 2 e stored in the soils! Anthropogenic CO 2 e flux is about 29 x 10 9 tons y -1

30 Seasonal patterns in NDVI ( )