PENGROWTH ENERGY CORPORATION LINDBERGH SAGD PROJECT 2017 ANNUAL PERFORMANCE PRESENTATION SCHEME APPROVAL 6410P
|
|
|
- Milo Bell
- 5 years ago
- Views:
Transcription


1 PENGROWTH ENERGY CORPORATION LINDBERGH SAGD PROJECT 2017 ANNUAL PERFORMANCE PRESENTATION SCHEME APPROVAL 6410P
2 SUBSURFACE ISSUES: TABLE OF CONTENTS 1. Brief Background of the Scheme 2. Geology/Geoscience 3. Drilling and Completions 4. Artificial Lift 5. Instrumentation in Wells 6. Seismic 7. Scheme Performance 8. Future Plans 2

3 BACKGROUND AND OVERVIEW 3

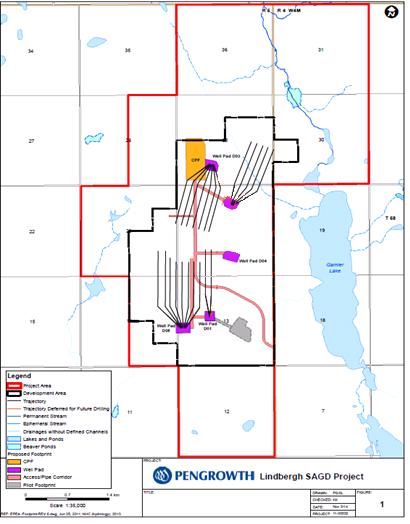
4 PROJECT LOCATION 4

5 PROJECT OVERVIEW Pilot project implemented to evaluate the SAGD recovery process in the Mannville Lloydminster Formation 12,500 bpd SAGD facility completed Q4, pilot SAGD wells began steam circulation Feb new SAGD wells began steam circulation Dec new SAGD well/2 Infill wells began steam circulation June new SAGD wells began steam circulation Sept 2017 Pilot SAGD well production moved to 12,500 bpd facility Pilot facility mothballed Approved to increase production to 40,000 bpd 5

6 LINDBERGH HISTORY Murphy piloted and then commercialized CSS production in the Lloydminster and Rex formations in Section 13 from Pengrowth acquired the Lindbergh lease from Murphy Canada in April, 2004 All CSS wells have been abandoned Two pilot well pairs are on the western edge of the CSS area Steam circulation commenced Feb 2012 Commercial 12,500 bpd commissioned Q Bitumen production from 20 new well pairs and 2 original pilot well pairs Pilot plant mothballed for future use Phase 1 Optimization commissioned Q Q Bitumen production from 10 new well pairs and 2 infill wells. 6
7 CSS IMPACT ON FUTURE DEVELOPMENT IN SEC 13 Murphy produced a total of 2.3 MMbbls of oil and 7.6 MMbbls of water with 8.2 MMbbls (CWE) steam injection 71 vertical wells and 3 horizontal wells used in CSS operations The average recovery factor for the CSS area is 5-6% of the OOIP (up to 10% in various wells) CSS injection operations were at pressures over 10 MPa with injection at various depths within the target formation Pengrowth received D78 Category 2 Amendment Approval to install 2 additional horizontal well pairs on well pad 4 to test SAGD production performance in the CSS impacted area. Well drilled in 2017 and placed on circulation in September. Potential impacts of the CSS operations are: Channeling of steam, breakthrough to bottom water, increased SOR with decreased recovery, increased water production from residual CSS steam condensate 7
8 LINDBERGH APPLICATION HISTORY OPERATOR DATE EVENT May 1991 ERCB Scheme Approval 6410 granted Aug 1993 ERCB Amended Scheme Approval 6410B granted Murphy Dec 1996 ERCB Amended Scheme Approval 6410C granted Aug 1997 ERCB Amended Scheme Approval 6410D granted Jun 1999 ERCB Amended Scheme Approval 6410E granted Apr 2004 ERCB Amended Scheme Approval 6410F granted Pengrowth July 2011 Scheme Amended H SAGD Pilot Project granted Aug 2012 Scheme Amended I Expansion to 12,500 bopd granted Apr 2014 Scheme Amended J Solvent Soak Trial granted 8
9 LINDBERGH APPLICATION HISTORY (CONTINUED) OPERATOR DATE TYPE DESCRIPTION Pengrowth Dec 2014 Sep 2016 Nov 2016 May 2017 June 2017 D56 Sales & Diluent PL Application (PLA#141430, C&R# ) Scheme Amended 6410M Scheme Amended 6410N Scheme Amended 6410O Scheme Amended 6410P Tie-in to Husky PL infrastructure - granted 30,000 bopd granted Infill Wells granted Legacy well remediation schedule granted 40,000 bopd granted 9

10 SAGD RECOVERY PROCESS Stacked horizontal wells Steam injected into top well and forms steam chamber Steam condenses on boundary of chamber and releases heat into the bitumen Bitumen and condensed water drain by gravity to the bottom well Bottom well produces liquid bitumen to surface 10
11 GEOLOGY AND GEOSCIENCE 11


12 2016 & 2017 DRILLING Lindbergh Lease 2 Observation wells drilled in 2017 at Lindbergh No wells drilled at Muriel Lake 26 delineation wells planned for 2018 Project Development Area Muriel Lease Existing Drilling 2017 Drilling 2018 planned Drilling 12
13 BITUMEN VOLUMES & RESERVOIR PROPERTIES All values shown for S w, Φ and bitumen volume are measured from the Petrel geological model which was recently updated Boundaries defining the area and the top and bottom surfaces of the reservoir are used to confine the volume calculation Bitumen volume extends below well pairs to the 10 ohm.m resistivity level S w, Φ are averages for the volume shown Average horizontal permeability = 3500 md: Kv / Kh = 0.86 Viscosity of the bitumen decreases upwards through the reservoir from approximately 600,000 cp at the base to 50,000 cp near the top Mean reservoir thickness over entire lease is 16.7 m. This includes all areas having a minimum thickness of 10 meters Initial reservoir temperature = 20 Celsius, initial reservoir pressure kpa Reservoir pressure in bottom water interval = 2850 kpa Reservoir depth ~ 500 mkb Region OBIP Volume (E3m 3 ) Porosity (%) Sw (%) Wellpad D01 1, Wellpad D02 2, Wellpad D03 2, Wellpad D04 4, Wellpad D05 3,

14 Exploitable Interval 1AA/ W4 REPRESENTATIVE COMPOSITE WELL LOG Average Pay Thickness = 20m Average Producer to Injector Spacing = 5 m Average O/W to Producer Distance = 3 m Cap Rock Top Lloydminster Fm Reservoir / AA/02-2 1AA/ AA/ AA/ /15-2 Injector 1AA/ AA/12-24 Well Location Map 1AA/ /10-100/12-24 Producer 1AA/ /08-23 Oil/Water Contact Defined at 10 Ωm Producer Injector 100/06-24 Producer Injector / / AA/ AA/ /02-24 Estimated Top Cummings Fm 1AA/ / / AA/ / AA/ / / / / / / / / / AA/ / / / / /15 106/ / / / / / / AE/ AF/ /10 1AB/ AG/ AE/ AD/ AA/ AA/ AG/06-131AH/ /07-1 1AB/ AF/06-131AE/ AA/ / AA/ / AB/06-131AD/ / / /01-14

15 NET BITUMEN PAY 15


16 STRUCTURAL TOP AND BOTTOM OF BITUMEN RESERVOIR 16
17 CORED WELLS AND SPECIAL CORE ANALYSIS Core analysis typically consists of the following: Dean-Stark 1762 samples Small plug Φ, K, Sw, samples Grain size 39 wells sampled Petrographic, XRD 50 samples from 15 wells Special core analysis 140 samples from 20 wells Lindbergh Lease 17


18 TYPICAL LINDBERGH CORE SAMPLE Lloydminster sands are continuous and contain rare shale interbeds Typically the reservoir is composed of very fine grained sands throughout the interval 1AA/ W m m Top of Lloydminster 18
 The clay fraction is less than 10% of the bulk sample Grain sizes range from coarse silt to lower medium grained sand Critical velocity testing indicates that clays remain")
19 PETROGRAPHIC ANALYSIS Some Petrographic analysis has been done on core samples in the Lloydminster Reservoir Sands are typically classified as Feldspathic Litharenite to Sublitharenite on the Folk scale (Folk, 1974) The clay fraction is less than 10% of the bulk sample Grain sizes range from coarse silt to lower medium grained sand Critical velocity testing indicates that clays remain non-mobile during steam injection. The clays will not block pore throats 19

20 REPRESENTATIVE CROSS SECTION THROUGH PROJECT AREA 20 TSX:PGF NYSE:PGH
 surface LWD measurements indicated OWC rising to the north Needed to directionally control drilling to maintain offset from")
21 REPRESENTATIVE MODEL CROSS SECTION THROUGH PROJECT AREA Producer planned to land 3 m above highest point on oil/water contact (OWC) surface LWD measurements indicated OWC rising to the north Needed to directionally control drilling to maintain offset from OWC 21
22 Observation 7 (September 2014) WP02 WP01 Observation 6 (February 2014) WP02 WP01 HEAVE MONUMENTS Baseline readings were taken in March 2012 Most recent observations were taken in February and September of 2014 Based on current analysis we do not anticipate additional monitoring within the next year Control Control Point Differences vs Observation 1 N(m) E(m) Elev(m) Heave Monitoring Map Lindbergh Pilot Project Primary Formation User name Lloy dminster douglask Scale Date 1: /25/2012 Contour inc Signature m 1:7500 In Situ Oil Development and Operations

23 CAPROCK INTEGRITY AND RESERVOIR OPERATING PRESSURE Mini-frac testing was done on the 1AB/ W4 (March 2011), 100/ W4 (December 2011), and 1AF/ W4 (March 2014) All showed comparable results Approved maximum ongoing operating pressure = 5500 kpa, less than 80% of minimum stress in caprock at reservoir depth Caprock Shale Core Preservation on 1AF/ W4 in March 2014 shows several fractures PENGROWTH 1AF/ W4 Fracture No. Formation Fracture Type Depth (m) Dip (Degrees) F1 GP Small fracture F2 GP Small Fracture F3 GP Small Fracture F4 GP Hairline fracture

24 3D SEISMIC DATA COVERAGE 102 sq km of 3D data exist over most of the Lindbergh and Muriel Lake leases with exploitable resource 2014 Seismic Acquisition New 4D 1.32 sq km monitor acquired Q over D01 wellpad. 4D Seismic Dataset Existing Seismic Dataset 24
25 4D SEISMIC 1.32 sq km Baseline Survey acquired Feb 2012 Source, dynamite m Source line interval (E-W) 90m Receiver line interval (N-S) 75m Source and receiver interval 24m Analog geophones 6 over 8m 1.32 sq km Monitor Survey acquired Dec 2013 Same acquisition parameters as baseline survey 1.32 sq km Monitor Survey acquired Dec 2016 Single 3C sensors used. All other acquisition parameters remained the same D05 D01 25

 low high D01 D01")
26 4D SEISMIC TIME DELAY DIFFERENCE MAPS DERIVED FROM LLOYD BASE REFLECTOR SHOWS STEAM CHAMBER DEVELOPMENT Time Delay Difference 2013 Monitor - Baseline Time Delay Difference 2016 Monitor - Baseline Time Delay (ms) low high D01 D01 26
27 DRILLING AND COMPLETIONS 27

28 COMMERCIAL DRILLING & COMPLETIONS Ten new well pairs drilled and completed in 2017 Nine well pairs on new D04 Pad One well pair on existing D01 Pad WDW05 CPF Pad D03 Two single infill wells drilled and completed on existing D01 Pad Artificial lift installed in one new well pair and two new infill wells in 2017 Pad D02 Infill well ESP s installed in July 2017 Pad D04 D01-03 ESP installed in September 2017 Pad D01 Pad D05 28
29 TYPICAL CIRCULATION COMPLETION Surface Casing mm (13 3/8 ) Slotting details Injector mm (7 ) Slotted Liner Producer mm (7 ) Wire Wrapped Screen Intermediate Casing mm (9 5/8 ) Short string 88.9 mm (3 1/2 ) Long string 88.9 mm (3 1/2 ) Fiber Coil to the Toe 31.8 mm coil tubing 29
30 LINER DESIGN The relatively small grain size, the presence of fines in the reservoir and combined laboratory flow testing indicated a liner slot width of would be required This small slot width can lead to quality control problems in the manufacturing process The presence of fines with the small slot widths increased the potential for slot plugging Therefore, Pengrowth chose to utilize wire wrap screens with a wrap for the producer well liners This increased the open flow area from about 2.5% to over 9% Straight cut slots were utilized in the injector wells 30
31 LINER DESIGN Pilot wells utilize mm slotted liners in the injector wells and mm wire wrap screens in the producer wells Phase 1 Commercial wells utilize mm slotted liners in the injector wells and mm wire wrap screens in the producer wells Both Pilot and Phase 1 Commercial well pairs are completed with the same slot and wire wrap screen design Wellbore was downsized from the Pilot to the Phase 1 Commercial wells to optimize drilling costs and complexity as the larger liners were not required for forecast flow rates Inflow control devices Liner deployed systems have been installed in five producer wells (D05-P08, D03-P01, D04-P06, D04-P07, D04-P08) across the field to test the performance in variable pay thicknesses, with bottom water interaction and overall steam chamber conformance Application of the first ICD system installed in well D05-P08 (started-up in 2015) has been deemed a success as this has been one of the highest performing well pairs across the field Metrics that PGF is using to measure success is produced emulsion rates, overall well pair operation (steam injection rates and ESP stability), subcool control and inflow characteristics based on downhole temperature data 31
32 TYPICAL ARTIFICIAL LIFT COMPLETION Surface Casing mm (13 3/8 ) Intermediate Casing mm (9 5/8 ) Slotting details Producer mm (7 ) Wire Wrapped Screen Typical scab Liner installation includes single or multiple ported subs Production Tubing 88.9 mm (3 1/2 ) ESP Scab Liner mm (4 1/2 ) Guide String 60.3 mm (2 3/8 ) or 48.3 mm (1.9 ) Fiber Coil to the Toe 31.8 mm coil tubing 32
33 COMPLETION CHANGES Scab liners Initially installed in the producers based on shut-in temperature profiles across the lateral, drill profiles of the injector and producer and steam splitter locations in the injectors Typical target landing depth is approximately 75-80% of the lateral length to aid in toe development early in SAGD production and mitigate flow breakthrough at the heel; learnings include two ported subs for optimal pressure drop and drawdown along the lateral Mechanical perforation of scab liner Performed concurrently with pump changes where applicable Opens flow to selected intervals along the scab liner Wells and corresponding perforation intervals selected based on fall off temperature response; typically targeting areas of high subcool that would indicate cooler stranded emulsion Producers that show signs of being very hot (near saturated temperature during fall off) are typically not candidates for scab liner modifications All Lindbergh well pairs are continually being monitored and analyzed for possible scab liner modifications to optimize production and reservoir conformance Reduces the risks and cost associated with pulling and/or modifying the scab liner No scab liners have been repositioned in the commercial well pairs to date 33
34 INJECTOR COMPLETION CHANGES Well Name Well Type UWI D02-J04 D02-J06 D02-J07 D03-J03 D03-J04 D03-J05 D03-J06 D03-J07 D04-J01 D04-J02 D04-J03 D04-J04 D04-J05 D04-J06 D04-J07 D04-J08 D04-J09 D05-J03 D05-J04 D05-J06 Injector Injector Injector Injector Injector Injector Injector Injector Injector Injector Injector Injector Injector Injector Injector Injector Injector Injector Injector Injector Steam Splitter(s) Installed W W W W40 1 Shifted Open Shifted Closed W40 1 Nov-15 Nov W W40 1 Nov-15 Sep W W W W W W W W W W W40 1 Nov W W40 1 Nov-15 34
35 PRODUCER COMPLETIONS CHANGES Well Name D01-P01 D01-P02 D01-P03 D01-INF01 D01-INF02 D02-P04 D02-P05 D02-P06 D02-P07 Well Type Producer Producer Producer Infill Infill Producer Producer Producer Producer UWI W W W W W42 Scab Liner Installed Y Y N N Y Production Ports Installed 0 1 Linerconveyed ICD W40 Y Scab Liner Perforated W40 Y 1 Jul W40 Y 1 Oct W40 Y 1 Well Name D04-P01 D04-P02 D04-P03 D04-P04 D04-P05 D04-P06 D04-P07 D04-P08 D04-P09 D05-P01 Well Type UWI Scab Liner Installed Production Ports Installed To be installed Producer W40 (TBI) 2 (TBI) To be installed Producer W40 (TBI) 2 (TBI) To be installed Producer W40 (TBI) 2 (TBI) To be installed Producer W40 (TBI) 2 (TBI) To be installed Producer W42 (TBI) 2 (TBI) Linerconveyed ICD Producer W40 No Liner Producer W40 No conveyed ICD Linerconveyed ICD Producer W40 No To be installed Producer W43 (TBI) 2 (TBI) Scab Liner Perforated Producer W42 Y 1 Jul-17 D02-P08 Producer W42 Y 1 Jun-16 D05-P02 Producer W40 Y 1 Jan-17 D03-P01 Producer W40 Y 1 Sep-17 D05-P03 Producer W40 Y 2 D03-P02 Producer W40 Y 1 D05-P04 Producer W40 Y 1 D03-P03 Producer W40 Y 1 D05-P05 Producer W40 Y 1 Sep-17 D03-P04 D03-P05 D03-P06 Producer Producer Producer W40 Y W40 Y 1 Jan W40 Y 1 D05-P06 D05-P07 D05-P08 Producer W40 Y 1 Dec-16 Producer W40 Y 1 Apr-16 Linerconveyed Producer W40 N ICD D03-P07 Producer W40 Y 1 Jul-16 35
36 COMMERCIAL ARTIFICIAL LIFT Required to convert from circulation to typical SAGD operations All wells utilize high temperature ESP s Vendor and pump type selected based on expected well performance, target landing locations and historical run life Pumps rated to 260 C Pumps designed to handle full flow rate range from initial install through ramp up to peak emulsion rates Vapour interference in the pump has been higher than anticipated in certain cases Mitigating operational problems due to higher vapour loading through the use of AGH stages and completion modifications Continuing to work closely with ESP vendors to improve performance and run time Run time improvement due to decreased start/stops as a result of improved plant reliability Technological improvements and advancements Higher temperature motors Improved seal systems Improved bearing design Shorter design resulting in less stress running in severe doglegs 36
37 DRILLING SCHEDULE New drilling subject to market conditions, internal approval and regulatory approval where applicable. Future considerations pending internal approval Drilling of 8 infill wells on Pad D05 in
38 INSTRUMENTATION 38
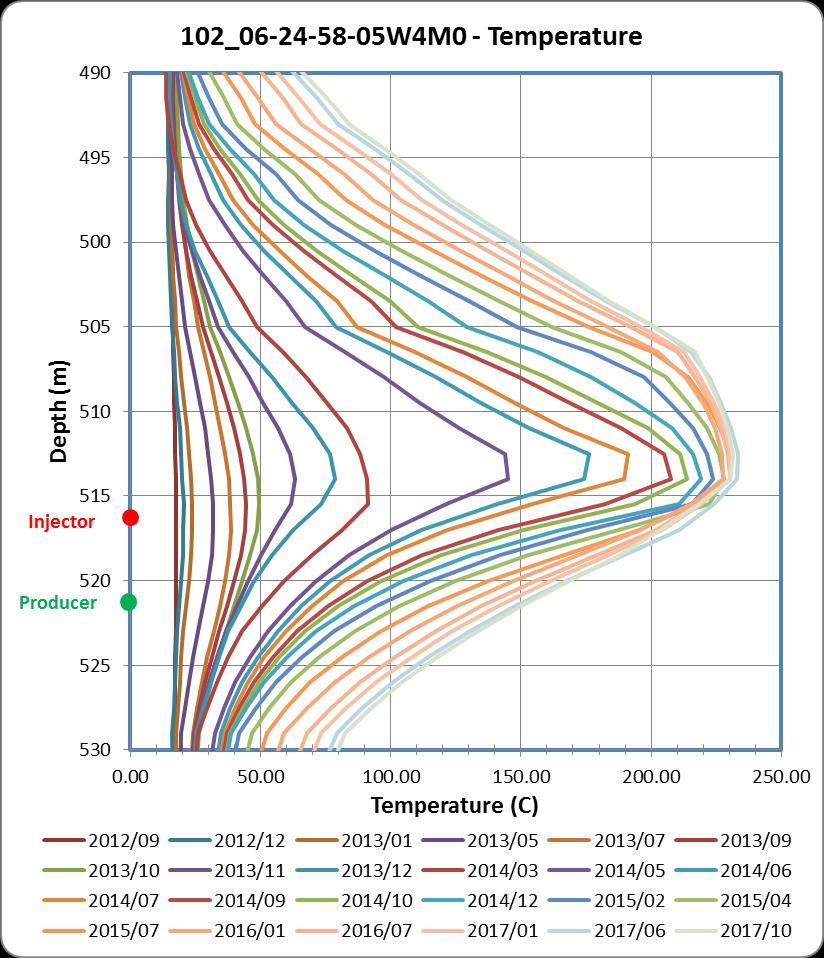
39 SAGD WELL PAIR INSTRUMENTATION Single point pressure measurement is taken at the heel of both the injector and producer via bubble tube Methane is injected in the casing of the injector and in the guide string annulus of the producer to provide a reading at surface via a pressure transmitter Gas gradient calculations are accounted for in the pressure reading Purging of the bubble tubes is completed on an as needed basis to limit the overall volume of gas being injected Differential pressure is monitored between the injector and producer to provide insight into the accuracy of the pressure reading and subsequent purge timing Producer bubble tubes are purged more frequently than injector bubble tubes due to the guide string annular volume and potential for plugging Fiber optic DTS (distributed temperature sensors) are run in all of the producer wells to provide real-time temperature data along the entire wellbore 39
40 OBSERVATION LOCATIONS/ TYPICAL COMPLETION Observation wells RTD combos 3 Sensor units Temp/Press BG W Overburden Caprock Temperature string 30 Thermocouples Lloydminster Formation Lloydminster OWC Underburden 40
41 OBSERVATION LOCATIONS/ TYPICAL COMPLETION Downhole pressure/temperature gauge reliability has been good overall As the thermocouple and pressure monitoring equipment is cemented on the backside of the casing, remediation of any failed downhole equipment is challenging Pengrowth therefore runs multiple temperature and pressure points if this is encountered Surface equipment reliability has been an issue at times as all observation well locations rely on solar panels/battery combos for power Line of sight is also required for the Commercial observation wells to transmit data Pengrowth is continuing to work with the vendors on increasing the number of solar panels and battery capacity on location; especially important in winter months Data transmission accuracy is also being rectified between Pengrowth and the instrumentation vendors on an as needed basis Site Engineers check locations monthly 41
42 SCHEME PERFORMANCE 42
43 PREDICTING SAGD PERFORMANCE SAGD well production type curves are created using historical production data on the pilot and phase 1 wells. Butler s equation is used to modify each type curve based on the geological data available. Infill wells are forecasted based on the production forecast of the parent well 43
44 Fluid Rates (m3/d or T/d) SOR LINDBERGH PERFORMANCE Lindbergh Monthly Overview Reduced volumes due to a 10 day plant maintenance shut-down in September Daily Average Oil (m3/d) Pilot Wellpairs Oil (m3/d) Daily Average Steam (T/d) Daily Average Water (m3/d) Inst Steam/Oil Ratio Cum Steam/Oil Ratio 44

45 LINDBERGH PERFORMANCE Reduced volumes due to a 10 day plant maintenance shut-down in September
46 Cumulative Volume (m3 or T) CUMULATIVE VOLUMES 6,500,000 6,000,000 5,500,000 5,000,000 4,500,000 6,500,000 6,000,000 5,500,000 5,000,000 4,500,000 4,000,000 3,500,000 3,000,000 2,500,000 2,000,000 1,500,000 1,000, , ,000,000 3,500,000 3,000,000 2,500,000 2,000,000 1,500,000 1,000, ,000 0 Lindbergh Steam Lindbergh Water Lindbergh Oil Pilot WP's Oil 46
47 PAD RECOVERIES OBIP - Recovery and % recovery by pad Thickness Length Spacing Ave ɸ Area Ave So OBIP Recovery Recovery Pad (m) (m) (m) (%) (Ha) (%) (e3m3) (e3m3) (%) D D D D D Developed BIP - Recovery and % recovery by pad Thickness Length Spacing Ave ɸ Ave So DBIP Recovery Recovery EUR Pad (m) (m) (m) (%) (%) (e3m3) (e3m3) (%) (%) D D D D D Length is average slotted length plus 25 meters per end (50 m total) Recovery to Oct D01 numbers include a new well pair and two new infill wells 47
48 Recovery (%) LINDBERGH DEVELOPED RECOVERY 75% 70% 65% 60% 55% 50% 45% 40% 35% 30% 25% 20% 15% 10% 5% 0% D01 D02 D03 D05 48
49 Fluid Rates (m3/d or T/d) SOR PHASE 1 HIGH PERFORMER 350 D05-01 Overview Reduced volumes due to a 10 day plant maintenance shut-down in September Allocated Daily Steam (T/d) Allocated Daily Oil (m3/d) Allocated Daily Water (m3/d) Inst Steam/Oil Ratio Cum Steam/Oil Ratio 49
50 Fluid Rates (m3/d or T/d) SOR PHASE 1 MEDIUM PERFORMER 350 D03-07 Overview Reduced volumes due to a 10 day plant maintenance shut-down in September Allocated Daily Steam (T/d) Allocated Daily Oil (m3/d) Allocated Daily Water (m3/d) Inst Steam/Oil Ratio Cum Steam/Oil Ratio 50
51 Fluid Rates (m3/d or T/d) SOR PHASE 1 POOR PERFORMER 350 D02-05 Overview Reduced volumes due to a 10 day plant maintenance shut-down in September Allocated Daily Steam (T/d) Allocated Daily Oil (m3/d) Allocated Daily Water (m3/d) Inst Steam/Oil Ratio Cum Steam/Oil Ratio 51
52 Cumulative Water/Steam Ratio CUMULATIVE WATER/STEAM RATIO Increasing water to steam ratio caused by reduced steam usage during drilling of infill wells on Pad D01. Also increased water production without associated steam usage when the infills came on production Pad D01 Pad D02 Pad D03 Pad D05 Lindbergh 52

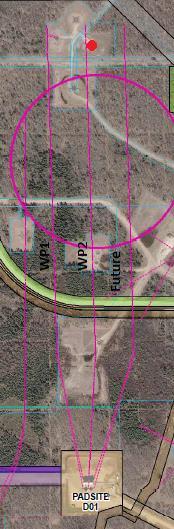
53 D01-02 OBSERVATION WELL EXAMPLE ~11 m offsetting WP2 53

54 INJECTOR BOTTOM HOLE PRESSURE 54
55 Steam/Oil Ratio LINDBERGH CSOR AND ISOR Lindbergh CSOR Lindbergh ISOR D01 CSOR D01 ISOR D02 CSOR D02 ISOR D03 CSOR D03 ISOR D05 CSOR D05 ISOR 55
56 WELLHEAD STEAM QUALITY Current steam quality injected at the well pad is ~98% Close proximity to CPF 56
57 PAD ABANDONMENTS 5 YEAR OUTLOOK No abandonments of SAGD wells or well pads are expected in the next 5 years 57
58 KEY LEARNINGS Pilot infill wells outperforming expectations Learnings will be incorporated into future infill well plans Successful drilling and circulation of 2 SAGD well pairs in previously depleted cyclic steam stimulation area. Significant de-risking of reserves Reduced steam chamber operating pressure Managing steam chamber pressure slightly above bottom water pressure to optimize SOR Well bore hydraulics optimization Production ports in the scab liner and shiftable ports in the steam injection string improve well conformance Scab liner perforating (select cases) has proven beneficial during pump changes to improve wellbore conformance, pump operation and well KPI s Liner deployed flow control devices showing encouraging results Continuous improvement in ESP run life Advanced gas handling stages improving performance in wells with high vapour production 58
59 FUTURE PLANS - SUBSURFACE 59
60 FUTURE PLANS - SUBSURFACE Future considerations pending internal approval Drilling of 8 infill wells on Pad D05 in 2018 Future considerations pending regulatory approval Commence non-condensable gas co-injection with steam Application to be submitted in Q
61 FACILITIES 61
62 LINDBERGH SAGD COMMERCIAL FACILITY SW W4M CPF site Original daily design capacity 8000 m3/d (50,000 bwpd) CWE for steam generation 2208 m3/d (13,888 bopd) bitumen production SOR 3.61 Debottlenecked daily design capacity 8000 m3/d (50,000 bwpd) CWE for steam generation 3180 m3/d (20,000 bopd) bitumen production SOR 2.5 Commercial facility equipped with water recycle Falling film mechanical Vapour compression >90% water recycle rate Qualified and experienced SAGD operations team Commercial facility first steam December

63 LINDBERGH COMMERCIAL CPF PLOT PLAN 63
64 LINDBERGH COMMERCIAL TYPICAL WELLPAD PLOT PLAN D02 5 pairs D03 7 pairs D05 8 pairs D04 6 pairs 64
65 LINDBERGH SCHEMATIC 65
66 LINDBERGH SAGD COMMERCIAL FACILITY MODIFICATIONS Replacement of welded block style PG/BFW inlet HEX Shell & tube HEX installed Replacement of Gasketed plate & frame style clean oil HEX Shell & tube HEX installed Addition of future tie in piping and valves within the CPF To allow for Phase 2 construction without a Phase 1 shutdown WELL PAD EXPANSIONS Added one well pair, two infills and a test separator package to well pad D01 Constructed new well pad D04 with 6 well pairs in 2017; 3 planned for
67 LINDBERGH SAGD COMMERCIAL FACILITY PERFORMANCE September 2017 outage for Lindbergh Turnaround to complete the required regulatory inspections on vessels & PSVs and to establish baseline inspections on tanks, piping and rotating equipment Design Debottleneck bitumen design rates not expected to be reached with current wellpairs Water/Steam rates still ramping up as the field matures Bitumen treatment Producing on spec oil with use of lighter density diluent from pipeline Water treatment Increased hardness in the produced water causing more frequent regenerations of the softeners Continual chemical treatment balancing in the evaporators to chelate any excess hardness and chemically cleaning the concentrator every 6 to 8 weeks Oxygen content in softened make-up water causing internal corrosion in utility system piping; UT testing and chemical treatment continues 67
68 LINDBERGH SAGD COMMERCIAL FACILITY PERFORMANCE Steam generation Continuing to ramp up to full capacity Power Generation steady outside of regular maintenance Import/Export vary due to weather Plant is islanded during thunderstorms High line power is affected by thunderstorms, ice, human factors Consumption increasing as loading on facility ramps up 68
69 LINDBERGH POWER CONSUMPTION Lindbergh Commercial Lindbergh River Station Generation Consumption Import Export Import/Consumption MWh MWh MWh MWh MWh Jan Feb Mar Apr May Jun Jul Aug Sep Oct Nov Dec Jan Feb Mar Apr May Jun Jul Aug Sep
70 Sour Gas Vented (e3m3) Sour Gas Flared (e3m3) LINDBERGH FLARED & VENTED GAS Planned Lindbergh Turnaround; shutdown, purge and startup Boiler Trip VRU motor failure Field PG kick & planned VRU maintenance Field PG kick & planned tank maintenance Boiler Trip x 2 & fuel gas coalescer Oct-16 Nov-16 Dec-16 Jan-17 Feb-17 Mar-17 Apr-17 May-17 Jun-17 Jul-17 Aug-17 Sep Aftercondenser high O2 content Evaporator trip VRU overloaded during vessel maintenance Evaporator vent condenser trip Oct-16 Nov-16 Dec-16 Jan-17 Feb-17 Mar-17 Apr-17 May-17 Jun-17 Jul-17 Aug-17 Sep-17 70
71 LINDBERGH SULPHUR EMISSIONS Commercial Monthly Sulphur Total SO2 Flare Stack Steam Gens Peak Day Approved Limit t/month t/month t/month t/d t/d Jan Feb Mar Apr May Jun Jul Aug Sep Oct Nov Dec Jan Feb Mar Apr May Jun Jul Aug Sep Simulations based on historical pilot data do not indicate we will exceed our currently approved limit with the current production forecast of Phase 1 Considerations will be given to the incorporation of sulphur recovery for future Phase 2 expansion 71
72 LINDBERGH NO X EMISSIONS CEMS Data - Monthly Average - H-720 NOx (kg/h) Jan Feb Mar Apr May Jun Jul Aug Sep Oct Nov Dec Jan Feb Mar Apr May Jun Jul Aug Sep Manual Stack Surveys 2017 Manual Stack Surveys NOx Emission NOx Emission Date Rate (kg/hr) Date Rate (kg/hr) Emission Source H-710 (Steam Gen 1) Apr H-720 (Steam Gen 2) 20-Sep Apr H-730 (Cogen 1) 21-Sep H-740 (Cogen 2) Aug H-942 (Utility Boiler) NOx Approval Limit (kg/hr) Commercial stack survey dictated as one manual stack survey within 6 months of commissioning for each source, once per year on a rotating basis for H-710 & H-720, once per year on a rotating basis for H-730 & H- 740, and continuous monitoring via CEM for one of H-710 & H
73 MEASUREMENT AND REPORTING 73
74 MARP SUMMARY Testing Test separator located at D02, D03, D04, and D05 Pad D01 Test Separator installed and commissioned June hour tests Within +/- 10% of previous results to be accepted Individual well gas allocated as a function of facility GOR and monthly allocated production Pad D03 utilizing AGAR Meter. Pad D01, D02, D04, and D05 utilizing manual testing. 2 samples captured per test to improve accuracy. Pad D01, D02, and D05 to be converted to AGAR meter in Q Pad D04 to be converted to AGAR meter in Q after all wells have reached steady state SAGD production. 74

75 PRORATION FACTOR Oil Water Steam
76 PRORATION IMPROVEMENT INITIATIVES Main issues associated with BS&W consistency Completed Testing procedure (Sept 2015) Chemical adjustments (Sept 2015) Various piping changes for more accurate testing ( ) Pad D02, D03, D05 AGAR Calibrations ( ) Ongoing Pad D01 AGAR (New) calibration (Q1 2018) Pad D04 AGAR (New) calibration (Q4 2018) Pad D05 AGAR re-calibration testing(q1 2018) Pad D03 AGAR re-calibration testing(q1 2018) Pad D02 AGAR re-calibration testing(q1 2018) 76

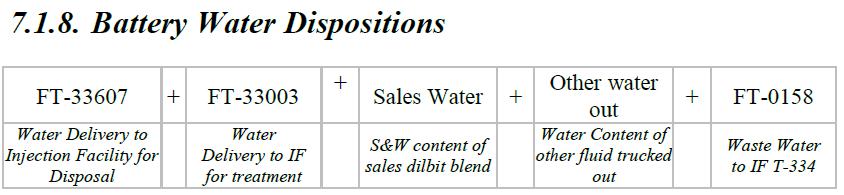
77 COMMERCIAL MARP SCHEMATIC SAGD Production - BT SAGD Injection - IF Disposal -IF


78 MARP CALCULATION SUMMARY 78
79 WATER 79
80 LINDBERGH WATER SOURCES W4M river water station Fresh water source from the North Saskatchewan River AENV License No.13844»Gross diversion, consumptive use: 2,272 acre-feet (2,802,467m3) annually»rate of diversion: 1.8 cubic feet per second (4403m3/d or 1,607,400m3 annually) Commercial ~400m3/d make-up water usage at commercial facility (2017 to date average) Down slightly from 2016 yearly average of 512m3/d A higher water steam ratio in 2017 lowered the source water makeup to the evaporators as the evaporator feed stream is produced water supplemented with source water to meet total boiler feed water requirements 80
81 LINDBERGH SOURCE WATER MAKE UP VOLUMES Commercial volumes used primarily for soft de-oiled water make-up and miscellaneous utility services Source Water (m3 per month) Jan-16 16,398 Feb-16 12,687 Mar-16 18,595 Apr-16 20,598 May-16 13,409 Jun-16 16,184 Jul-16 17,678 Aug-16 15,914 Sep-16 13,943 Oct-16 14,022 Nov-16 16,612 Dec-16 10,996 Jan-17 9,105 Feb-17 11,157 Mar-17 15,486 Apr-17 14,992 May-17 6,762 Jun-17 8,042 Jul-17 12,733 Aug-17 17,342 Sep-17 8, Total: 187,036m3 6.7% of gross diversion license 11.6% of rate of diversion license 2017 YTD: 104,203m3 Lindbergh source water requirements are expected to increase in 2018 when the pilot facility is reactivated. 81
82 LINDBERGH PRODUCED WATER, STEAM, AND RECYCLE Commercial facility has full blowdown recycle Steam (tonnes/month) Produced Water (m3/month) Disposal Water (m3/month) PW Recycle (monthly) Jan , ,927 4, % Feb , ,975 4, % Mar , ,059 5, % Apr , ,900 5, % May , ,521 5, % Jun , ,111 5, % Jul , ,198 5, % Aug , ,609 5, % Sep , ,374 5, % Oct , ,593 7, % Nov , ,470 6, % Dec , ,810 6, % Jan , ,709 7, % Feb , ,819 6, % Mar , ,768 6, % Apr , ,678 6, % May , ,804 7, % Jun , ,660 12, % Jul , ,990 7, % Aug , ,497 8, % Sep , ,110 9, % PW Recycle Rate Calculation as per Directive 81 Appendix H 2016 Overall 96.7% 2017 YTD 95.6% 82
83 LINDBERGH COMMERCIAL DISPOSAL LIMITS The Lindbergh CPF is equipped with evaporator towers for PW recycle Disposal Limit % (monthly) Actual Disposal % (monthly) Jan % 2.7% Feb % 3.1% Mar % 2.7% Apr % 2.8% May % 2.8% Jun % 3.1% Jul % 2.8% Aug % 2.9% Sep % 3.2% Oct % 3.5% Nov % 3.2% Dec % 3.1% Jan % 3.6% Feb % 3.4% Mar % 3.3% Apr % 3.4% May % 3.7% Jun % 6.6% Jul % 3.7% Aug % 3.9% Sep % 6.6% Disposal Limit and Actual Disposal calculated as per Directive Overall: Limit: 9.4% Actual: 2.9% 2017 (YTD): Limit: 9.6% Actual: 4.3% The higher actuals in 2017 are attributed to excess produced water from the reservoir, increase in regen frequency from the softeners and one-time disposal volumes associated with the turnaround 83

84 LINDBERGH WATER QUALITY Raw Water Properties Produced Water Properties SAC Waste Properties 84
85 DISPOSAL WELLS 85
86 DISPOSAL WELLS 111/ W4 Well license number Disposal approval number 5565 Completed in Basal Cambrian Sands No rate limit Max WHP 10.9 MPa Former blowdown disposal for Pilot 104/ W4 (DW4) Well license number Disposal approval number Completed in Basal Cambrian Sands No rate limit Max WHP 13 MPa Produced water disposal (if required) 100/ W4 (DW5) Well license number Disposal approval number 12088B Completed in Basal Cambrian Sands Screened completion No rate limit Max WHP 12.6 MPa SAC regen and/or produced water disposal (if required) 86

87 DISPOSAL WELLS Three water disposal wells (Basal Cambrian Sand) at ~ 1600 meters depth 11/15-13 and 04/05-13 were disposing of produced water and boiler blowdown from the pilot Pilot was shut down in Q2, 2015 and all volumes processed at new CPF 00/08-26 is new well that was completed in November 2014 All 3 wells are tied into the commercial CPF 2 disposal streams into these wells are softener regeneration backwash and excess produced water 100/ W4 (DW5) 104/ W4 (DW4) 111/ W4 87
88 DISPOSAL HISTORY Disposal well clean-out conducted Excess produced water disposed temporarily for plant upsets/following TAR 88

89 OFFSITE DISPOSAL VOLUMES AND LOCATIONS YTD
90 AMBIENT AIR QUALITY 90
91 AMBIENT AIR QUALITY Continue to actively participate in LICA and the Air Quality Monitoring Program Network as per the Lindbergh SAGD EPEA approval We are compliant with the Joint Oilsands Monitoring (JOSM) requirements 91
92 ENVIRONMENTAL ISSUES 92
93 ENVIRONMENTAL ISSUES ENVIRONMENTAL ISSUES - Three sites have undergone additional assessment work in 2016/17 (including a former Landfill area at W4M). No remediation was required. - Reclamation has been carried out on AG/ W4M, AH/ W4M, AA/ W4M, AF/ W4M, AE/ W4M and final re-contouring and soils replacement for Pad 5031 and a borrow pit area at 1-13, and 112/ W4M ( W4M). - Reclamation (site recontouring) has taken place at AG/ W4M on Pad I - Pad F, Pad 5729 and 112/ W4M well site have been reclaimed. 93

94 DECOMMISSIONING AND RECLAMATION The 5 year reclamation of legacy CSS facilities has been completed. The project is in the early stages of development and as such no current facilities are schedules for decommissioning at this time. 94
95 COMPLIANCE 95
96 COMPLIANCE The AER issued an investigation due to CEMS deficiencies. Pengrowth submitted information requested by the investigation Sept 8/16. The CEMS is now compliant with all applicable regulations. Pengrowth believes that the Lindbergh project is in full compliance with AER regulatory approvals and regulatory requirements 96
97 FUTURE PLANS 97
98 FUTURE PLANS Infill wells to be drilled on pad D05 Temporary power to be installed on the CPF The Pilot Facilities will be reenergized and incorporated in the currently operation facilities. Pending regulatory approval and corporate sanctioning Surface facilities and additional well pads for project expansion to 40,000 bopd timing TBD 98
99 Pengrowth Energy Corporation BUILDING 2100, rd Calgary, Alberta, Avenue Canada SW T2P 0B4 SUSTAINABLE Toll-free: CASH FLOW investorrelations@pengrowth.com Telephone: Toll Free: Facsimile: Corporate Presentation Investor Relations Website: January,