PRELIMINARY NOISE IMPACT ANALYSIS REPORT
|
|
|
- Francine Hardy
- 5 years ago
- Views:
Transcription

1 PRELIMINARY NOISE IMPACT ANALYSIS REPORT Reconstruction and Widening of the Pennsylvania Turnpike (I-76) from Milepost 298 to Milepost Prepared for: Pennsylvania Turnpike Commission P.O. Box Harrisburg, Pennsylvania Prepared by: AECOM 1700 Market Street, Suite 1600 Philadelphia, PA vember 2015
2 AECOM Preliminary ise Impact Analysis Report i Table of Contents Executive Summary...ES-1 1 Introduction Methodology Modeling & Analysis Evaluation Criteria Warranted Criteria Feasibility Criteria Reasonableness Criteria ise Abatement Measures Existing Highway Traffic ise Environment (Monitored Data) Identification of ise Study Areas (NSAs) NSA 1 (see Figure 2A) NSA 2 (see Figure 2A) NSA 3 (see Figure 2B) NSA 4 (see Figure 2C) NSA 5 (see Figure 2C & 2D) NSA 6 (see Figure 2C) NSA 7 (see Figure 2E) NSA 8 (see Figure 2E) NSA 9 (see Figure 2E) Short-Term ise Monitoring Hour ise Monitoring Future Highway Traffic ise Environment (Existing and Future Calculations) Validation of ise Modeling Worst Case Calculations Existing Condition Sound Levels Future (2046) Build Condition Calculated Sound Levels Future (2046) Build Condition Calculated Sound Levels Highway Traffic ise Consideration and Mitigation Alternatives Mitigation Alternatives ise Barrier Evaluation Detailed ise Barrier Descriptions Summary of Results Construction ise Consideration and Mitigation Alternatives Public Involvement Process Bibliography... 26
3 AECOM Preliminary ise Impact Analysis Report ii List of Tables Table 1: Summary of Evaluated ise Barrier Analysis... 2 Table 2: Hourly Weighted Sound Levels db(a) for Various Land Use Activity Categories... 4 Table 3: Summary of Short-Term Measurement Results Table 4: Measured vs. Calculated Sound Levels for TNM Validation Table 5: Calculated Worst Case Existing (2013) and Future (2046) ise Levels Table 6: Summary of Evaluated ise Barriers Table 7: Future Build Sound Levels and Insertion Loss Values List of Figures Figure 1: Project Location... 2 Figure 2: Key Index - NSA & Monitoring Locations Figure 2A: NSA & Short-Term Monitoring Locations Figure 2B: NSA & Short-Term Monitoring Locations Figure 2C: NSA & Short-Term Monitoring Locations Figure 2D: NSA & Short-Term Monitoring Locations Figure 2E: NSA & Short-Term Monitoring Locations Figure 3: 24 Hour Monitoring Locations Figure 4A: 24 Hour Monitoring Results for 24_WB monitoring position Figure 4B: 24 Hour Monitoring Results for 24_EB monitoring position Figure 5: Key Index - Modeled Receptors & Evaluated Barrier Locations Figure 5A: Modeled Receptors & Evaluated Barrier Locations Figure 5B: Modeled Receptors & Evaluated Barrier Locations Figure 5C: Modeled Receptors & Evaluated Barrier Locations Figure 5D: Modeled Receptors & Evaluated Barrier Locations Figure 5E: Modeled Receptors & Evaluated Barrier Locations List of Appendices Appendix A: Pennsylvania Turnpike Commission Traffic Data Appendix B: ise Monitoring Field Sheets, Traffic Counts & Instrument Calibration Certificates Appendix C: ise Monitoring & NSA Site Locations Appendix D: 24-Hour ise Monitoring Results Appendix E: Modeled Receptors & Evaluated Barrier Locations Appendix F: ise Barrier Warranted, Feasibility and Reasonableness Worksheets Appendix G: Traffic ise Model (TNM 2.5) Files (Attached as CD-R)
4 AECOM Preliminary ise Impact Analysis Report ES-1 Executive Summary The Pennsylvania Turnpike Commission (PTC) has initiated preliminary engineering design for the roadway reconstruction and widening of the Pennsylvania Turnpike (I-76) from Milepost (MP) 298 to MP in Berks and Chester Counties, Pennsylvania. This report addresses the potential for noise impacts based on the noise analysis performed during the preliminary engineering design phase of this project. Traffic noise impact analysis and abatement measures were evaluated according to the methodology and procedures set forth by the Federal Highway Administration (FHWA) in Highway Traffic ise: Analysis and Abatement Guidance (FHWA-HEP , December 2011); and the Pennsylvania Department of Transportation (PennDOT) in the Project Level Highway Traffic ise Handbook, Publication. 24 (December 2013). This analysis has focused on all sensitive receptors and land uses within the project area of the proposed roadway design. A total of nine ise Study Areas (NSAs) were identified from west to east, with three NSAs located on the north side of the Turnpike and six NSAs located to the south of the Turnpike. ise monitoring was conducted at 14 representative sites within the project study area in September The monitoring data was used to validate computer models capable of predicting the worst case noise levels for existing and future roadway conditions. 56 modeled-only receptors were then chosen as potentially impacted receptors within each NSA. When worst case existing traffic data is applied to these receptors, noise levels are predicted to range from 54 db(a) to 75 db(a), with levels approaching or above the requisite noise abatement criteria for the specific land use at 16 sites involving five of the nine NSAs identified for this analysis. Travel volumes are expected to increase approximately 63 percent by the design year 2046 (traffic data can be referenced in Appendix A). The 2046 Build traffic noise levels throughout the project area range from 56 db(a) to 77 db(a), with an average increase of 2 db(a) over existing conditions observed. The geographic concentration of elevated noise levels is consistent with those identified in the existing worst case scenario. The existing conditions noise model was then modified to incorporate design changes to the existing roadways and changes to the surrounding topography. This revised model was used to predict design year (2046) Build traffic noise levels at all monitored sites. With the proposed improvements, 2046 Build traffic noise levels through the corridor range from 56 db(a) to 73 db(a), with an average increase of 2 db(a) over existing conditions observed. Design year build traffic noise impacts were identified within seven of the nine NSAs. Therefore, abatement consideration is warranted for NSAs 1, 3, 4, 5, 6, 7, and 9 within the project study area. traffic noise impacts were identified for NSAs 2 and 8. For NSA 2, future noise levels are predicted to reach 66 db(a). However, this is not sufficient to create an impact for the Category F gas station and car dealership located within this NSA. NSAs where no impacts were identified do not warrant abatement consideration; therefore no further analysis was performed for NSAs 2 and 8. Since noise impacts have been identified, this study included an evaluation of noise abatement. Alternative forms of abatement can be effective under certain circumstances. These include the installation of barriers or earthen berms, inclusion of traffic control measures, and modification of the alignment. Given the nature of the Turnpike through the project area, restrictions on travel speeds or truck traffic utilization to control noise would not serve the roadway s intended function and would be difficult to enforce. Therefore, this study focused on noise barriers as the only abatement consideration. Table 1 provides a summary of the noise barrier analysis outlined in this report.
5 AECOM Preliminary ise Impact Analysis Report ES-2 Based on the analysis in this report, none of the evaluated noise barriers were found to be warranted, feasible and reasonable. Due to the large area of each NSA relative to the number of receptors located within them, the length of each barrier required to provide sufficient reduction to achieve the feasibility criteria provides a squarefoot per benefitted receptor larger than that permitted by the reasonableness criteria. The proximity of many receptors to local roads is also a contributing factor to the lack of effectiveness of the barriers evaluated. Specifications for the barriers evaluated are outlined in Section 5.2.1, and Appendices E and F of this report. Table 1: Summary of Evaluated ise Barrier Analysis NSA - Barrier Number # of Impacted Receptors Warranted? # of Benefited Receptors Feasible? Barrier Length (feet) Barrier Height (feet) Barrier Sq.Ft. Sq. Ft. per Benefited Receptor Reasonable? NSA 1 Barrier ,600 14,000 - NSA NSA 3 Barrier , ,100 8,050 NSA 4 Barrier , , NSA 5 Barrier , ,700 14,700 NSA 6 Barrier ,600 19, NSA 7 Barrier * 5.20* 1, ,200 4,846 NSA NSA 9 Barrier ,800 2,800 * Fractional receptor value attributed to calculated ERU of golf course receptors in this NSA
6 AECOM Preliminary ise Impact Analysis Report 1 1 Introduction This report describes the methodology and presents the findings of the traffic noise analysis conducted by AECOM for the Pennsylvania Turnpike Commission. The project location extends from MP 298 to MP in Berks and Chester Counties, Pennsylvania (Figure 1). The western limit of the study area is approximately 0.4 miles east of the Morgantown Road crossing of I-76; the eastern limit of the study area is approximately 0.3 miles west of the Bulltown Road (SR345) crossing of I-76. The project involves the widening of the Turnpike from four to six lanes (three lanes per travel direction) and includes full depth roadway reconstruction, widening roadway bridges, and the replacement of overhead bridges, culvert extensions, drainage, stormwater management, and side road adjustments. In addition, roadway shoulders and medians will be widened. All construction for this project will follow the existing centerline of the Turnpike. This traffic noise assessment has been undertaken to determine if project-related noise impacts will occur along the roadway corridor, and determine whether noise abatement for affected areas in the form of noise barriers or other mitigation measures would be warranted, feasible, and reasonable, based upon FHWA and PennDOT criteria as utilized by the PTC.


7 AECOM Preliminary ise Impact Analysis Report 2 Figure 1: Project Location
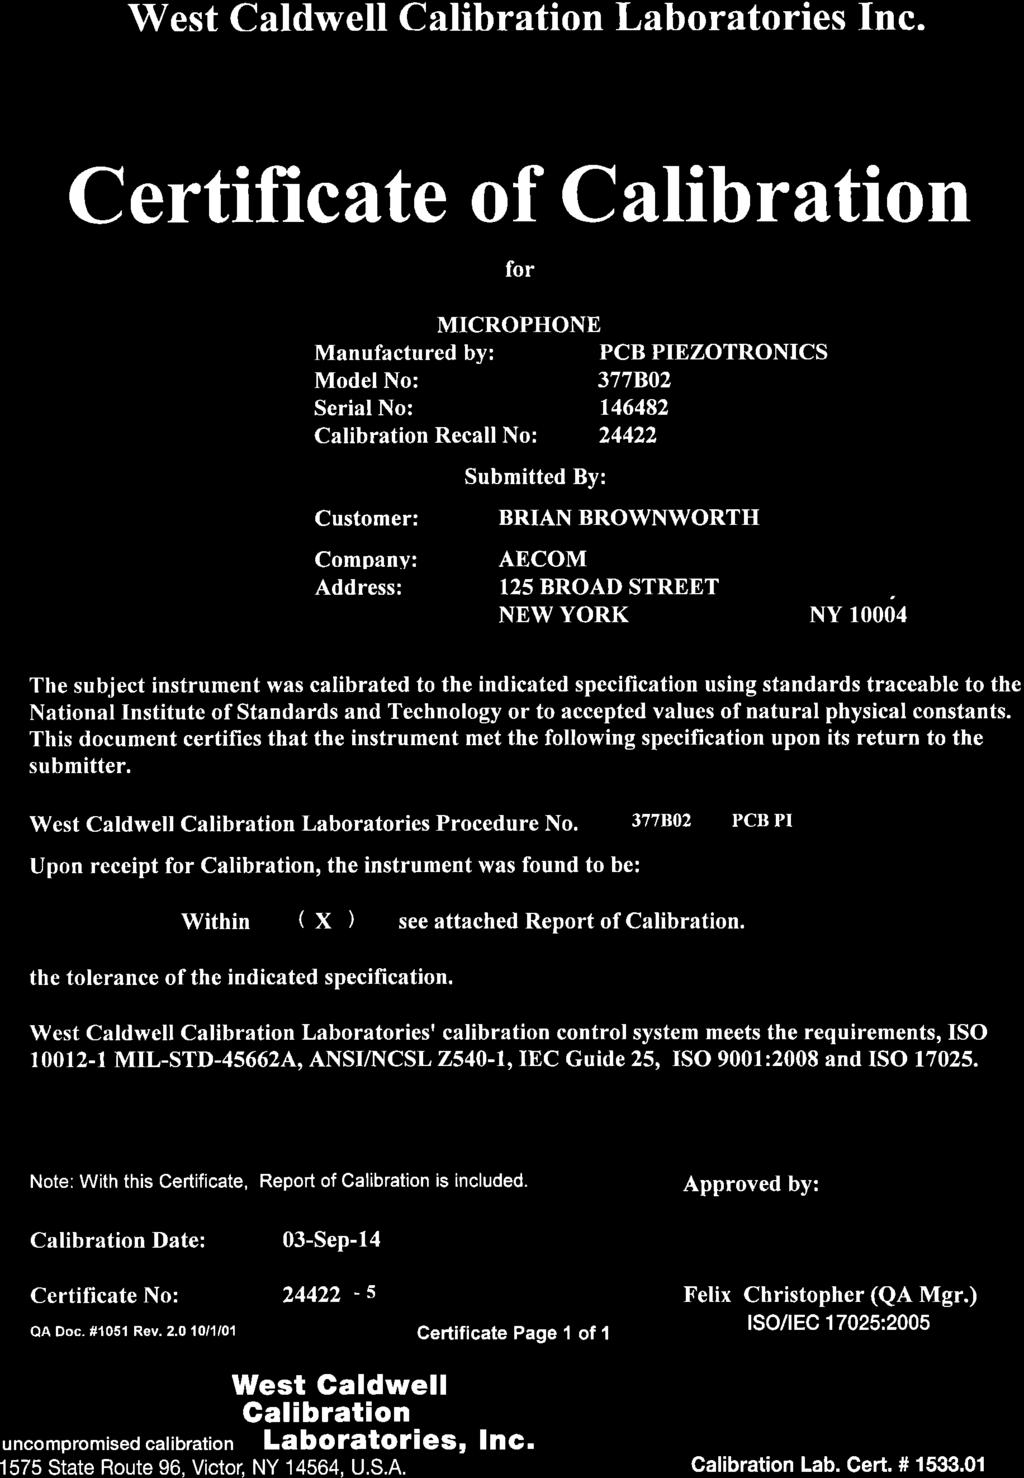
8 AECOM Preliminary ise Impact Analysis Report 3 2 Methodology Traffic noise impact analysis and abatement measures were evaluated according to the methodology and procedures set forth by the Federal Highway Administration (FHWA) in Highway Traffic ise: Analysis and Abatement Guidance (FHWA-HEP , December 2011); and the Pennsylvania Department of Transportation (PennDOT) in the Project Level Highway Traffic ise Handbook, Publication. 24 (December 2013). Per FHWA and PennDOT noise guidance, the roadway reconstruction and widening of the Turnpike from MP 298 to MP qualifies as a Type I project. A Type I project is a project considered for noise abatement that involves the construction of a highway on a new location or the physical alteration of an existing highway, which significantly changes either the horizontal or vertical alignment or increases the number of through-traffic lanes. 2.1 Modeling & Analysis ise studies involve monitoring and modeling components. Short-term noise monitoring for this project was conducted at 14 representative receptor locations dispersed throughout the nine NSAs located within the project corridor. The noise monitoring was performed in September 2014 using B&K 2250 and Larson Davis LXT sound level meters. To ensure accurate readings, the meters were field calibrated prior to each daily monitoring session with Larson Davis CAL200 external calibrators. The sound level meter microphones, preamps and calibrators are laboratory calibrated annually to ensure accurate recordings of sound level data. The laboratory calibration certificates are included in Appendix B. Typical free-flow conditions were present during all monitoring periods. In addition, 24 hour monitoring was undertaken at two separate monitoring locations along the Turnpike (eastbound and westbound) using Larson Davis 812 and 820 environmental noise monitors. This was undertaken in accordance with PennDOT s guidance for validating the peak periods of traffic flow for use in establishing the existing worst case traffic conditions. Short and long-term monitoring results are outlined in Sections 3.2 and 3.3 of this report. In order to accurately validate the traffic noise model, comprehensive traffic data were gathered concurrent to the short-term monitoring periods. Traffic speeds, number of vehicles, and compositions for both the Turnpike and any nearby local roads were recorded with a video camera during the monitoring periods, allowing for accurate computer model validation (Appendix B). See Section 4.1 for details regarding the noise model validation process. Once a model is validated, it allows for accurate prediction of existing and future no build and build worst case traffic noise impacts. Additionally, other significant localized factors affecting the recorded noise levels, such as non-traffic noise sources (aircraft flyovers, train horns, barking dogs, etc.) and intervening terrain, were noted on field sheets for each monitoring location (Appendix B). The FHWA, under the U.S. Department of Transportation (USDOT), has developed and refined the methodology employed to model and predict traffic noise levels in this study. The latest computer model, called the FHWA Traffic ise Model version 2.5 (TNM), predicts highway traffic noise levels at user-defined receptors, and aids in the design of highway noise barriers. TNM includes a database of speed-related noise emission levels for a variety of vehicle types (automobiles, medium trucks, heavy trucks, buses, and motorcycles). In addition, TNM contains a database of emission levels that accounts for the effects of accelerating vehicles, such as those affected by traffic control devices (stop signs, signals, or on-ramps) as well as the effects of roadway gradients. Sound propagation is calculated by accounting for the effects of ground and atmospheric absorption, divergence (i.e., geometric spreading of sound energy over distance), topography, man-made barriers, vegetation, and rows of buildings. To ensure a high level of accuracy, all TNM databases and calculations are based on 1/3-octave band data, and the results are recombined to give noise levels in the A-weighted db(a). TNM enables the user to evaluate a variety of traffic conditions and to develop and analyze proposed abatement. TNM model validation was completed according to PennDOT procedures prior to modeling future conditions.
9 AECOM Preliminary ise Impact Analysis Report 4 Initially, predicted noise levels generated in TNM from the traffic data collected during field monitoring are compared to the field measured noise levels to ensure that the model is reasonably validated (within ±3 db[a]) to the observed site conditions. Predictions are then made using the worst case assumptions, including peakhour traffic data provided by the PTC (Appendix A). Section (b) of 23 CFR states, For proposed roadways, it may be difficult to determine the potential operating speed of the future roadway. In these situations, it is recommended to consider using either design speeds or posted speeds plus five miles per hour (5 mph) to ensure worst case noise level predictions in the design year of the project. Therefore, the traffic noise model uses the design speed on I-76 of 70 mph throughout the project corridor. 2.2 Evaluation Criteria The evaluation criteria followed the methodologies and criteria specified in PennDOT s Publication. 24 (December 2013). Under state and federal guidelines, noise abatement is considered if it is warranted (noise levels approaching or exceeding abatement criteria). Determinations are evaluated following the identification of areas warranting abatement consideration, feasibility (constructability and effectiveness) of proposed abatement, and reasonableness (sq. ft./benefit). For this study, the existing year (2013) and the design year (2046) traffic noise levels were used to determine traffic noise impacts through the corridor. Table 2: Hourly Weighted Sound Levels db(a) for Various Land Use Activity Categories Land Use Activity Category Leq(h) 1 Evaluation Location Description of Land Use Activity Category A 57 Exterior Lands on which serenity and quiet are of extraordinary significance and serve an important public need and where the preservation of those qualities is essential if the area is to continue to serve its intended purposes. B 2 67 Exterior Residential. C 2 67 Exterior Active sports areas, amphitheaters, auditoriums, campgrounds, cemeteries, day care centers, hospitals, libraries, medical facilities, parks, picnic areas, places of worship, playgrounds, public meeting rooms, public or nonprofit institutional structures, radio studios, recording studios, recreation areas, Section 4(f) sites, schools, television studios, trails, and trail crossings. D 52 Interior Auditoriums, day care centers, hospitals, libraries, medical facilities, places of worship, public meeting rooms, public or nonprofit institutional structures, radio studios, recording studios, schools, and television studios. E 2 72 Exterior Hotels; motels; offices; restaurants/bars; and other developed lands, properties, or activities not included in A-D or F. F Agriculture, airports, bus yards, emergency services, industrial, logging, maintenance facilities, manufacturing, mining, rail yards, retail facilities, shipyards, utilities (water resources, water treatment, electrical), and warehousing. G Undeveloped lands that are not permitted. Source: PennDOT - Project Level Highway Traffic ise Handbook, Publication. 24 (December 2013) 1. Impact thresholds should not be used as design standards for noise abatement purposes. 2. Includes undeveloped lands permitted for this activity category.
10 AECOM Preliminary ise Impact Analysis Report Warranted Criteria ise abatement consideration is warranted if a noise impact is identified. A noise impact occurs when the existing or predicted level approaches or exceeds the FHWA s ise Abatement Criteria (NAC) (Table 2). The listed activity groups were established by the FHWA based on a variety of noise-sensitive land uses. isesensitive land usage in this project area consists of a mix of Activity Categories B, C, E, and F. PennDOT defines the approach criterion as 1 db(a) less than the FHWA NAC. Therefore, there is a traffic noise impact if predicted exterior noise levels are 66 db(a) or greater (for Categories B and C noise-sensitive land usage). Alternatively, the noise policy also considers properties as impacted if there is a 10 db(a) increase over existing traffic noise levels even if the absolute level falls below 66 db(a). This type of impact is addressed under the policy s substantial increase criteria. The impacts identified in this study are a result of traffic noise levels exceeding the 66 db(a) criterion Feasibility Criteria Feasibility deals primarily with acoustical and engineering considerations. Effective abatement is considered feasible if the predicted insertion loss (i.e., reduction in noise level as a result of the proposed abatement) is at least 5 db(a) for the majority (50 percent or greater) of the impacted sites. Additionally, a variety of engineering constraints must be considered when determining the feasibility of the proposed abatement. Engineering considerations include restrictions to vehicular or pedestrian traffic (including driveways); safety concerns (such as sight distances or recovery zones); barrier constructability and maintainability; utility and drainage impacts; and overall adverse social, economic, and environmental effects Reasonableness Criteria Reasonableness determination primarily focuses on a maximum square foot per benefited receptor (Max SF/BR) measurement to determine the relative value of the proposed abatement solution. PennDOT s noise barrier cost reasonableness value is based on a Max SF/BR value of 2,000 square feet. The square footage of a barrier is based on its length multiplied by its height above the finished ground at its base to the top elevation. The benefited receptor values are determined by counting all receptors receiving a 5 db(a) or greater insertion loss (IL). Although at least a 5 db(a) IL for the majority of receptors is required to meet the feasibility criteria, the proposed barrier must reduce noise levels by at least 7 db(a) for at least one benefited receptor. It is desirable to provide this IL for additional impacted receptors while conforming to the Max SF/BR criteria and if justified by a point of diminishing returns evaluation. While optimizing a proposed noise barrier, the desired abatement goals should be evaluated in terms of establishing noise reductions for impacted receptors only. For recreational land use the equivalent dwelling unit guidance outlined in Appendix E of Publication. 24 was employed during the feasibility and reasonableness screening for mitigation. This methodology was developed by PennDOT to represent a degree of use for a particular site that is different from a typical single-dwelling residence. An Equivalent Receptor Unit (ERU) value for receptors locations is applied in order to best represent the person-hours spent on such a site, and provide a direct comparison to single-dwelling households for mitigation assessment purposes. For the French Creek Golf Club in NSA 7, the PennDOT methodology was applied to establish receptor values less than 1, in order to represent the smaller amount of hours people would spend on a private golf course versus a residential home. Appendix E of Publication 24 provides guidance for establishing a grid of receptors at 130 foot spacing in usable outdoor space (such as a golf course), avoiding any unusable areas (such as sand traps or ponds). When necessary for verifying benefited dwelling units, additional modeled-only second and third row receptors established using this method were included for the mitigation analysis. For The French Creek Golf Course located in NSA 7, the following assumptions were made: The French Creek Golf Course is open 9 hours a day, 250 days a year. An average of 3.7 people play in each group. An average of 4.25 hours per round. 45 minute tee-time increments.
11 AECOM Preliminary ise Impact Analysis Report 6 Using these assumptions, an ERU value of 0.32 per grid point was established, and used for all further mitigation analysis. This value equates to roughly a third of the person-hours spent within a single-dwelling home, and is applied to each golf course grid receptor for mitigation analysis purposes. A table outlining the ERU calculation methodology can be found in Appendix F, following the barrier feasibility worksheet for NSA ise Abatement Measures A variety of measures can be considered to address an identified noise impact. Placement of noise barriers within the ROW are most commonly recommended and were considered in this analysis due to their ease of implementation. Alternative actions can be effective under certain circumstances. These include acquisition of additional ROW for installing barriers or earthen berms, inclusion of traffic control measures, and modification of the alignment. Given the nature of the Turnpike through the project area, restrictions on travel speeds or truck traffic utilization to control noise would not serve the roadway s intended function and would be difficult to enforce. Therefore, this study focused on noise barriers as the only abatement consideration..
12 AECOM Preliminary ise Impact Analysis Report 7 3 Existing Highway Traffic ise Environment (Monitored Data) 3.1 Identification of ise Study Areas (NSAs) PennDOT Publication. 24 (December 2013) states that NSAs should be delineated as areas of common highway traffic noise influence throughout the entire project limits of the proposed transportation improvement project. NSA boundaries typically do not traverse over any major and/or significant highway traffic noise influence sources (i.e., existing or proposed roadways). Grouping common areas into NSAs also assists in evaluating mitigation, organizing reports, and facilitating discussions. The project study area was sorted into nine NSAs from west to east, with three NSAs located to the north of the Turnpike and six NSAs located to the south of the Turnpike. All NSA s were identified in a ise Monitoring Work Plan that was reviewed and approved by the PTC in July Figures 2A through 2E are located in Appendix C and present the limits of the nine NSAs; each one is described below. NSA boundaries were established approximately 500-feet from the existing edge-of-shoulder of the Turnpike roadway, as stipulated for projects involving an expansion of an existing roadway NSA 1 (see Figure 2A) NSA 1 is located on the eastbound side of the Turnpike along East Main Street. NSA 1 encompasses nine single family homes, a three-dwelling apartment block and three mixed commercial & residential buildings situated along East Main Street. The NSA is bound by woods to the west, the Turnpike to the north and East Main Street to the east. NSA 1 is classified as land use Category B with some areas of Category E NSA 2 (see Figure 2A) NSA 2 is located on the eastbound side of the Turnpike along East Main Street. NSA 2 encompasses three single family homes situated along Valley Road, a gas station and a car dealership along East Main Street. The NSA is bound by East Main Street to the west, the Turnpike to the north and agricultural lands to the east. NSA 2 is classified as land use Category B with the areas of farm activities classified as Category F NSA 3 (see Figure 2B) NSA 3 is located on the eastbound side of the Turnpike along South Twin Valley Road. NSA 3 encompasses three single family homes situated along South Twin Valley Road. The NSA is bound by South Twin Valley Road to the west, the Turnpike to the north and woods to the east. NSA 3 is classified as land use Category B NSA 4 (see Figure 2C) NSA 4 is located on the westbound side of the Turnpike along rth Manor Road. NSA 4 encompasses two single family homes situated along rth Manor Road, and eight single family homes along West Conestoga Road. The NSA is bound by woods to the west, the Turnpike to the south and rth Manor Road to the east. NSA 4 is classified as land use Category B NSA 5 (see Figure 2C & 2D) NSA 5 is located on the westbound side of the Turnpike along rth Manor Road. NSA 5 encompasses four single family homes situated along East Conestoga Road. The NSA is bound by rth Manor Road to the west, the Turnpike to the south and agricultural lands to the east. NSA 5 is classified as land use Category B.
13 AECOM Preliminary ise Impact Analysis Report NSA 6 (see Figure 2C) NSA 6 is located on the eastbound side of the Turnpike along rth Manor Road. NSA 6 encompasses four single family homes situated along Goodfellow Road and an industrial office building along rth Manor Road. The NSA is bound by forest to the west, the Turnpike to the north and agricultural lands to the east. rth Manor Road runs perpendicular to the Turnpike through the area. NSA 6 is classified as land use Category B and E with areas of farm activities classified as Category F NSA 7 (see Figure 2E) NSA 7 is located on the westbound side of the Turnpike along Yoder Road. NSA 7 encompasses one single family home situated along Yoder Road, two single family homes situated along Bulltown Road, and the French Creek Golf Course. The NSA is bound by Yoder Road to the west, the Turnpike to the south and agricultural lands to the north. NSA 7 is classified as land use Category B, with the areas of farm activities classified as Category F, and active sports area classified as Category C NSA 8 (see Figure 2E) NSA 8 is located on the eastbound side of the Turnpike along Yoder Road. NSA 8 encompasses one single family home situated along Yoder Road. The NSA is bound by agricultural lands to the west, the Turnpike to the north and Yoder Road to the east. NSA 8 is classified as land use Category B with the areas of farm activities classified as Category F NSA 9 (see Figure 2E) NSA 9 is located on the eastbound side of the Turnpike along Yoder Road. NSA 9 encompasses one single family homes situated along Yoder Road. The NSA is bound by Yoder Road to the west, the Turnpike to the north and agricultural lands and woods to the east. NSA 9 is classified as land use Category B with the areas of farm activities classified as Category F. 3.2 Short-Term ise Monitoring Short-term noise monitoring sessions, 20 minutes in duration, were conducted at 14 locations within the project limits between September 15 and September 17, Figures 2, and 2A through 2E (Appendix C) show the locations of the noise monitoring sites, and Table 3 provides a summary of the measurement results. The measured existing noise levels for receptors which are impacted are highlighted in red. The objectives of the short-term noise measurements were to: Obtain noise measurement data used to validate the traffic-noise prediction modeling for each NSA, thereby increasing confidence in calculated noise levels; Obtain counted traffic data used as input to the TNM during validation of the noise modeling for each NSA; and Document existing ambient sound levels at noise study locations within each NSA. The short-term measurement sites were selected according to the following requirements: Represent noise-sensitive land uses within each NSA. Short-term measurement sites were selected to represent various categories or clusters of noise-sensitive receptors within each NSA. Distinguishing characteristics of various clusters included some or all of the following: Distance to the Turnpike; Absence or presence of shielding (e.g., first-row vs. second-row receptors);
14 AECOM Preliminary ise Impact Analysis Report 9 Roadway/receiver geometry (e.g., Turnpike depressed or on-fill, receptors on hillside overlooking Turnpike, presence of entrance/exit ramps, etc.); and Influence of other traffic-noise sources such as local streets. When possible, represent areas of frequent human use. Alternatively, measurement sites were selected in areas that did not have frequent human use but were acoustically equivalent to nearby locations with frequent human use (e.g., on the grass along a side street or set back the same distance from the Turnpike as the yard of the adjacent house); Give primary consideration to first-row receivers. Typically, traffic noise levels will be highest at the closest receivers and noise barriers will provide the greatest benefit at these locations; and Conduct additional measurements at second-row and third-row locations. Additional measurements were conducted at these locations to assist in the noise modeling validation and in determining the effects of shielding; For each site, these procedures were followed: The short-term measurements were conducted with ANSI Type 2 instruments with calibrations traceable to the National Institute of Standards and Technology (NIST); The sound level meters were field calibrated before and after each short-term measurement (see Appendix B for annual calibration certifications); Measurements were conducted for a minimum of 20-minute periods. Individual one minute average sound levels (L eq ) were recorded so that periods including events not representative of the ambient noise environment or not traffic-related could be separated or excluded. Specifically, notes on the site sketches were included indicating potential periods of non- traffic noise influence (i.e., barking dogs and aircraft over-flights). The data collected for these individual periods is further scrutinized following the field monitoring to identify outlier data and potentially exclude these periods from the calculation of the overall average sound level; A short-term field measurement data sheet (see Appendix B) was completed for each measurement site; Ambient weather data including wind speed and direction, temperature, and relative humidity were recorded during each measurement period to ensure requisite meteorological conditions were present for noise model validation. For example, monitoring should not be performed during periods of excessive wind as this will potentially cause mechanical interference (microphone and windscreens) or abnormal noise propagation patterns; During each short-term noise measurement, simultaneous traffic volume and classification counts were conducted for all roads on which traffic was judged to make a significant contribution to the measured sound level at an individual site. Traffic volumes and classes were noted on the site sketches (see Appendix B) for each short-term measurement; short-term measurements were conducted during periods of stop-and-go traffic or if the average speed was judged to vary significantly during the measurement period; short-term measurements were conducted during periods when the Turnpike pavement was wet; and ise meter location sketches were drawn indicating nearby landmarks to allow for accurate model validation and duplication of monitoring sites if necessary.
15 AECOM Preliminary ise Impact Analysis Report 10 Table 3: Summary of Short-Term Measurement Results NSA 1 Measurement Location Address Monitored Level Leq db(a) M Main Street 69 M Main Street 57 2 M Valley Road M4 308 S Twin Valley Road 65 M5 316 S Twin Valley Road 66 M6 309 N Manor Road 64 M7 11 W Conestoga Road 75 5 M8 33 E Conestoga Road M9 18 Goodfellow Road 72 M10 35 Goodfellow Road 60 M Yoder Road 53 M Bulltown Road 63 8 M Yoder Road 56 9 M Yoder Road Hour ise Monitoring PennDOT Publication. 24 (December 2013) states that If there is some question as to the worst-case highway traffic noise hour, it may be necessary to conduct long-term monitoring to determine the worst-case highway traffic noise hour(s). In this case, long-term monitoring should be done in conjunction with evaluating the existing diurnal traffic patterns to determine the existing worst-case highway traffic noise hour. Accordingly, 24 hour noise monitoring was conducted at two locations within the project limits between September 15 and September 17, Figures 2 and 3 (Appendix C) shows the locations of the monitoring sites, and Figures 4A and 4B (Appendix D) outlines the 24 hour monitoring results. The results of this monitoring confirm that the peak traffic noise hours occur between 6:00 AM and 9:00 AM.
16 AECOM Preliminary ise Impact Analysis Report 11 4 Future Highway Traffic ise Environment (Existing and Future Calculations) 4.1 Validation of ise Modeling The FHWA has developed a computer noise model that is used for traffic noise emissions prediction and abatement evaluation. As referenced in Section 2.1, the FHWA s TNM includes a database of speed-related noise emission levels for a variety of vehicle types (i.e., automobiles, medium trucks, and heavy trucks). TNM also includes a database of noise emission levels that accounts for acceleration noise on roadway facilities that would be associated with traffic control devices (stop lights, stop signs, tollbooths, and on-ramps) or gradient changes. TNM uses these emissions data to calculate sound energy propagation over distances and estimate noise levels at discrete locations. Ground and atmospheric absorption of sound energy as well the spreading of energy over distance (divergence) are considered, as are the effects of man-made barriers, topography, vegetation, and rows of buildings. PennDOT Publication. 24 stipulates the use of the most current version of TNM when assessing traffic noise levels for highway projects. The TNM modeling for a specific project area is typically validated by comparison of TNM calculated results with the field-measured noise data. Publication. 24 describes the purpose of modeling validation and describes the procedure. To help accomplish the modeling validation, simultaneous noise measurements and traffic counts were conducted during the 14 short-term measurements described in Section 4.2. The directional traffic counts included vehicle class identification broken down into cars, medium trucks, and heavy trucks. Following the measurements, the short-term traffic counts were normalized to hourly volumes and used as input to the noise prediction model. Based on a comparison of measured and calculated sound levels, refinements were made to the TNM model to more accurately represent the surrounding landscape. Refinements included adjustments to variables within the propagation path, including but not limited to alterations of building row characteristics and adjustments to terrain lines and tree zones. Table 4 presents the measured and TNM-calculated noise levels for the 14 short-term measurement sites following refinement of the noise modeling. te that the measured and calculated sound levels do not represent the annual worst case conditions. The prediction of the annual worst case noise levels is discussed in Section 4.2 below. PennDOT Publication. 24, Section states that if the difference between the [measured and calculated] values is less than +/- 3 db(a), this is an indication that the model is within the accepted level of accuracy. 13 of the 14 short-term monitoring locations predicted noise levels within these prescribed parameters. This correlation between measured and computed sound levels provides a high level of confidence in TNM s calculations throughout the project area. In addition, the average difference between the calculated hourly L eq and the measured L eq was approximately 1.1 db(a). This bias towards slight over-prediction implies that the noise model is appropriately conservative and would tend to slightly over-predict, rather than under-predict, noise impacts. The one monitoring site that was not able to be validated (M3) represents the single-family residence located at 2025 Valley Road, within NSA 2. Despite best efforts, this receptor continued to over-predict by approximately 8 db(a), 5 db(a) over the accepted level for validation. However, due to the fact the model is over-predicting (providing a more conservative result for mitigation analysis), and the distance of the other receptors within NSA 2 to the Turnpike, the results of the model were still utilized in the screening evaluation for potential noise abatement.
17 AECOM Preliminary ise Impact Analysis Report 12 Table 4: Measured vs. Calculated Sound Levels for TNM Validation NSA Measurement Location Address Monitored Level Leq db(a) Modeled Level Leq db(a) Validates? (Y/N) 1 M Main Street M Main Street M Valley Road M4 308 S Twin Valley Road M5 316 S Twin Valley Road M6 309 N Manor Road M7 11 W Conestoga Road M8 33 E Conestoga Road M9 18 Goodfellow Road M10 35 Goodfellow Road M Yoder Road M Bulltown Road M Yoder Road M Yoder Road Worst Case Calculations Following validation of the noise model, TNM was used to calculate worst case noise levels at 56 modeled receptor locations, distributed throughout the nine NSAs. These modeled-only receptor sites represent noisesensitive receptors within each NSA, and the predicted levels at these locations were used in all further mitigation analysis. All significant sound propagation and shielding assumptions used in the model validation phase were retained for the worst case prediction modeling except where altered or otherwise rendered invalid due to the proposed design. Equivalent receptors for the 14 monitoring sites used in the validation model were included in the 56 receptors chosen. Receptor locations are referenced in Appendix E and outlined in Figures 5, and 5A through 5E. Table 5 provides the worst case sound levels calculated for existing (2013) and future (2046) conditions. The table is organized by NSA, starting at the western end of the project area and proceeding eastward. Traffic data for the worst case calculations for both existing and future conditions were developed through data made available by the PTC. Appendix A of this report provides additional traffic details, including modeled traffic volumes, growth factors and vehicle classification breakdown, as sourced from the PTC. Traffic speeds were modeled at the design speed of 70 miles per hour (70 mph) in order to represent the worst case scenario for noise impacts Existing Condition Sound Levels The validated noise models were used as the baseline for the calculation of existing (2013) worst case noise levels. Field-recorded traffic data was replaced in the models with the peak-hour data supplied by the PTC. Calculated worst case L eq sound levels for the existing condition ranged from 54 to 75 db(a) among all receptors. Typically, locations closest to the Turnpike had the highest calculated sound levels. In Table 5, receptor sites with worst case sound levels approaching or exceeding the NAC as discussed in Section 2.2 are identified in red. L eq sound levels of 66 db(a) or higher approach or exceed the NAC for residential or other noise-sensitive outdoor land uses. Under the modeled existing conditions, 16 receptor locations are predicted to experience noise impacts during the loudest hour of the day. ise impacts presently occur in five out of the nine NSAs evaluated.
18 AECOM Preliminary ise Impact Analysis Report Future (2046) Build Condition Calculated Sound Levels Worst case conditions were also calculated for the future (2046) Build condition. This scenario represents the future Turnpike facility incorporating no changes to the roadway geometry. This information is useful for evaluating the scope of the effect that the proposed facility will have on the overall noise environment. The Turnpike is typical of highway facilities where future noise levels are anticipated to increase regardless of the proposed design changes due to an increase in traffic projections. By evaluating differences in sound levels between the Build and Build conditions, the relative effect of the project on ambient noise levels can be better understood and considered in project planning. The validated noise models were used as the baseline for the calculation of future Build worst case noise levels. Field-recorded traffic data was replaced in the models with the peak hour Build (2046) data supplied by the PTC. Calculated worst case L eq sound levels for the Future Build condition ranged from 56 to 77 db(a) at all receptors. Typically, locations closest to the Turnpike had the highest calculated sound levels. In Table 5, prediction sites with worst case sound levels approaching or exceeding the NAC as discussed in Section 2.2 are identified in red. L eq sound levels of 66 db(a) or higher approach or exceed the NAC for residential or other noisesensitive outdoor land uses. The substantial increase over existing noise levels criterion did not trigger additional noise impacts. Under the modeled Future Build conditions, 22 receptor locations are anticipated to experience noise impacts during the loudest hour of the day. ise impacts are anticipated to occur in five out of the nine NSAs evaluated Future (2046) Build Condition Calculated Sound Levels Worst case conditions were also calculated for the Future (2046) Build condition. This scenario represents the future Turnpike facility incorporating design changes to the roadway geometry and intervening terrain. This information is used to identify the number and location of NSAs that warrant mitigation consideration. As referenced in Section 2.2, those areas warranting mitigation consideration are subject to further mitigation analysis in order to determine if sound walls are feasible and reasonable. The validated noise models were modified to incorporate the proposed design changes, and then used as the baseline for the calculation of future Build (2046) worst case noise levels. Field observed traffic data was replaced in the models with the peak-hour Build (2046) traffic data supplied by the PTC. The same 56 modeled receptor locations used in the existing and future Build (2046) worst case models were incorporated as previously described. The properties on which receptors R1, R2 and R3 are located have been or will be acquired by the PTC, and the homes demolished to accommodate the proposed Turnpike improvements. Therefore, these three receptors have been excluded from the Future (2046) Build Condition assessment. Calculated worst case L eq sound levels for the future Build condition ranged from 56 to 73 db(a) among all receptor sites. Typically, locations closest to the Turnpike had the highest calculated sound levels. In Table 5, receptor sites with worst case sound levels approaching or exceeding the NAC, as discussed in Section 2.2, are identified in red. L eq sound levels of 66 db(a) or higher approach or exceed the NAC for residential or other noise-sensitive outdoor land uses. receptors have been identified as being impacted due to the substantial increase over the existing noise levels in this analysis. Under the modeled Future Build conditions, 25 receptor sites are anticipated to experience noise impacts during the loudest hour of the day. ise impacts are anticipated to occur in seven out of the nine NSAs evaluated, outlined as follows:
19 AECOM Preliminary ise Impact Analysis Report 14 NSA 1 - ise levels are expected to be between 64 db(a) and 69 db(a) in this NSA. Increases above existing noise levels range between 1 db(a) and 3 db(a) in this NSA. These noise levels represent a traffic noise impact to 6 receptors in the NSA. Mitigation analysis is warranted for this NSA. NSA 2 - ise levels are expected to be between 60 db(a) and 70 db(a) in this NSA. Increases above existing noise levels range between 0 db(a) and 3 db(a) in this NSA. These noise levels represent no traffic noise impacts in this NSA, due to some receptors falling under Category F land use. Mitigation analysis is not warranted for this NSA. NSA 3 - ise levels are expected to be between 65 db(a) and 73 db(a) in this NSA. Increases above existing noise levels range between 4 db(a) and 5 db(a) in this NSA. These noise levels represent a traffic noise impact to 2 noise-sensitive receptors in the NSA. Mitigation analysis is warranted for this NSA. NSA 4 - ise levels are expected to be between 63 db(a) and 70 db(a) in this NSA. Increases above existing noise levels range between 1 db(a) and 5 db(a) in this NSA. These noise levels represent a traffic noise impact to 6 noise-sensitive receptors in the NSA. Mitigation analysis is warranted for this NSA. NSA 5 - ise levels are expected to be between 56 db(a) and 66 db(a) in this NSA. Increases above existing noise levels range between 2 db(a) and 3 db(a) in this NSA. These noise levels represent a traffic noise impact to 1 noise-sensitive receptor in the NSA. Mitigation analysis is warranted for this NSA. NSA 6 - ise levels are expected to be between 62 db(a) and 66 db(a) in this NSA. Increases above existing noise levels range between 2 db(a) and 3 db(a) in this NSA. These noise levels represent a traffic noise impact to 1 noise-sensitive receptor in the NSA. Mitigation analysis is warranted for this NSA. NSA 7 - ise levels are expected to be between 58 db(a) and 71 db(a) in this NSA. Increases above existing noise levels range between 1 db(a) and 3 db(a) in this NSA. These noise levels represent a traffic noise impact to 3.92 noise-sensitive receptors in the NSA. Mitigation analysis is warranted for this NSA. NSA 8 - ise levels are expected to be 65 db(a) in this NSA. Increases above existing noise levels for the single receptor is 3 db(a). These noise levels represent no traffic noise impacts in this NSA. Mitigation analysis is not warranted for this NSA. NSA 9 - ise levels are expected to be 70 db(a) in this NSA. Increases above existing noise levels for the single receptor is 3 db(a). These noise levels represent a traffic noise impact to 1 noise-sensitive receptor in the NSA. Mitigation analysis is warranted for this NSA. te that per the FHWA and Pennsylvania Department of Transportation traffic noise analysis guidelines, noise values, comparisons and insertion losses are calculated to the tenth of a db(a) and are rounded for presentation purposes.
20 AECOM Preliminary ise Impact Analysis Report 15 Table 5: Calculated Worst Case Existing (2013) and Future (2046) ise Levels NSA Receptor ID Address Criteria db(a) Existing Worst Case (2013) db(a) Future Build (2046) db(a) Future Build (2046) 1 R Main Street To be demolished db(a) R Main Street To be demolished R Main Street To be demolished R Main Street R Main Street R Main Street R Main Street R Main Street R Main Street R Main Street R Main Street R Main Street R13* 3808 Main Street * Represents 3 dwelling units 2 R Main Street N/A R Main Street N/A R Valley Road R Valley Road R Valley Road R S Twin Valley Road R S Twin Valley Road R S Twin Valley Road R22 51 W Conestoga Road R23 43 W Conestoga Road R24 35 W Conestoga Road R25 33 W Conestoga Road R26 27 W Conestoga Road R27 25 W Conestoga Road R28 23 W Conestoga Road R29 11 W Conestoga Road R N Manor Road R N Manor Road R32 23 E Conestoga Road R33 33 E Conestoga Road R E Conestoga Road R E Conestoga Road R36 35 Goodfellow Road R37 18 Goodfellow Road R38 15 Goodfellow Road R39 11 Goodfellow Road R N Manor Road
21 AECOM Preliminary ise Impact Analysis Report 16 NSA Receptor ID Address Criteria db(a) Existing Worst Case (2013) db(a) Future Build (2046) db(a) Future Build (2046) 7 R Yoder Road R42_1 + French Creek Golf Club R42_2 + French Creek Golf Club R42_3 + French Creek Golf Club R42_4 + French Creek Golf Club R42_5 + French Creek Golf Club R42_6 + French Creek Golf Club R42_7 + French Creek Golf Club R42_8 + French Creek Golf Club R42_9 + French Creek Golf Club R42_10 + French Creek Golf Club R42_11 + French Creek Golf Club R Bulltown Road R Bulltown Road Represents 0.32 dwelling units (ERU = 0.32) 8 R Yoder Road db(a) 9 R Yoder Road te: ise values, comparisons and insertion losses are calculated to the tenth of a db(a) and are rounded for presentation purposes.
22 AECOM Preliminary ise Impact Analysis Report 17 5 Highway Traffic ise Consideration and Mitigation Alternatives 5.1 Mitigation Alternatives FHWA has identified certain noise mitigation measures to reduce traffic noise impact that may be incorporated into either new roadway projects or roadway improvement projects that increase traffic capacity. These include: Traffic management measures (e.g., traffic control devices and signing for prohibition of certain vehicle types and time-use restrictions for certain vehicle types); Alteration of horizontal and vertical alignments; Acquisition of property to serve as a buffer zone to preempt development which would be adversely impacted by traffic noise; Sound insulation of public or nonprofit institutional structures; and Construction of noise barriers Possible traffic management measures include reducing speeds and truck restrictions. Speed restrictions provide only a slight reduction in noise levels without significant reductions in speed. For example, to achieve a fivedecibel reduction in noise from heavy trucks, average speeds would need to be reduced from 70 to 50 mph. Therefore, speed restrictions are not a feasible noise mitigation measure for this project. Truck restrictions would not be practical because the Turnpike is a major east-west interstate highway in Pennsylvania. Therefore, truck restrictions also are not a feasible noise mitigation measure for this project. There are no planned changes in grading of the Turnpike within the scope of this project that will limit potential noise impacts. Significant traffic noise level reductions would require substantial changes to either the Turnpike s horizontal or vertical alignment. Such alignment shifts are beyond the scope of this roadway improvement project and therefore, are beyond the scope of this analysis. Although there is a considerable amount of undeveloped land adjacent to the Turnpike, buffer zones are typically not a viable mitigation option, due to their substantial cost compared to noise barriers. Although sound insulation of public or nonprofit institutional structures may be considered, federal and state policies require that primary consideration in determining and abating highway traffic noise impact must be given to exterior areas. The interior criterion (NAC Category D, see Section 2.2) is intended to be used in those situations where there are no outdoor activities to be affected by the traffic noise, or where the exterior activities are far from or physically shielded from the roadway in a manner that prevents an impact on exterior activities. impacts that would be associated with Category D land use have been identified through this analysis. 5.2 ise Barrier Evaluation Construction of noise barriers is the only remaining highway traffic noise abatement measure to be considered. A noise barrier evaluation was conducted for each NSA meeting the warranted criteria described in Section The objective of each evaluation was to determine whether a noise barrier could meet the feasibility and reasonableness criteria described in Section and Section The evaluations were conducted to determine the preferred alignment, approximate noise barrier end points, and the approximate average height of each proposed noise barrier. The noise barrier design was conducted at a preliminary level requiring further optimization during the final design stage of the project. Specifically, ranges of barrier heights were evaluated in two-foot increments with the noise barrier assumed to be of constant height for its entire length. In general, noise barriers were evaluated for feasibility and reasonableness with constant heights of 8, 10, 12, 14, 16, 18, and 20 feet above ground level
23 AECOM Preliminary ise Impact Analysis Report 18 (see Table 6) to determine whether a barrier could be designed to meet the feasibility and reasonableness criteria. For any recommended noise barriers, further acoustical and engineering design would be necessary prior to construction. Figures 5A through 5E (Appendix E) outline the approximate locations of the evaluated noise barriers, and Table 6 provides a summary of the barrier analysis including noise reduction values for each barrier. Table 6: Summary of Evaluated ise Barriers NSA / Barrier Number Barrier Height ise Reduction - db(a) Min. Avg. Max. # of Units Impacted # of Impacted Units at NR Goal Feasible? # of Units Benefited Barrier Sq.Ft. Barrier Sq.Ft. per Unit Benefited Reasonable? NSA 1 - Barrier , , , , , , ,000 - NSA 3 - Barrier , , ,800 13, ,100 8, ,400 9, ,700 10, ,000 11,500 NSA 4 - Barrier , , , , , , ,000 - NSA 5 - Barrier , , , ,700 14, ,800 16, ,900 18, ,000 21,000 NSA 6 - Barrier , , , , , , ,000 -
24 AECOM Preliminary ise Impact Analysis Report 19 NSA / Barrier Number Barrier Height ise Reduction - db(a) Min. Avg. Max. # of Units Impacted # of Impacted Units at NR Goal Feasible? # of Units Benefited Barrier Sq.Ft. Barrier Sq.Ft. per Unit Benefited Reasonable? NSA 7 Barrier , , , , ,400 7, ,200 4, ,000 5,385 NSA 9 Barrier ,800 2, ,500 3, ,200 4, ,900 4, ,600 5, ,300 6, ,000 7, Detailed ise Barrier Descriptions This section of the report provides further information on the noise barrier analysis for each of the impacted NSAs. Table 7 provides barrier-included sound levels and insertion loss values at all receptors screened for mitigation. In Table 7, impacted receptors are shown in red and the insertion loss for benefited receptors is shown in green. The results outlined in Table 7 represent the barrier heights for each NSA which best fulfil the feasibility and reasonableness criteria, and are described below. NSA 1 Barrier 1 - ise barriers ranging in height of between 8 and 20 feet and extending for approximately 700 feet would not provide noise reductions of 5 db(a) to any of the six impacted receptors identified in this NSA, therefore not providing at least five decibels of noise reduction at 50 percent or more of the impacted receptor units. It is noted that this NSA is impacted by local traffic on East Main Street, which reduces the effectiveness of potential noise barriers along the Turnpike. The barrier analysis runs outlining these results are saved in the MITIGATION TNM file as Barrier 1 8 ft through Barrier 1 20 ft. Presented in Table 7 are the results for Barrier 1 20 ft. This noise barrier does not satisfy the minimum feasibility criteria. Therefore, based on the results of the analysis completed for this project, this noise barrier is not recommended. NSA 3 Barrier 3 - A noise barrier with a height of 14 feet and extending for approximately 1,150 feet would provide noise reductions of 6 db(a) for both of the impacted receptors identified in this NSA, therefore providing at least five decibels of noise reduction at 50 percent or more of the impacted receptor units. The barrier would also satisfy each of the other feasibility criteria. The noise barrier would not provide at least 5 db(a) of noise reduction at any non-impacted receptor units. The total square footage of the resulting barrier would be approximately 16,100 square feet with a square foot per benefited unit value of 8,050 sq. ft., which is greater than the maximum 2,000 sq. ft. per benefited unit allowed for the reasonableness criteria. The barrier analysis run outlining these results is saved in the MITIGATION TNM file as Barrier 3 14 ft. This noise barrier satisfies the feasibility criteria but not the reasonableness criteria. Therefore, based on the results of the analysis completed for this project, this noise barrier is not recommended.
25 AECOM Preliminary ise Impact Analysis Report 20 NSA 4 Barrier 4 - A noise barrier with a height of 8 feet and extending for approximately 1,750 feet would provide noise reductions of 5 db(a) to one of the six impacted receptors identified in this NSA, therefore not providing at least five decibels of noise reduction at 50 percent or more of the impacted receptor units. It is noted that this NSA is impacted by local traffic on West Conestoga Road, which reduces the effectiveness of potential noise barriers along the Turnpike. The barrier analysis run outlining these results is saved in the MITIGATION TNM file as Barrier 4 8 ft. This noise barrier does not satisfy the minimum feasibility criteria. Therefore, based on the results of the analysis completed for this project, this noise barrier is not recommended. NSA 5 Barrier 5 - A noise barrier with a height of 14 feet and extending for approximately 1,050 feet would provide noise reductions of 5 db(a) for the one impacted receptor identified in this NSA, therefore providing at least five decibels of noise reduction at 50 percent or more of the impacted receptor units. The barrier would also satisfy each of the other feasibility criteria. The noise barrier would not provide at least 5 db(a) of noise reduction at any non-impacted receptor units. The total square footage of the resulting barrier would be approximately 14,700 square feet with a square foot per benefited unit value of 14,700 sq. ft., which is greater than the maximum 2,000 sq. ft. per benefited unit allowed for the reasonableness criteria. The barrier analysis run outlining these results is saved in the MITIGATION TNM file as Barrier 5 14 ft. This noise barrier satisfies the feasibility criteria but not the reasonableness criteria. Therefore, based on the results of the analysis completed for this project, this noise barrier is not recommended. NSA 6 Barrier 6 - ise barriers ranging in height of between 8 and 20 feet and extending for approximately 950 feet would not provide noise reductions of 5 db(a) for the one impacted receptor identified in this NSA, therefore not providing at least five decibels of noise reduction at 50 percent or more of the impacted receptor units. It is noted that this NSA is impacted by local traffic on rth Manor Road, which reduces the effectiveness of potential noise barriers along the Turnpike. The barrier analysis runs outlining these results are saved in the MITIGATION TNM file as Barrier 6 8 ft through Barrier 6 20 ft. Presented in Table 7 are the results for Barrier 6 20 ft. This noise barrier does not satisfy the minimum feasibility criteria. Therefore, based on the results of the analysis completed for this project, this noise barrier is not recommended.
26 AECOM Preliminary ise Impact Analysis Report 21 NSA 7 Barrier 7 - A noise barrier with a height of 18 feet and extending for approximately 1,400 feet would provide noise reductions of 4 db(a) to 8 db(a) for all 3.92 of the impacted receptors identified in this NSA, therefore providing at least five decibels of noise reduction at 50 percent or more of the impacted receptor units. The barrier would also satisfy each of the other feasibility criteria. The noise barrier would provide at least 5 db(a) of noise reduction at 0.96 non-impacted receptor units. These fractional receptor totals are the result of the ERU calculation for the golf course receptors outlined in Section and Appendix F. The total square footage of the resulting barrier would be approximately 25,200 square feet with a square foot per benefited unit value for 5.20 units of 4,846 sq. ft., which is greater than the maximum 2,000 sq. ft. per benefited unit allowed for the reasonableness criteria. The barrier analysis run outlining these results is saved in the MITIGATION TNM file as Barrier 7 18 ft. This noise barrier satisfies the feasibility criteria but not the reasonableness criteria. Therefore, based on the results of the analysis completed for this project, this noise barrier is not recommended. NSA 9 Barrier 9 - A noise barrier with a height of 8 feet and extending for approximately 350 feet would provide noise reductions of 5 db(a) for the one impacted receptor identified in this NSA, therefore providing at least five decibels of noise reduction at 50 percent or more of the impacted receptor units. The barrier would also satisfy each of the other feasibility criteria. The noise barrier would not provide at least 5 db(a) of noise reduction at any non-impacted receptor units. The total square footage of the resulting barrier would be approximately 2,800 square feet with a square foot per benefited unit value of 2,800 sq. ft., which is greater than the maximum 2,000 sq. ft. per benefited unit allowed for the reasonableness criteria. The barrier analysis run outlining these results is saved in the MITIGATION TNM file as Barrier 9 8 ft. This noise barrier satisfies the feasibility criteria but not the reasonableness criteria. Therefore, based on the results of the analysis completed for this project, this noise barrier is not recommended.
27 AECOM Preliminary ise Impact Analysis Report 22 Table 7: Future Build Sound Levels and Insertion Loss Values NSA NSA 1 NSA 3 NSA 4 NSA 5 NSA 6 NSA 7 Receptor Represented Dwelling Units Worst-Case Leq Sound Levels - db[a] Future Build (2046) Barrier With Barrier Insertion Loss R R R R R R R R R R R R R R R R R R R R R R R R R R R R R R R42_ R42_ R42_ R42_ R42_ R42_ R42_ R42_ R42_ R42_ R42_ R R NSA 9 R te: ise values, comparisons and insertion losses are calculated to the tenth of a db(a) and are rounded for presentation purposes.
28 AECOM Preliminary ise Impact Analysis Report Summary of Results Based on the analysis in this report, none of the evaluated noise barriers were found to be warranted, feasible and reasonable. Due to the large area of each NSA relative to the number of receptors located within them, the length of each barrier required to provide sufficient reduction to achieve the feasibility criteria provides a square-foot per benefitted receptor value larger than that permitted by the reasonableness criteria. The close proximity of receptors to local roads is also a contributing factor to the lack of effectiveness of noise barriers placed along the Turnpike.
29 AECOM Preliminary ise Impact Analysis Report 24 6 Construction ise Consideration and Mitigation Alternatives Increased noise levels from construction activities associated with the proposed roadway improvements may occur within the project study area. ise levels during construction are difficult to predict and vary depending on the types of construction activity and the types of equipment used for each stage of work. Heavy machinery, the major source of noise in construction, is constantly moving in unpredictable patterns and is not usually at one location very long. The PTC is committed to reasonable abatement of construction noise, recognizing that these impacts will be temporary in nature.
30 AECOM Preliminary ise Impact Analysis Report 25 7 Public Involvement Process Consideration of the public s needs is taken into account when evaluating the reasonableness of noise mitigation along the Turnpike, and a public involvement process is undertaken is included to allow public input. Public meetings with regards to noise as well as other aspects of the project are tentatively planned for During the project s development, an important aspect of the coordination efforts is public comment. Appropriate consideration and action will be taken with regard to public comments, and to providing effective mitigation to those receptors affected by the project.
31 AECOM Preliminary ise Impact Analysis Report 26 Bibliography Pennsylvania Department of Transportation. December Project Level Highway Traffic ise Handbook, Publication. 24. PennDOT, Harrisburg, Pennsylvania. The Federal Highway Administration. Revised December 12, Highway Traffic ise: Analysis and Abatement Guidance FHWA-HEP , FHWA, Washington, D.C.
32 AECOM Preliminary ise Impact Analysis Report 27 Appendix A. Pennsylvania Turnpike Commission Traffic Data
33 Traffic Data for MP 298 to MP 312 Between Morgantown I/C and Downingtown I/C Traffic Volumes Eastbound ADT 21,880 35,762 Westbound ADT 31,052 50,754 Peak Hour (EB) 11.16% Peak Hour (WB) 8.71% 2,442 2,705 3,991 4,421 Peak Month: EB=vember, WB=October Vehicle Composition(%) (Peak Hour): EB WB PTC Class 1= 86% 92% PTC Classes 2-3= 5% 3% PTC Classes 4-9= 9% 5% Growth Factors: 1.50% 1.50%
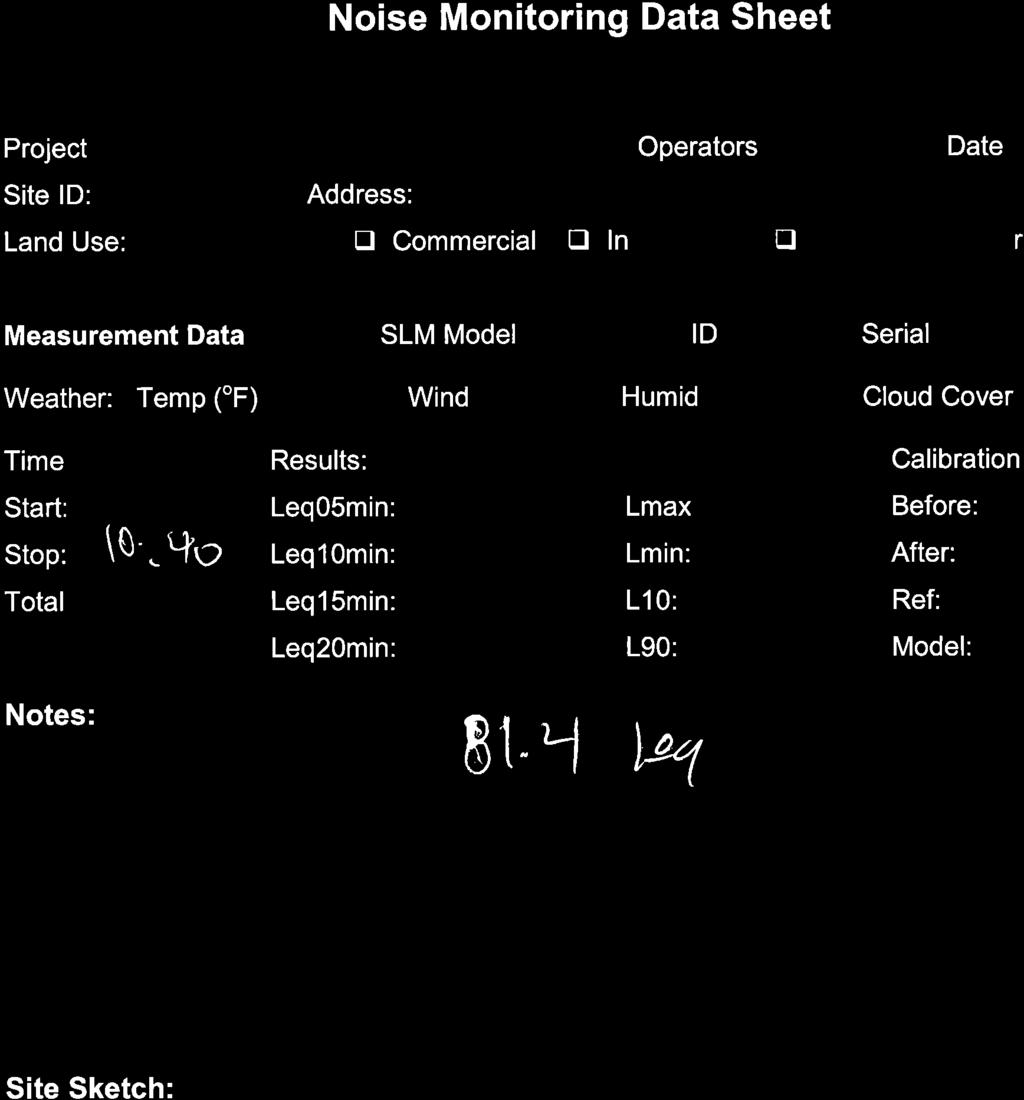
34 AECOM Preliminary ise Impact Analysis Report 28 Appendix B. ise Monitoring Field Sheets, Traffic Counts & Instrument Calibration Certificates

35
36
37

38
39 M Valley Road M3
40 M4 308 S Twin Valley Road 308 S Twin Valley Road M4
41 M5 316 S Twin Valley Road
42

43
44

45 M9 18 Goodellow Road M9
46
47
48 M Bulltown Road M12
49
50
51 AECOM Preliminary ise Impact Analysis Report 29 Turnpike Traffic Counts & Vehicle Breakdown by Monitoring Position Monday Sept 15 th :54 pm M1/M2/M3 WB Auto 570 Med 23 Heavy 57 Moto 1 Tuesday Sept 16 th :12 am M6/M7/M9/M10 WB Auto 332 Med 27 Heavy 41 Moto 0 Tuesday Sept 16 th :32 am M8/M11 WB Auto 282 Med 20 Heavy 50 Moto 0 Tuesday Sept 16 th :28 pm M12/M13/M14 WB Auto 549 Med 19 Heavy 65 Moto 1 Monday Sept 15 th :15 pm M4/M5 WB Auto 580 Med 20 Heavy 53 Moto 2 EB Auto 379 Med 6 Heavy 42 Moto 0 EB Auto 705 Med 21 Heavy 70 Moto 0 EB Auto 500 Med 14 Heavy 78 Moto 0 EB Auto 407 Med 7 Heavy 39 Moto 1 EB Auto 363 Med 9 Heavy 43 Local Traffic Counts & Vehicle Breakdown by Monitoring Position M1 Auto 439 Med 3 Heavy 8 Moto 3 M4 Auto 32 Med 3 Heavy 1 Moto 1 M6 Auto 147 Med 3 Heavy 0 Moto 1 Bus 8 M7 Auto 243 Med 15 Heavy 8 Moto 1 Bus 7 M9 Auto 161 Med 13 Heavy 2 Moto 1 Bus Source: AECOM Field Video Recordings, September 2014
52

53
54
55
56
57
58 AECOM Preliminary ise Impact Analysis Report 30 Appendix C. ise Monitoring & NSA Site Locations

59 AECOM Preliminary ise Impact Analysis Report 31 Figure 2: Key Index - NSA & Monitoring Locations Figure 2A Figure 3 Figure 2B Figure 2C Figure 2D Figure 2E

60 AECOM Preliminary ise Impact Analysis Report 32 Figure 2A: NSA & Short-Term Monitoring Locations

61 AECOM Preliminary ise Impact Analysis Report 33 Figure 2B: NSA & Short-Term Monitoring Locations

62 AECOM Preliminary ise Impact Analysis Report 34 Figure 2C: NSA & Short-Term Monitoring Locations

63 AECOM Preliminary ise Impact Analysis Report 35 Figure 2D: NSA & Short-Term Monitoring Locations

64 AECOM Preliminary ise Impact Analysis Report 36 Figure 2E: NSA & Short-Term Monitoring Locations

65 AECOM Preliminary ise Impact Analysis Report 37 Figure 3: 24 Hour Monitoring Locations
66 AECOM Preliminary ise Impact Analysis Report 38 Appendix D. 24-Hour ise Monitoring Results
67 AECOM Preliminary ise Impact Analysis Report Hour Monitoring Results - 24_WB Sound Pressure Level, db(a) Leq L10 L :00 17:00 18:00 19:00 20:00 21:00 22:00 23:00 0:00 1:00 2:00 3:00 4:00 5:00 6:00 7:00 8:00 9:00 10:00 11:00 12:00 13:00 14:00 15:00 16:00 17:00 18:00 19:00 20:00 21:00 22:00 23:00 Time of Day Figure 4A: 24 Hour Monitoring Results for 24_WB monitoring position Hour Monitoring Results - 24_EB Sound Pressure Level, db(a) Leq L :00 17:00 18:00 19:00 20:00 21:00 22:00 23:00 0:00 1:00 2:00 3:00 4:00 5:00 6:00 7:00 8:00 9:00 10:00 11:00 12:00 13:00 14:00 15:00 16:00 17:00 18:00 19:00 20:00 21:00 22:00 23:00 0:00 1:00 2:00 3:00 4:00 5:00 6:00 7:00 8:00 9:00 10:00 Time of Day Figure 4B: 24 Hour Monitoring Results for 24_EB monitoring position
68 AECOM Preliminary ise Impact Analysis Report 40 Appendix E. Modeled Receptors & Evaluated Barrier Locations

69 AECOM Preliminary ise Impact Analysis Report 41 Figure 5: Key Index - Modeled Receptors & Evaluated Barrier Locations Figure 5A Figure 5B Figure 5C Figure 5D Figure 5E

70 AECOM Preliminary ise Impact Analysis Report 42 Figure 5A: Modeled Receptors & Evaluated Barrier Locations

71 AECOM Preliminary ise Impact Analysis Report 43 Figure 5B: Modeled Receptors & Evaluated Barrier Locations

72 AECOM Preliminary ise Impact Analysis Report 44 Figure 5C: Modeled Receptors & Evaluated Barrier Locations


73 AECOM Preliminary ise Impact Analysis Report 45 Figure 5D: Modeled Receptors & Evaluated Barrier Locations

74 AECOM Preliminary ise Impact Analysis Report 46 Figure 5E: Modeled Receptors & Evaluated Barrier Locations