Photovoltaics Introduction
|
|
|
- Ashley Simpson
- 5 years ago
- Views:
Transcription


1 Photovoltaics Introduction
2 This course - contents Solar resource Physics of solar cells PV technologies Grid connected PV systems Stand alone systems Building integrated systems Concentration photovoltaics
3 This course - grading Test: 50% (15 Dez 2017) Lab work: 15% Home work: System design (15%) Presentation: Advanced topics (20%) and/or Final exam: everything (100%)
4 This course main references T. Markvart, Solar electricity, 2nd edition, John Wiley & Sons, 2000 M. Green, Solar cells operating principles, technology and system applications, USW 1986 R. Messeger, Photovoltaics system engineering, 2nd ed., 2003 A. Luque et al, Handbook of PV Science and Engineering, 2003 S. Bowden et al, PV CD ROM [pvcdrom.pveducation.org] Photon international magazine [
5 TODAY (Summary of this course) Brief history of photovoltaics PV global market PV in Portugal
6 Brief history of photovoltaics 1839: Edmund Becquerel, a French experimental physicist, discovered the photovoltaic effect. 1873: Willoughby Smith discovered the photoconductivity of selenium. 1876: Adams and Day observed the photovoltaic effect in solid selenium. 1883: Charles Fritts, an American inventor, described the first solar cells made from selenium wafers. 1904: Einstein published his paper on the photoelectric effect. 1916: Millikan provided experimental proof of the photoelectric effect. 1951: A grown p-n junction enabled the production of a single-crystal cell of germanium. 1954: Bell Labs researchers Pearson, Chapin, and Fuller reported their discovery of 4.5% efficient silicon solar cells.


7 Brief history of photovoltaics

8 Brief history of photovoltaics

9 Brief history of photovoltaics

10

11

12

13

14
15 Cost of photovoltaics Cost and price are very different, often not even correlated! There are 3 traditional measures of PV cost: Cost per Watt-peak installed Levelized cost of electricity Grid parity Morgan Bazilian et al, Re-considering the Economics of Photovoltaic Power, et, New Energy Finance working paper 2012
16 Cost per Watt-peak Units: /W Simple and objective to determine, usually refers to module cost (Spot market? Factory gate? End user?) and thus it does not represent full installation system cost. It is not comparable to other (renewable or fossil) energy sources due to the different capacity factor. Comparing different PV technologies not trivial.
 $0.")

17 Cost per Watt-peak Silicon: 1.43 $/Wp CdTe: 1.56 $/Wp (+9.1%!) $0.09 $0.08 Examples of other costs (= Balance of system, BOS) for different technologies
18 Levelized cost of electricity (LCoE) Units: /kwh The cost that really matters! But depends on location (insolation), financial costs (discount rate, subsidies, ) and assumptions on lifetime (25 or 40 years?) or O&M costs (10 or 30$/kW/year)
19 Grid parity Electricity prices will increase PV costs will decrease PV WILL BE COST COMPETITIVE. Wholesale or end-user electricity price? Socket parity defined as the point where a household can make 5% or more return on investment in a PV system just by using the energy generated to replace household energy consumption.
20 Grid parity Electricity prices will increase PV costs will decrease PV WILL BE COST COMPETITIVE. When? Where? At what time of the day/year?

21 Grid parity BNEF University - Breakthroughs in Solar Power [WWW Document]. Bloomberg New Energy Finance.


22 Global access to electricity in percent of local population Christian Breyer and Alexander Gerlach, Global overview on grid-parity, Prog. Photovolt: Res. Appl. (2012) DOI: /pip.1254


23 Population without access to electricity and local irradiation There is a huge global market for PV, even before we run out of gas & coal. Christian Breyer and Alexander Gerlach, Global overview on grid-parity, Prog. Photovolt: Res. Appl. (2012) DOI: /pip.1254

24 Although the best spots for PV applications are in the developing world, most systems are installed in the developed world. Why? Because it is expensive!

25 How can we reduce the GLOBAL PV OUTLOOK cost of photovoltaics? Although the best spots for PV applications are in the developing world, most systems are installed in the developed world. Why? Because it is expensive!

26 Technological improvement = 2010

27
28 Economies of scale

29 Public subsidies for the growth of the PV global market German market Japanese market
30 PV market - Japanese market in 1990s Incentives: from 9$/W (1994) to 2$/W (2003) (1G from government + 2G from companies) High grid electricity prices (19c$/kWh) Low interest rates, low inflation, modularity of construction industry, large semiconductor industry Lead to: Rapid decrease in PV prices (70% decrease from 1994 to 2003) 22-fold increase production capacity 32-fold increase installed capacity M.G. Rogol, Why did the solar power sector develop quickly in Japan?, MSc Thesis, MIT 2007
31 PV market German market in 2000s EPIA Brochure: Supporting Solar Photovoltaic Electricity - An Argument for Feed-in Tariffs, January 2008


32 Souce: Photon International INTRODUCTION PV market German market in 2000s 20x 15x
33 GLOBAL PV OUTLOOK German model replicated across Europe, making it the largest world market
34 PV market German market in 2000s PV electricity production today not relevant for German electricity: <0.5% (2007) CO 2 abatement cost: 760 /ton Massive invoice to be paid over 20 years: 63T German PV industry deficit: ~50% import 205k /year/new job created Recommendations: Stop feed-in tariff support for PV Increase investment into R&D A. Macintosh, D. Wilkinson, Searching for public benefits in solar subsidies, Energy Policy 39 (2011) M. Frondel, et al, Germany s solar cell promotion: Dark clouds on the horizon, Energy Policy 36 (2008)
35 Spanish market bubble Case study: what can I do wrong? Generous feed-in tariff But no maximum cap Overwhelming demand Abrupt end Fraud Huge cost to Spanish government Unbalanced demand/suppy for PV industry
36 Polisilicon feedstock bubble Increasing demand Competition with electronic silicon Closed industry (high installation cost, low ramp up) with few players Market showed slow reaction time Prices skyrockted (spot market: 500$/kg) New players, large investments New polisilicon technologies window opportunity Huge capacity expansion Falling prices Companies bankrupting.

37 GTM Research: The Global PV Market: Yesterday, Today, and Tomorrow
38 First Solar emergence Silicon-less technology Opportunity window for financial capitals Long R&D development Lower efficiency but lower cost for high throughput


39 First Solar emergence M. Green, Learning experience for thin-film solar modules: First Solar, Inc. case study, Prog. Photovolt: Res. Appl. (2010) DOI: /pip.1057
40 Emergence of PV industry in China
41 Emergence of PV industry in China Timeline of PV development in China 1. Low cost silicon wafers, cells and modules for the German (and other EU) market(s) 1. Stricter environmental and comparable quality products 2. Large scale and innovation 3. Creation of an internal market

42 Emergence of PV industry in China Cost advantageous comes mostly from economies of scale, not labour costs or dumping

43 But has been blamed on environmental record!

44

45 And has been blamed on dumping

46 Yet, the answer is also innovation!

47 Emergence of PV industry in China Share of China in world innovation in each segment of the PV industry [A. de la Tour et al, 2011]
48 Emergence of PV industry in China The fastest increasing PV market


49 Assessment of Incentives and Employment Impacts of Solar Industry Deployment, 2012 INTRODUCTION Consolidation of the global PV industry
50 PV market today German industry & market domination Polisilicon feedstock bubble Emergence of First Solar Spanish market bubble Emergence of chinese PV industry Manufacturers consolidation


51 PV market today German industry & market domination Polisilicon feedstock bubble Emergence of First Solar Spanish market bubble Emergence of chinese PV industry Manufacturers consolidation Chinese and Japanese market growth
52 PV in Portugal

53


54

55
56 Total installed PV capacity [MW] Annual variation INTRODUCTION % % 40% 40% % % % % 20% % % %
57 100% 80% 60% 40% 20% ON-GRID OFF-GRID 0%
58 PV in Portugal legal framework Roadmap: 2020: 1500MW Demonstration R&D projects: PV concentration (28?c /kwh) [2010] Micro-generation: Renewables-on-demand (19.6c /kwh/8 anos c /kwh/7 anos) [2008; 2010; 2013] Mini-generation DL 34/2011 March 8th] (<20kW: 25c /kwh; <250kW: auction) Self-demand DL 153/2014 October 20th]

59 Micro-generation - Mini-generation - Decreto Lei 363/2007
60


61
62 Self demand in Portugal

63 Self demand in Portugal
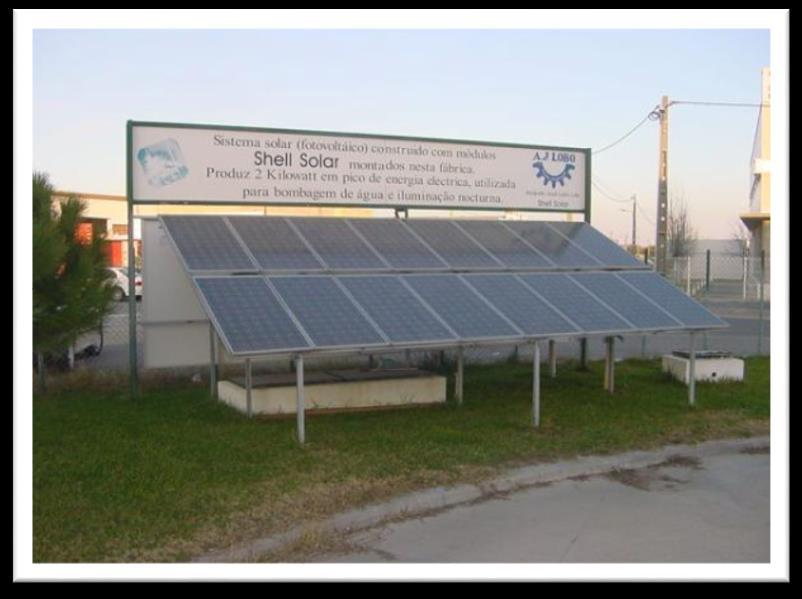
64 PV in Portugal flagship projects Selvagem Grande, Madeira (1983, 660W) Solar XXI, Lisbon (1989; 2.2kW)+ (2005; 12+6kW) Brinches, Serpa (2007; 11MW) Amareleja, Moura (2008; 46MW)


65


66


67


68

69


70 Manufacturers Open renewables Martifer Solar Magpower
71 Remarks - PV in Portugal Almost no manufacturing Commercialization & installation suffers from policy hesitations Current legal framework favors very small installations for residential users and industrial installations Untapped huge solar potential
72 Further reading (references online or available at course page) M. Green, Silicon Photovoltaic Modules: A Brief History of the First 50 Years, Prog. Photovolt: Res. Appl. 2005; 13: M.G. Rogol, Why did the solar power sector develop quickly in Japan?, MSc Thesis, MIT 2007 M. Frondel, et al, Germany s solar cell promotion: Dark clouds on the horizon, Energy Policy 36 (2008) EPIA Brochure: Supporting Solar Photovoltaic Electricity - An Argument for Feed-in Tariffs, January 2008 A. Jager-Waldau, Photovoltaics and renewable energies in Europe, Renewable and Sustainable Energy Reviews, 11 (2007) pvcdrom.pveducation.org