Low-Carbon Development in China: Policy Implementation and Institutional Innovation
|
|
|
- Adele Lillian Cox
- 5 years ago
- Views:
Transcription
1 Low-Carbon Development in China: Policy Implementation and Institutional Innovation Qi Ye Climate Policy Inistitative at Tsinghua, School of Public Policy and Management Tsinghua University, Beijing, China Brookings 清华大学气候政策研究中心 Institution, Washington, DC December 14, 2012
2 China s low carbon development puzzles 14 December
3 tce/10 4 RMB)(2005 price) Puzzle #1: Why a sharp reversal in energy and carbon intensity since 2005?
4 GW Puzzle #2: Why renewable energy targets have always been overachieved? Annual installation Accumulated installation Wind
5 Puzzle #3: What drives the x-shape curve: Emission increase vs. intensity decrease CO 2 Emission intensity tco2/10 4 yuan CO 2 Emission MtCO CO2 emission CO2 emission intensity year 0
6 Our answer: Economy + Policy + Implementation + Funding 5
7 Emission increase is driven by the economy CO 2 Emission MtCO CO2 emission year
8 tce/10 4 RMB)(2005 price) 1.4 The decreasing trend of energy and carbon intensity was explained as effect of low carbon policies
9 tce/10 4 RMB)(2005 price) The increase of energy and carbon intensity during the 10 th FYP was considered as the effect of economy
10 Energy Intensity ( ) (tce/10 4 RMB)(2005 price) th Five Year Plan Target: 12.3~16.3% Result: 23.5% 7 th Five Year Plan Target: 11.6% Result: 11.9% 8 th Five Year Plan Target: 8.6% Result: 25.5% 9 th Five Year Plan 10 th Five Year Plan 11 th Five Year Plan Target: 22.7% Result: 26.7% Target: 20.6% Result: -1.8% Target: 20% Result: 19.1% 0.0 9
11 Energy Intensity of China s Growth Tons of coal equivalent per million real RMB REFORM PERIOD BEGINS GREAT LEAP FORWARD ENERGY-INTENSITY REVERSES 0 Source: NBS, RHG Brookings Low-Carbon Chinese Development? 2
12 Two Categories of Explanation Variables Economic growth Export growth after WTO Urbanization Heavy industry growth EE Regulations Energy-saving target Energy-saving policies Implementation system

13
14 No policy target for EI from th Five Year Plan Target: 12.3~16.3% Result: 23.5% 7 th Five Year Plan Target: 11.6% Result: 11.9% 8 th Five Year Plan Target: 8.6% Result: 25.5% 9 th Five Year Plan Target: 22.7% Result: 26.7% 10 th Five Year Plan 11 th Five Year Plan Target: 20% Result: 19.1%
15 No policy target for EI from th Five Year Plan Target: 12.3~16.3% Result: 23.5% 7 th Five Year Plan Target: 11.6% Result: 11.9% 8 th Five Year Plan Target: 8.6% Result: 25.5% 9 th Five Year Plan 10 th Five Year Plan 11 th Five Year Plan Target: 22.7% Result: 26.7% Target: 20.6% Result: -1.8% Target: 20% Result: 19.1%
16 Energy Saving Rate Economy vs. Policy Implementation 9 th FYP 10 th FYP 11 th FYP 9 th FYP 10 th FYP 11 th FYP GDP growth rate(%) % Heavy industry growth(%) Urbanization growth(%) Export growth(%) Energy target specified In FYP Not in FYP In FYP Enforcement agencies Industrial Ministries No Industrial ministries Local governments
17 Policy target vs. implementation POLICY TARGET IMPLEMENTERS RULES TOOLS % in FYP Industrial ministries No target in FYP No specified implementers 2006-Present 20% mandatory Local governments Conventions Conventions Target responsibility system Commandcontrol, incentives Commandcontrol, incentives Commandcontrol, incentives
18 Changes in political and economic system Reform of State-Own Enterprises Organizational reform of the Central government Taxation reform Overall political system change
19 The Target Responsibility System September, 2006:State Council s Setting energy conservation targets approval to the reduction targets of energy consumption per unit of GDP of different regions during the State Council,NDRC, provincial governments 11 th FYP Basic element s of TRS Signing energy conservation target responsibility contracts Measuring and monitoring energy conservation performance Assessing energy conservation targets performance July 26, 2006:Commissioned by the State Council, NDRC signed energy conservation target responsibility contracts with 30 provincial governments and 14 central-government-owned SOEs. Nov 2007: Implementation plan of the accounting indicators system of energy consumption per unit of GDP, Implementation plan of the monitoring system of energy consumption per unit of GDP Nov 2007: Implementation plan of the assessment system of energy consumption per unit of GDP State Council(NDRC), provincial governments Statistical Bureaus are solely responsible NDRC,Ministry of Supervision, Ministry of Personnel, SASAC, AQSIQ, National Statistical Bureau, and Energy Administration Main content Key milestones Office Departments involved
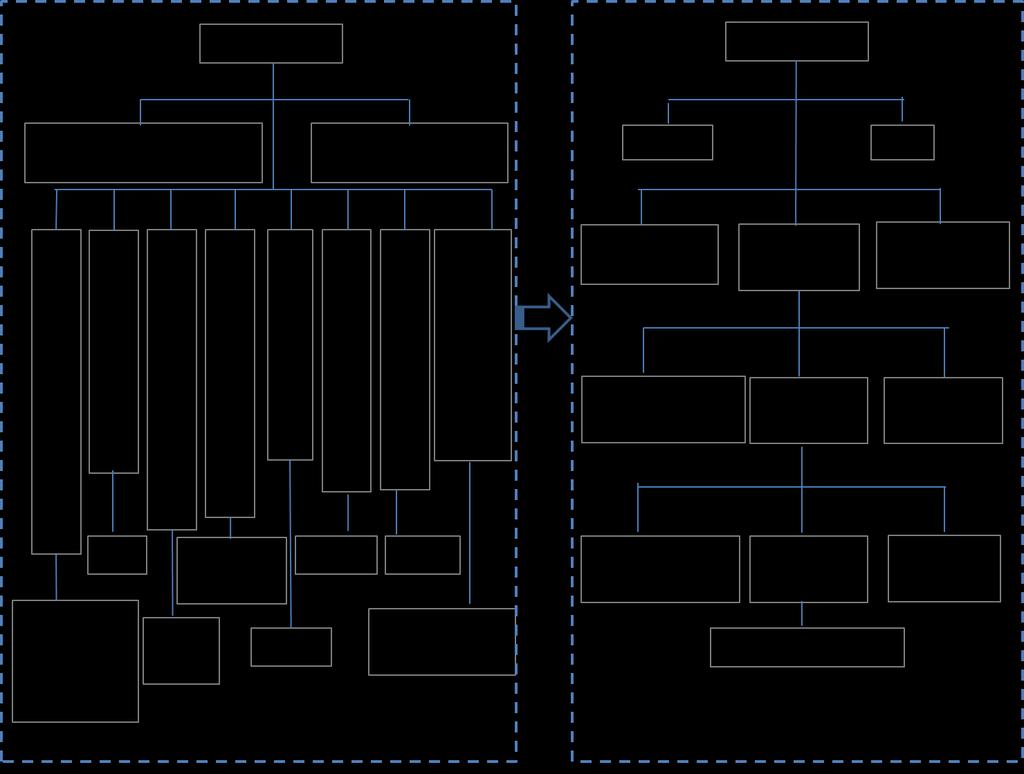
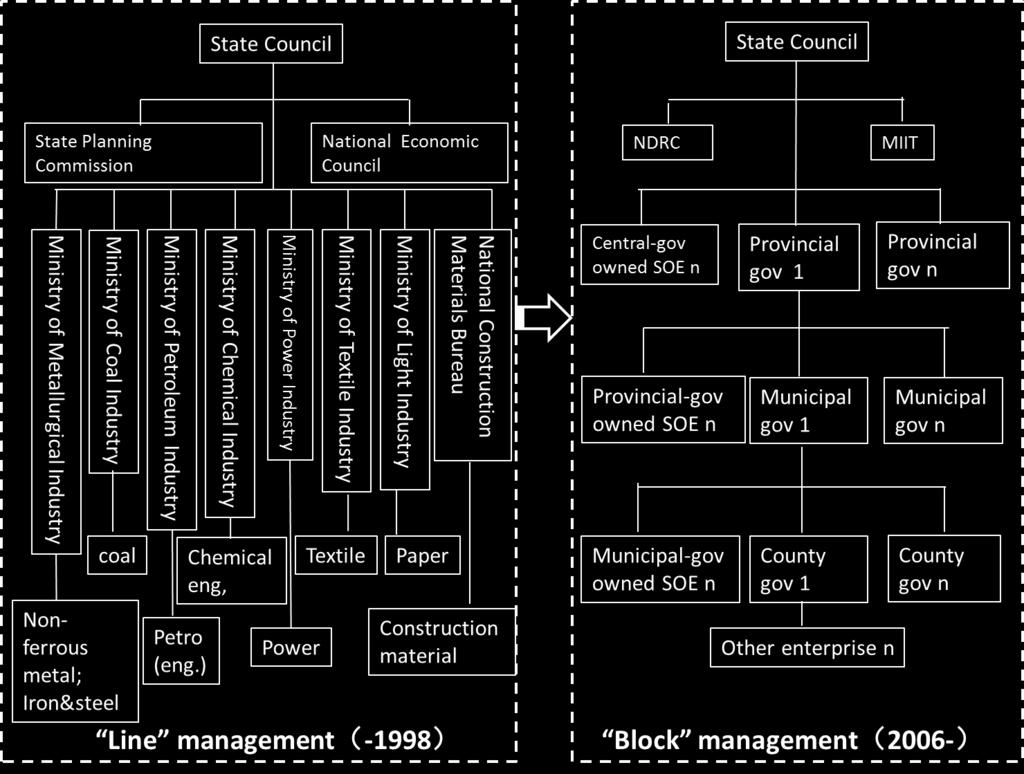
20 Implementation from Lines to Blocks
21 Energy-Saving Policy and Implementation POLICY TARGET IMPLEMENTE RS Various FYP Industrial ministries % in FYP Industrial ministries No target in FYP, 20.6% in plan 2006-Present 20% mandatory No specified implementers Local governments RULES Conventions Conventions Conventions Target responsibility system TOOLS Commandcontrol Commandcontrol, incentives Commandcontrol, incentives Commandcontrol, incentives
22 Energy Conservation Target Responsibility System is a major shift of the implementation mechanisms 14 December
23 Target Responsibility System (TRS) The TRS was established to achieve a national target of 20% energy intensity reduction by disaggregating it amongst subnational and local governments layer by layer, each government is held responsible to its upper level counterpart for achieving the target. TRS and complementary policies motivated local government and enterprises to reprioritize energy-saving, elevated leadership, build capacity, and increase funding. TRS is a top-down pressure transfer mechanism.
24 Local governments strengthened energy conservation capacity Number of local energy conservation All 31 provinces supervisory and law enforcement agencies 1000 and major cities, % of prefecturelevel cities, and % of counties have created energy 600 conservation 500 supervisory and 400 law-enforcement 300 agencies Before Source:Climate Policy Initiative at Tsinghua compiled and processed information from various sources. Part of energy conservation supervisory agency information was compiled by Xiamen Energy Conservation Center in November 2008 with original sources from National Energy Conservation Information Exchange and Collaboration Website.

25 Local governments increased fiscal support to energy conservation Unit:10 thousand Total fiscal funding to energy conservation from local governments amounted to 52.9 billion RMB, 7.4% of total. Local governments created special funds for energy conservation. Provincial fiscal funding directed to energy conservation grew Fiscal funding to energy conservation from all levels of governments in Jinan, Shandong , , ,000 50,000 Beijing special fund for energy conservation and emission reduction Shanghai special fund for energy conservation Source: Data are compiled and provided by ECO of Jinan City, Shandong Province Source: Annual Review of Low-carbon Development in China ( )
26 Local governments expanded energy conservation policy innovations Policy type Policy Complementary policies created Incentive Preferential policies for EPC Provincial governments met or exceeded the minimum cash award requirement mandated by the central government at 60RMB/tce as a complement to the 240 RMB/tce award by the central government. Restrictive Energy audits Many local governments expanded the coverage of the program to include not only the Top 1000 or enterprises but also all enterprises with energy consumption >5000 tce; Some provinces mandate periodic energy audits: Shandong, Gansu, Tianjin and Shanghai mandate energy audits every three years; Inner Mongolia and Qingdao every two years. Informational Energy conservation alert system Shandong Province piloted the alert system, which later became a nation-wide institution.
27 Billion RMB Enterprises strengthened energy conservation management capacity redirected capital towards energy conservation Enterprise investment in energy conservation th FYP 11th FYP Source : Annual Review of Low-carbon Development in China ( ); Annual Review of Low-carbon Development in China (2013)
28 Energy Efficiency Financing RMB billion on EE during the 11 th FYP. Government: 160 billion, International: 15 billion. Enterprises: 650 billion. In the 11 th FYP, energy efficiency activities achieved energy savings of 408 Mtce, accounting for 64% of the total energy savings. 27
29 Landscape of EE finance 28


30 Landscape of EE finance 29
31 Renewable Energy Finance 14 December
32 Renewable Energy Financing State-Owned Enterprises (SOEs) are the main project developers, bank loan is the most important finance channel. Wind power finance is a government-led approach, while PV power finance is manufacturer-driven. The size of 12 th FYP investment for renewable energy will increase by 37.5% compared with 11 th FYP. 31
33 Landscape for the renewable energy finance 1) The SOEs play major role as project developers. Share in accumulated installation: wind-80%, PV- 61% 2) Bank loan major source of finance for project developers, and accounts for more than three quarters of the total investment of wind and PV power projects. 32
34 Wind power and PV power finance approach Wind PV Banks Policy signal Long-term cooperation relationship Central government Quota Feed-in tariff State-owned energy enterprises Policy support Wind manufacturers Technology transfer Global market Ⅰ Land & tax preference Local government Ⅰ China PV Industry Ⅱ Financing Ⅲ Central government Domestic market Exchange resource for development Banks and capital market Local government Characteristics of wind finance: The central government plays the most vital role in promoting the development of wind power sector in China. The main parties in wind power sector are either state-owned or with government backgrounds, and state-owned developers and banks are the main project investors. Characteristics of PV finance: The financing approach for each phase is different. Phase Ⅰ:PV industry -- local government-led finance Phase Ⅱ:PV industry -- market-driven finance Phase Ⅲ:PV power -- manufacturer-driven finance 33
35 Comparison of Financing Patterns of PV Power and Wind Power PV power financing Wind power financing Financing pattern Manufacturer-driven Government-led Central government Passive leader Active leader Local government Promoter Participator Effect of manufacturers Support of domestic market Policy making Policy implementation Promoter None Bottom-up, pushed by manufacturers and local government The central government is pushed to eliminate obstacles for distributed PV systems Participator Yes Top-down, clear strategy Formed synergy 34
36 RE investment in 12 th FYP will increased by 37.5% compared with 11 th FYP RE investment comparison between 11th FYP and 12th FYP (Unit: billion Yuan) 11th FYP 12th FYP (prediction) Hydropower Large and medium scale hydro Small hydro Pumped power storage station 60 Wind power Solar power Biomass energy Solar heater & shallow layer geothermal energy utilization Total (in Yuan) Total (in US dollar) Note: the average exchange rate (6.46) in 2011 is used to change RMB into USD. 35
37 The Low-Carbon Pilots is a critical means for policy and institutional innovation 14 December
38 Encouraging results Nation YN CQ GY LN TJ BD HZ NC SX GD SZ XM HB Rate of decrease of energy intensity (%) during the 11 th FYP Rate of decrease of energy intensity (%) since Energy savings in 2011/ objective in the 12 th FYP Data source and notes: 1. Climate Policy Initiative at Tsinghua University collated and calculated the energy savings according to the pilots statistical yearbooks, statistical bulletins, 11 th FYPs and energy consumption per unit of GDP published in 2011, etc. 2. Yunnan: YN, Chongqing: CQ, Guiyang: GY, Liaoning: LN, Tianjin: TJ, Baoding: BD, Hangzhou: HZ, Nanchang: NC, Shaanxi: SX, Guangdong: GD, Shenzhen: SZ, Xiamen: XM, Hubei: HB 3. Data for Liaoning, Baoding, Nanchang and Xiamen haven t been collated.
39 Economy + Policy + Implementation + Funding 38
40 What we have learned The political system and the hierarchy of administrative system was used as the basis for TRS, the new implementation mechanism for energy-saving regulations. Wind power development was due to the creation of a profitable market. Solar PV industry and policy resulted from pulling of the market. 39


41 Conclusion: Effectiveness is the priority in China s low carbon green growth. 40
42 清华大学气候政策研究中心 Thank you!