Groundwater Quality of Potter County, PA
|
|
|
- Lionel Houston
- 5 years ago
- Views:
Transcription
1 Groundwater Quality of Potter County, PA Dan Galeone
2 Geology (resources, earthquakes, etc..) Geography (topo maps, spatial, etc.) Water (flooding, water quality, etc.) Biology (mammals, fish, etc.) The USGS provides unbiased, objective, and impartial scientific information to resource managers, planners, and other entities


3 USGS Science Stream Gage National Research Observation Towanda Well Bradford Co Cooperative Research
4 Introduction


5 Introduction Problem/Need Private land owners, local communities, conservation groups, consultants and natural resource agencies need a characterization of current chemical quality conditions of groundwater and to better assess natural and anthropogenic influences on local aquifers.


6 Introduction Problem/Need Before 2011 After 2011 Lack of Data Potter Co. Filling Data Gaps Clinton Co. Bradford Co. Lycoming Co. Pike Pike Co. Co. Wayne Co.
 drinking water (green), health proposed standards (yellow) and")
7 Introduction County Groundwater Studies Potter County The County purpose groundwater of this presentation baseline studies is to provide ongoing/funded a (1) drinking water (green), health proposed standards (yellow) and comparison the and remaining (2) a chemical counties of analysis research of interest groundwater (gray) for the for 47 Domestic development Wells of in a Potter regional County, groundwater Pennsylvania quality.
8 Study Area

 from the local geology, land use activities, and")
9 Sandstone Siltstone Mudstone Glacial extent Private wells pump groundwater that has picked up dissolved constituents (minerals, etc.) from the local geology, land use activities, and the well construction/plumbing.

10 GEOLOGY Pottsville Formation Burgoon Sandstone Shenango Formation Through Oswayo Formation, undivided Huntley Mountain Formation Chadakoin Formation Lock Haven Formation Catskill Formation
11 Open Water Land Use Developed, Open Space Developed, Low Intensity Developed, Medium Intensity Developed, High Intensity Barren Land Deciduous Forest Evergreen Forest Mixed Forest Shrub/Scrub Herbaceuous Hay/Pasture Cultivated Crops Woody Wetlands Emergent Herbaceuous Wetlands
12 Methods


13 Methods Private Water Supply Bacteria Copper/Lead


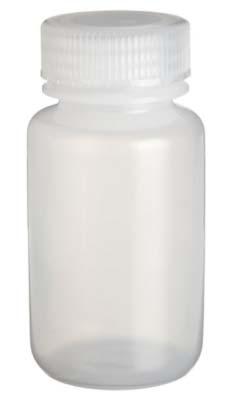
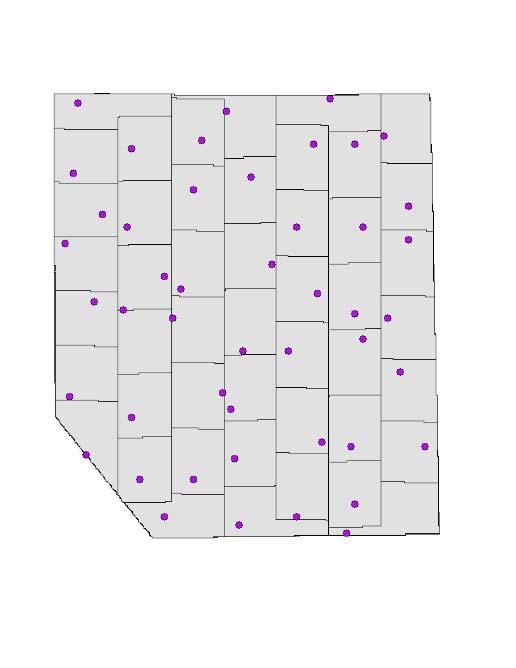
14 Methods Randomized Design Selection/Sampling Well Construction Verification 47 Cells Sampling Lab Analysis


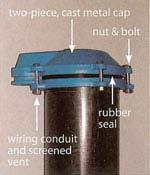
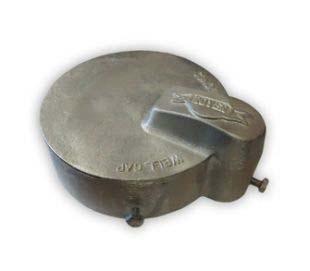
15 Well Construction Casing Water Bearing Zone Wayne County Open Hole Well Depth Potter County Pike County Lycoming County Clinton County Potter County Bradford County
16 WELLS SAMPLED Sampled wells Other wells In database When: May Sept. 2017
17 Drinking Water Health Standard Comparison
 MCL Iron (ug/l) SMCL Maximum Contaminant Levels are set because elevated concentrations of these constituents may cause adverse health effects Secondary Maximum Contaminant Levels")
18 Drinking Water Standards USEPA Drinking Water Standards were developed to ensure safe water for public water supplies and can be used as a guide for private domestic wells. 0 Arsenic (ug/l) MCL Iron (ug/l) SMCL Maximum Contaminant Levels are set because elevated concentrations of these constituents may cause adverse health effects Secondary Maximum Contaminant Levels are set for aesthetic reasons and elevated concentrations of these constituents may impart an undesirable taste or odor to water

19 Inorganics Total Dissolved Solids Total Dissolved Solids Brackish Seawater Freshwater

20 Total Dissolved Solids (MG/L) 2% SMCL = 500 MG/L 15% 40% 43% < < <500 >= 500 * All graphics are provisional until verified and analyzed for publication


21 Inorganics ph/alkalinity Corrosive Seawater ph Alkalinity Scale Forming
22 Acidic ph Neutral Basic Alkalinity (mg/l) Seawater Low Moderate High
23 Inorganics Majors Ions/Metals Major Ions Nutrients Trace Metals

24 INORGANICS MCLs Below MCL Above MCL PERCENT Antimony Arsenic Barium Beryllium Cadmium Chromium Copper Fluoride Lead Nitrate N Nitrite N Selenium Uranium * All graphics are provisional until verified and analyzed for publication


25 Arsenic, dissolved, micrograms/liter Median MCL Non Detects POTTER CLINTON BRADFORD LYCOMING PIKE WAYNE

26 INORGANICS SMCLs Below SMCL Above SMCL Aluminum Chloride Copper Fluoride Iron Manganese Silver Sulfate Zinc * All graphics are provisional until verified and analyzed for publication PERCENT


27 Bacteria Total Coliform Fecal Coliform v E coli v MPN/100 ml = Most Probable Number of Bacteria in 100 milliliters

28 Total Coliform Bacteria (MPN/100 ml) Total Coliform 7% 13% 33% 13% 17% 17% All graphics are provisional until verified and analyzed for publication <1 1 <10 10 <50 50 < < 1,000 > 1,000


29 Total Coliform Bacteria (MPN/100 ml) POTTER CLINTON BRADFORD LYCOMING PIKE WAYNE MCL

30 E coli Bacteria (MPN/100 ml) Total Coliform 4% 2% Fecal Coliform v E coli v 22% 72% < 1 1 <10 10 <100 > 100 * All graphics are provisional until verified and analyzed for publication


31 Radiochemicals 4,000 pci/l Radon Gas Radium Uranium 0.4 pci/l
32 Recommended MCL for states with indoor program 0% above 4,000 pci/l RADON Radon 222 (pci/l) Highest = 3,140 pci/l 85% above 300 pci/l Samples 300 pci/l recommended MCL for states with no indoor program

33 Dissolved Hydrocarbon Gases Gases

34 Methane, MG/L < 2 2 <7 >= 7 9% 2% Maximum detected = 11 MG/L 89% Biogenic * All graphics are provisional until verified and analyzed for publication Thermogenic
35 Volatile Organic Compounds (VOCs) VOCs Revise Common Sources: Septic systems Urban land Hazardous waste sites Underground storage tanks

36 USGS NAWQA Study Volatile Organic Compounds in the Nation's Ground Water and Drinking Water Supply Wells Samples collected across U.S.A. 3,500 Domestic and public supply wells (2/3 domestic) 20% wells had detectable VOCs at 0.2 ug/l detection level 50% wells had detectable VOCs at 0.02 ug/l detection level

37 VOCs 3,196 Results 4 Detections in 3 Samples.... Each sample was analyzed for 68 different VOCs 47 samples Only 6% of wells in Potter had detectable (at 0.5 ug/l) VOCs
38 Chemical Analysis of Groundwater


39 Interpretive Analysis & Report
40 Summary
41 Summary Major Ions Nutrients Radchems VOCs Gases ph Alkalinity BacT Trace Metals 47 wells were sampled in Potter County to characterize the quality of the groundwater Results indicate generally good groundwater quality for the wells sampled in Potter County Exceedances for MCLs (Total Coliform, E coli, Arsenic, Barium) and SMCLs (TDS, Chloride, Aluminum, Iron, and Manganese) along with the results for radiochemicals, dissolved gases and VOCs were consistent with values from other county studies A detailed chemical analysis and interpretation of the results will be published in a USGS report
42 Thank You Dan Galeone


43 Partners This study could not have been possible with the voluntary cooperation of the 47 well owners of Potter County and the support of the following partners: PADEP