INDOOR AIR QUALITY TESTING AT CARLISLE COUNTY ELEMENTARY SCHOOL
|
|
|
- Derek Phillips
- 5 years ago
- Views:
Transcription

1 INDOOR AIR QUALITY TESTING AT CARLISLE COUNTY ELEMENTARY SCHOOL For: Keith Shoulders Carlisle County Schools 4557 State Route 1377 Bardwell, Kentucky Testing Performed By: Christopher K. Adkins Air Source Technology, Inc. 160 Prosperous Place, Suite 201 Lexington, Kentucky Report Date: September 14, 2009
2 Table of Contents Table of Contents Section Page INTRODUCTION...1 SAMPLING PROTOCOL...2 DISCUSSION OF RESULTS...5 CONCLUSIONS...9 REFERENCES...10 LABORATORY REPORT FORMS... Appendix A PHOTOGRAPHS... Appendix B SAMPLE LOCATIONS... Appendix C
3 Introduction Introduction Air Source Technology, Inc. conducted indoor air quality monitoring in selected areas of Carlisle County Elementary located at 4557 State Route 1377, Bardwell, Kentucky Chris Adkins, of Air Source Technology, Inc. (ASTI), conducted the site visit and testing on the afternoon of August 24, Mr. Adkins met with Dr. Keith Shoulders, Superintendent of Carlisle County Schools, to discuss the desired sampling and the report protocols. The complete Scope of Work included the following monitoring: seven (7) IAQ meter tests for airborne carbon dioxide, temperature, and relative humidity; seven (7) culturable airborne fungi (mold) samples. The testing was conducted during the day when the building was occupied by students. A Note Regarding ASTI Diagnostic Services: In determining the causes of Indoor Air Quality (IAQ) problems, ASTI may provide analyses of building characteristics and may present documents that describe building construction methods. These analyses may potentially provide IAQ solutions, including structural diagrams and construction techniques. These documents are no substitute for professional consultation regarding Heating Ventilation and Air Conditioning (HVAC) or various building construction issues. ASTI always recommends the use of a duly licensed professional engineer, contractor, or architect whenever such structural or HVAC solutions are presented. This report is intended to document site survey results and to provide the owner with information and options, which will enable them to make an informed decision whether professional assistance is needed or desired. A formal mold remediation specification/plan may be required by professional remediation contractor. Also, for legal and professional reasons, the remediation contractor may require additional testing/sampling. The information and recommendations in this report supersede all other communications. Amendments and revisions to this report will be issued if required. 1

4 Sampling Protocols Sampling Protocols TSI MODEL 7545 IAQ CALC MONITOR The Model 7545 IAQ Calc Monitor is a hand-held portable instrument that simultaneously measures carbon dioxide, carbon monoxide, temperature, and relative humidity. It can be used to display real-time readings or to record readings for immediate and/or later analysis. The Model 7545 measures carbon dioxide by relying on one of the natural properties of CO 2 molecules: CO 2 molecules absorb light at a specific wavelength of 4.26 m. This wavelength is in the infrared (IR) range. High levels of CO 2 molecules absorb more light than low concentrations. This technique is called non-dispersive infrared (NDIR) detection. The CO sensor is an electro-chemical type, which is calibrated to a range of 0 to 500 ppm. The instrument is calibrated with reference gases prior to daily use to ensure accuracy in the field. Model 7545 Specifications Temperature and relative humidity measurements help determine thermal comfort Calculates % outside air from either CO2 or temperature Directly calculates dew point and wet bulb temperatures Electrochemical sensor measures CO (Model 7545) Model 7545 displays up to three parameters Model 7545 displays CO & CO2 2

5 Sampling Protocols BIOAEROSOL SAMPLES Sampling was conducted by drawing 100 liters of air per minute for approximately three minutes through a Graseby Anderson N6 single stage bioaerosol sampler using a SAS Super 100 air sampler. The SAS Super 100 provides high volume sampling to enable the high analytical sensitivities required for compliance with regulations and statistical significance. The culturable results obtained by the SAS Super 100 are directly comparable to traditional Andersen N6 sieve collection methodology which helps in making interpretation based on the vast amount of historical data available. A petri dish containing an agar medium appropriate for the microorganisms that may be encountered is placed in the instrument and a sample of air drawn. Malt extract agar {MEA} plates are suitable for fungal growth, while tryptic soy agar {TSA} is suitable for bacterial growth. After air sampling the samples were shipped overnight Federal Express to the lab. At the lab, the petri dish was then removed, inverted in its cover, incubated and counted by an accepted method. The plates are incubated at 25 C. Characterization was made within 48 hours after inoculation and completed in 7-10 days. Identification of fungi is based on colony and spore morphology as well as spore formation. Presumptive bacterial identification is based on the gram stain, and colony and cell morphology. Analysis was performed by Environmental Microbiology Laboratory, Inc. (EM Lab) located at 1150 Bayhill Drive, Suite 100, San Bruno, CA EM Lab is accredited by the American Industrial Hygiene Association (AIHA) in Environmental Microbiology. The Director of Aerobiology, Dr. Harriet Burge, is one of the leading microbiology and mycology professionals in the United States. 3
6 Sampling Protocols VISUAL SURVEY PROTOCOL The onsite limited visual survey generally followed a protocol as outlined by the Environmental Protection Agency s Mold Remediation in Schools and Commercial Buildings (EPA # 402-K : March 2001). No formal questionnaires or occupant interviews were conducted. The building conditions within selected areas were noted for any visible signs of past or present water damage, visible filamentous fungal growth, poor housekeeping, poor ventilation, and inadequate filtration. Only selected areas inside the building envelope were surveyed. Possible sources of water intrusion were noted. If observed, conditions that warrant action or surveillance were documented during the visual survey. Other potential irritants and sources of emission were examined to determine the need for further evaluation.. 4
7 Results Discussion of Results The following observations and history were noted at the time of the site visit: Please see Appendix B for photographs. 1. Dr. Keith Shoulders reported that visible suspect fungal growth had been observed on ceiling tile located in the 5 th grade classroom. 2. It was reported that the affected ceiling tile had been removed/replaced. 3. Water stains were noted on ceiling tile in several locations in the school. TSI MODEL 7545 IAQ METER CARBON DIOXIDE (CO 2 ) Carbon dioxide (CO 2 ) is a normal constituent of exhaled breath and, if monitored, can be used as a screening technique to evaluate whether adequate quantities of fresh outdoor air are being introduced into a building or work area. The outdoor, ambient concentration of CO 2 is usually parts per million (ppm). Usually the CO 2 level is higher inside than outside, even in buildings with few complaints about indoor air quality. However, if indoor CO 2 concentrations are more than 1000 ppm (3 to 4 times the outside level), there is a possibility of inadequate ventilation and complaints such as headaches, fatigue and eye and throat irritation are frequently found to be prevalent. The CO 2 concentration itself is not responsible for the complaints. However, a high concentration of CO 2 may indicate that other contaminants in the building may also be increased and could be responsible for occupant complaints. If CO 2 concentrations are maintained below 600 ppm, with comfortable temperature and humidity levels, complaints about air quality should be minimal. If CO 2 levels are greater than 1000 ppm or 700 ppm above outdoor levels, complaints may occur and thus these levels are often used as upper limit guidelines. This does not mean that if this level is exceeded the building is hazardous or that it should be evacuated, but rather this level should be a guideline that helps maximize comfort for all occupants. Levels between 600 ppm and 1000 ppm are less clearly interpreted. The Occupational Safety and Health Administration (OSHA) has established 5,000 ppm as the Permissible Exposure Limit (PEL) for CO 2. To put this into perspective, ASTI frequently conducts IAQ surveys in Kentucky schools and we often observe elevated levels (2000 to 3000ppm) of Carbon Dioxide (CO2, not 5
8 Results to be confused with Carbon Monoxide, CO) in classrooms in the afternoon. While levels of 2000ppm to 3000ppm are not optimal, they are somewhat below the OSHA Personal Exposure Limit (PEL), which is 5000 ppm for an 8-hour time-weighted average (TWA) exposure. Typically such levels (2000 to 3000ppm) are observed in the afternoon after the children have been in the classroom for most of the day and are not representative of an 8-hour exposure. TEMPERATURE AND RELATIVE HUMIDITY The American Society of Heating, Refrigeration, and Air-conditioning Engineers (ASHRAE) has published guidelines describing thermal environmental conditions, (ASHRAE Standard , Thermal Environmental Conditions for Human Occupancy). These guidelines are intended to achieve thermal conditions in a given environment that at least 80% of the persons who occupy that environment will find acceptable or "comfortable." ASHRAE recommendations suggest when a building environment is occupied by sedentary or slightly active persons, and when the relative humidity is at 50%: The operating temperature to achieve thermal acceptability (comfort zone) should be 68 to 74 F in winter and 73 to 79 F in summer. If the operating temperature is outside this range, (at either end-point), then more than 20% of healthy people occupying the area are likely to experience some degree of discomfort. ASHRAE recommendations suggest that relative humidity ranges from 20-60% present a comfort zone considered to be both comfortable and healthful. ASHRAE's recommended design conditions are an effective temperature and dry bulb temperature of 76 F (24.5 C), a relative humidity of 40 percent, and an air circulation rate of less than 45 feet per minute. Relative humidity levels below 20 percent are associated with increased discomfort and drying of the mucous membranes, which brings about coughing, itching, and sore throats. High humidity may possibly provide a growth medium for bacteria and fungi. 6
9 Results Location TSI MODEL 7545 IAQ Monitor Temperature ( F) Relative Humidity (%) Carbon dioxide (ppm) Office Kindergarten Classroom nd Grade Classroom rd Grade Classroom Computer Lab th Grade Classroom Outdoors (Baseline) IAQ Guideline Temperature and relative humidity were all within recommended guidelines indoors. Carbon dioxide was elevated above recommended guidelines; however measurements were taken in the afternoon after nearly a full day of occupation. BIOAEROSOLS There are no "official standards of guidelines" for fungal or bacterial bioaerosols or combinations of both. A general regulatory standard or recommended guideline for bioaerosols is not scientifically supportable because: a) culturable microorganisms and countable biological particles do not comprise a single entity (they are complex mixtures); b) human responses to bioaerosols range from innocuous effects to serious depending on the specific agent and the occupants susceptibility to it; c) it is not possible to collect and evaluate all bioaerosol components using a single method; and d) at present, information relating culturable or countable bioaerosol concentrations to health effects is generally insufficient to describe exposure-response relationships. Generally speaking however, if visible microbial growth can be seen it should be addressed and corrected. 7
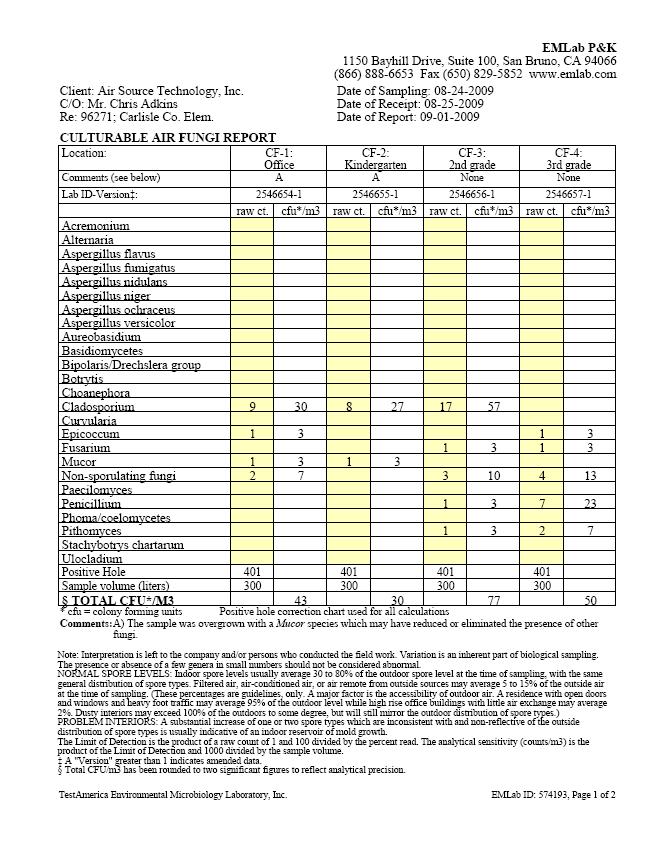
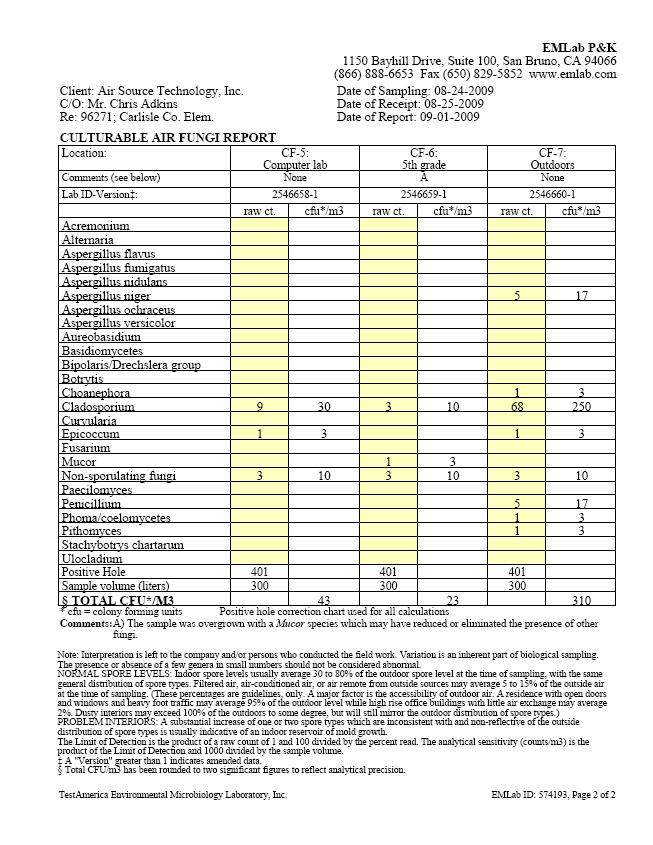
10 Results Airborne Fungi Sample # Location Fungi (CFU/M 3 ) CF-1 Office 43 CF-2 Kindergarten Classroom 30 CF-3 2 nd Grade Classroom 77 CF-4 3 rd Grade Classroom 50 CF-5 Computer Lab 43 CF-6 5 th Grade Classroom 23 CF-7 Outdoors (Baseline) 310 Low levels of common environmental airborne fungi were identified indoors and outdoors. Cladosporium was the dominant species in all samples, with exception to CF- 4. All other fungal genius of fungi were identified at levels too low to be statistically significant. Indoor amplification of airborne fungi was not currently indicated from these air sample results. Keep in mind this was a snapshot and represents the day of testing only. 8
11 Conclusion Conclusions Within the limits of the observations, the testing conducted, and the analyses performed, the air quality at the Carlisle County Elementary was found to be within normal ranges and recommended guidelines for all parameters tested, except for elevated Carbon dioxide levels which likely trend upwards during the day. For our school clients, we recommend the maintenance staff become familiar with the EPA document, Mold Remediation in Schools and Commercial Buildings, which provides excellent down-to-earth information about dealing with mold in the school environment. To Carlisle County Schools in general, Air Source Technology, Inc. makes the following recommendations that address typical indoor air quality concerns: 1. If dealing with mold (suspect or confirmed) always use the proper Personal Protective Equipment (PPE). According to Reference No. 2, EPA s mold remediation guidelines, this includes at least a N95 respirator, rubber gloves, and goggles. Refer to Reference No. 2, the EPA mold remediation document, for guidance in determining if professional assistance might be warranted or desired. 2. As discovered, clean any visible microbial contamination with a detergent, biocide and/or mild bleach solution (1 part bleach to 10 parts water), depending on the surface. Refer to Reference Numbers 2 & 4 (both are governmentsponsored documents, which are available free from the Internet) for additional information regarding remediation techniques and the need for professional assistance. 9
12 References REFERENCES 1. Guidance for Clinicians on the Recognition and Management of Health Effects Related to Mold Exposure and Moisture Indoors, 2004, University of Connecticut Health Center with EPA sponsorship and input, 2. Environmental Protection Agency (EPA) web site, including mold remediation guidelines: 3. Centers for Disease Control & Prevention (CDC) web site: 4. Bioaerosols, Assessment and Control, 1999, American Conference of Governmental Industrial Hygiene (ACGIH). 5. Assessment, Remediation, and Post-Remediation Verification of Mold in Buildings AHIA Guideline , 2004, American Industrial Hygiene Association (AIHA). 6. Mahooti-Brooks, N., Storey, E., Yang, C., Simcox, N., Turner, W., Hodgson, M. Characterization of Mold and Moisture Indicators in the Home. Journal of Occupational and Environmental Hygiene, 1: December Standards of Practice for the Assessment of Indoor Environmental Quality, Volume I: Mold Sampling: Assessment of Mold Contamination, 2nd Edition, June 2003, Indoor Environmental Standards Organization (IESO). 8. Damp Indoor Spaces and Health, 2004, The National Academies Press, Institute of Medicine 9. EPA Fact Sheet: Ventilation and Air Quality in Offices: access on the Internet. 10. Ventilation for Acceptable Indoor Air Quality, ANSI/ASHRAE Standard , The American Society of Heating, Refrigeration, and Air Conditioning Engineers, Inc. (ASHRAE) 10
13 Laboratory Results Appendix A Laboratory Analysis Results
14 Laboratory Results
15 Laboratory Results
16 Laboratory Results
17 Laboratory Results
18 Laboratory Results
19 Laboratory Results
20 Photographs Appendix B Photographs


21 Photographs Photograph #1: Sample CF-1 collected in the office. Photograph #2: Water stained ceiling tiles located in the office area. Photograph #3: Sample CF-2 collected in the Kindergarten classroom. Photograph #4: Sample CF-3 collected in the 2 nd Grade classroom. Photograph #5: Sample CF-4 collected in the 3 rd Grade classroom. Photograph #6: Sample CF-5 collected in the Computer Lab.


22 Photographs Photograph #7: Sample CF-6 collected in the 5 th Grade classroom. Photograph #8: Water stains on ceiling tiles in the 5 th Grade classroom. Photograph #9: Sample CF-7 collected outdoors. Photograph #10: Area of standing water against the building.
23 Sampling Locations Appendix C Sampling Locations
24 Sampling Locations