Air pollution Measurements and Emission Estimates. Dr. Ahmed Abu Foul
|
|
|
- Sabrina Young
- 5 years ago
- Views:
Transcription
1 Air pollution Measurements and Emission Estimates Dr. Ahmed Abu Foul
2 Types of measurements There are two types of air measurements: 1) Ambient measurement, Ambient Monitoring (concentration of pollutants in the air the public breathes) 2) Source measurement, source testing Both are required in the ambient Air Quality standard philosophy. Concentration must be measured to determine whether that air is really safe to breath This means that air quality should meet the NAAQS.
3 To achieve that: Control and Monitoring of Air pollutants should be implemented. To control pollutant concentrations: The time, the place, and the amount of emissions, should be regulated. The emission rates of various sources of air pollutants (i.e. factories, power plants, automobiles) must be regulated and measured.
4 Why measurements are needed? 1) Legal Requirements 2) Evaluation of air pollution control devices Note: The control devices should be bought with guarantees. The buyer will usually not pay for the control devices until tests demonstrate that the device meets these performance guarantees in actual plant operation.
5 The principal requirement of a sampling system is to obtain a sample that is representative of the atmosphere at a particular place and time and that can be evaluated as a mass or volume concentration. The sampling system should not alter the chemical or physical characteristics of the sample in an undesirable manner.
6 The major components of most sampling systems are: 1) An inlet manifold 2) An Air mover 3) A collection medium 4 ) Flow measurement device
7 (1) The inlet manifold transports the material from the ambient atmosphere to the collection medium or analytical device in an unaltered condition, all inlet of ambient air must be rainproof. (2) The air mover provides the force to create a vacuum or lower pressure at the end of the sampling system (pumps).
8 (3) The collecting medium, may be solid or liquid sorbent for dissolving gases, a filter surface for collecting particles, or a chamber to contain an aliquot of air for analysis. (4)The flow device measures the volume of air associated with the sampling system.
9
10 A Representative sample In Air measurements there are two important problems 1)To obtain a suitable representative sample 2)The determination of the concentration of the pollutant of interest in it correctly. The representative ambient air sample has been the topic of legal and technical controversy.
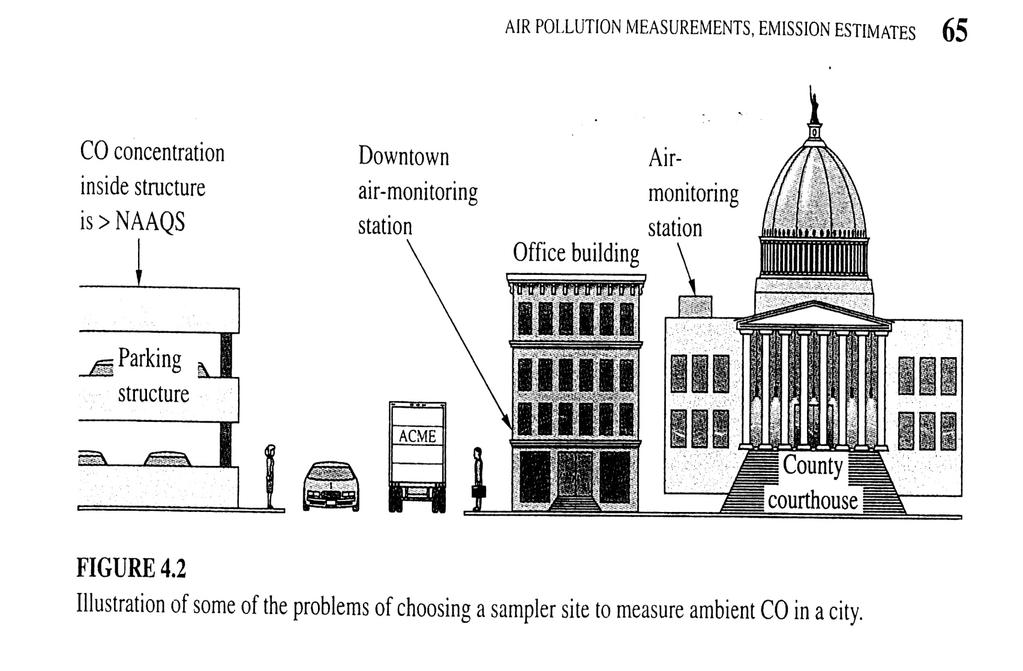
11 1. The air inside the parking structure normally contains much more CO than the NAQQS allows for ambient air. If the sample was taken from inside such a parking structure, the result will show great violation of NAAQS. 2. If the sample is taken directly across the street from such a structure, in most cases the concentration will be an order of mangitude less than inside the structure.
12 3. A block away, the concentration will be even less. 4. On the side walk directly adjacent to the structure, the concentration may be twice as high as on the opposite side of the street.
13
14 Which of these locations is suitable for obtaining a sample of ambient air? Generally the ambient air sampler should be located at the place to which the public has free access where the pollutant concentration is highest. This means that all indoor spaces and plant sites which the public has no access are excluded.
15 Where can we put an ambient air monitor? In Place: 1- Has the power 2- Shelter from rain and snow 3- Constant temp. environment 4- Easy access from monitoring personnel 5- Protection from vandalism 6- If possible free rent place
16 The traditional place has been the roof of county health building or of the county courthouse. Unfortunately the concentration of the auto-related pollutants measured there is often much lower than at street levels at the busiest intersection downtown.
17 There are EPA guidelines for the proper placement of intake for air samples that are meant to represent ambient air. For example: CO measurements must be made at street level, downtown. In Fig. 4.2 the air pollution control agency could meet this requirement by renting an office on the second floor of a downtown building and hanging its sampling probe out of the window, about 10 feet above the sidewalk.
18 In source testing: The representative sample problem is equally difficult. If the gas flow in large industrial smokestack is steady, well mixed across the diameter of the stack then the sample taken can be representative any time and at any place. But most of such stacks have variation in velocities and concentrations from point to point, and from time to time. Therefore, many separate measurements must be made and averaged.
19
20
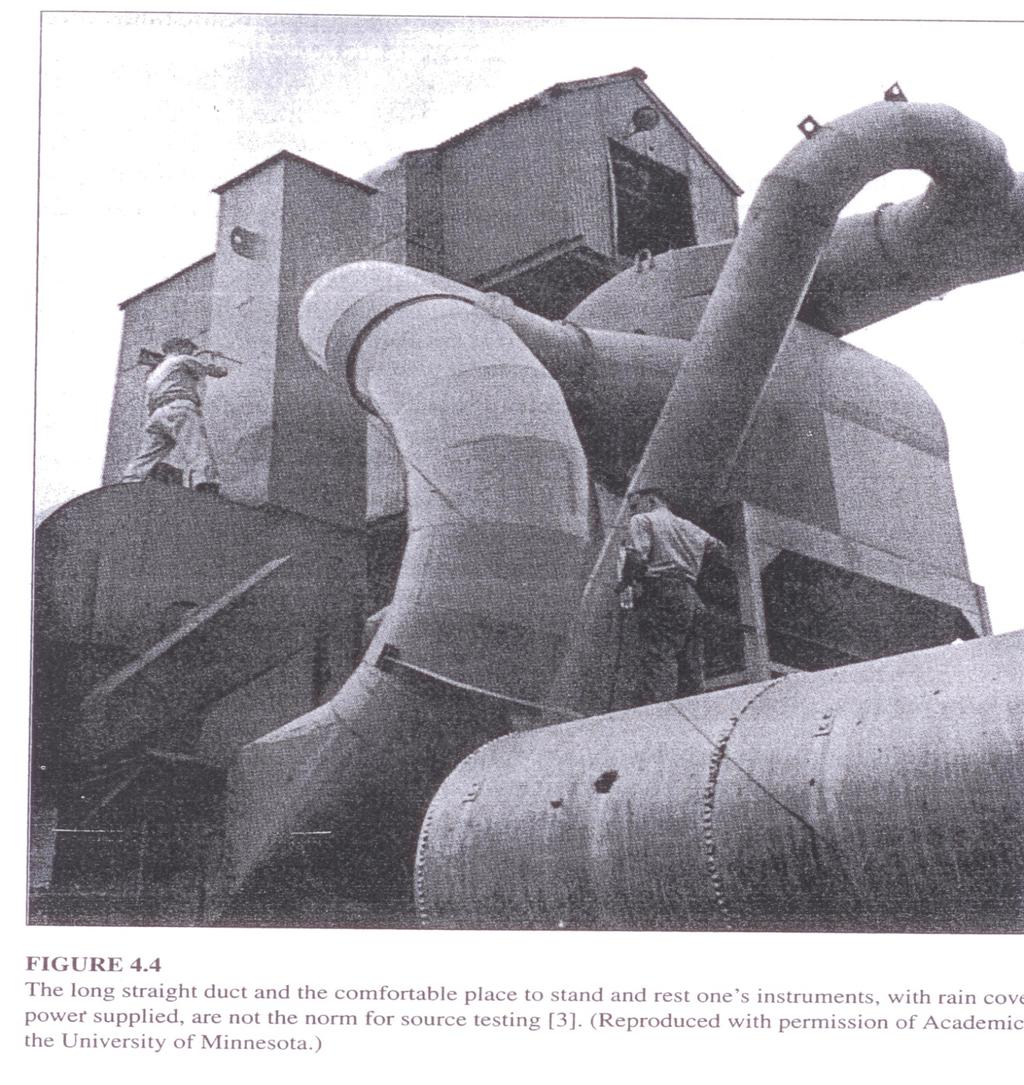
21 But more typical sampling situation is shown in figure 4.4. In such ducts, one cannot find a place far downstream from any change of direction or other flow disturbance. Even 36 feet farther downstream, the velcity and concentration data do not indicate that the flow become uniform, although nonuniformity is much less than it was close to the bend. Presumably, if one went far enough downstream in this duct, one would find that the flow velocities and particle concentrations had become uniform. If one could do that, He should.
22 In newer plants, designers sometimes considered the problems of obtaining a uniform gas flow and have provided access and a suitable location for the source sampler to place the required instruments.
23
24 4.2 Getting the representative sample to the detector Many sampling instruments have some kind of devices on the inlet to exclude unwanted materials. e.g.: Insects sucked into a particulate sampler nozzle lead to erroneously (incorrectly ) high readings. Air often contains large dust particles, which are of little health concern, that weigh more than all of the fine particles in the same air sample, which are of serious health concern.
25 The U.S. EPA modified its particulate samplers in 1987 and in Before 1987, the sampler inlet was designed to exclude all particles larger than 50 micron. The quantity sampled was called Total Suspended particulate ( TSP). The 1987 modification changed the inlet to exclude all particles larger than 10 micron, the quantity sampled is called PM 10 (particulate matter 10 micron or smaller). The 1997 modification changed the inlet again to exclude all particles larger than 2.5 micron.
26 In sampling devices, gases may condense in the sampling device, or react with the solids they encounter there. Many combustion stack gases have a high water content and will condense on the walls of unheated sampling probe. In such cases, probes are normally heated to prevent this. Acid gases like SO 2 will react with alkaline solids on a filter, thus increasing the weight of solids on the filter.
27 If a grab sample taken in the field is brought to the lab for analysis, the sample container must not react with or modify its content in transit. Even apparently inert materials like glass react with some air pollutants.
28 4.3 Concentration Determination After representative sample has been obtained, the concentration of the pollutant in it must be determined. Some pollutants, can be measured easily by real time instruments. Most of these operate optically, due to absorbance and transmittance at a particulate wavelength. i.e. Spectrophotometric methods.
29 The problem of interferences The problem of interferences measurements is not trivial. in air pollutants Even in the spectrophotometric methods, some interferences gases can be absorbed at the same wavelength. For example: Measuring SO 2 gas in N 2 gas is easy. One passes the gas through a dilute solution of NaOH, in which the reaction is SO 2 + 2NaOH Na 2 SO 3 + H 2 O the change in NaOH concentration is measured by simple acid base titration.
30 However, if the problem is to measure SO 2 in air, CO 2 in the air will also react and cause interference by the reaction: CO 2 + 2NaOH Na 2 CO 3 + H 2 O If CO 2 concentration in air in this case is steady and known, a correction could be made in principle (but not in practice).
31 But in the other cases, the concentration of the interfering components may not be known. The US EPA adopted a new method for measuring NO 2 and had to withdraw it when it became clear that the method was not adequately protected from such interferences.
32 4.4 Averaging If we are measuring ambient air quality with real-time instruments, we generally want to know the average concentration over some period of time so that we can compare it with the applicable ambient standards, which all have some measuring period. Average concentration = c avg = (1/ t) c.dt c= the instantaneous concentration t= the time of measurement
33 Most of real-time instruments present their results as an electronic signal that can be easily averaged by built-in electronics for any suitably chosen averaging time. The older instruments for gases as well as the current instruments for particulates are not real-time instruments, but rather are averaging instruments.
34 For example: In EPA method for PM 2.5 sampling, it consists of: - Special inlet that exclude particles >2.5 micron -A filter -A fan -A flow measuring device -Suitable housing A pre-weighed filter is placed in the filter holder, and air is sucked through it for 24 hours at a measured rate.
35 Example 4.2:
36 Notes on example 4.2 -The sample size is small -The average value 21 µg/m 3 is 84% of the annual avg. NAAQS. -Measured change in filter weight is only 0.5 mg. Therefore, high quality weighing and sample humidity control is needed. -If the weighings are only reliable to ±100 μg, then our confidence in the difference of the two measurements is ±200 μg, and our confidence in the ambient concentration is only about ±40%.
37 notes on example 4.2 -If the weighing uncertainty were ±10 μg, then our uncertainty in the concentration would be ±4 percent. -The example also shows that the resulting measurement is the average over the past 24 hours. This type of instrument is not nearly as suitable for determining hourly variations or trends as are the real-time instruments.
38 Efforts to develop a suitable real-time instrument for PM2.5 have so far not been completely successful, mostly because of this small sample size problem. Note that the 16.7 L/min flow rate for PM 2.5 samplers is close to the average human breathing rate, so that the sample weight increase, 500 μg, is close to the mass of fine particles breathed in per day by an average person when the PM 2.5 concentration is 20.8 μg /m 3.)
39 Older measuring schemes for gas pollutants operated somewhat like the following: 1- passing a measured volume of gas through a bubbler that contained a solution that reacted specifically (no interferences!) with the gas to be measured and then titrating the solution to determine the concentration of the pollutant in the gas or measuring the color of the solution.
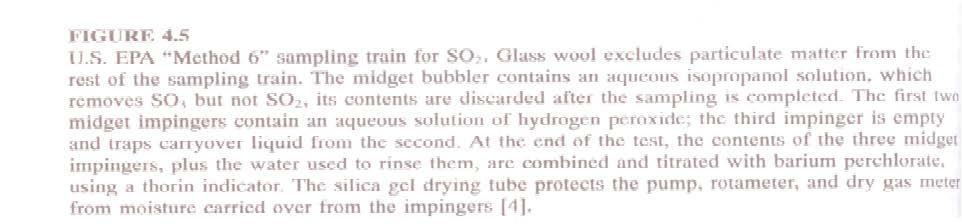
40 Many source sampling devices use the cumulative measuring schemes. For example: The EPA recommended sampling train for measuring the concentration of SO 2 gas in a stack. the pitot tube is used to measure the gas velocity in the stack. The sample of gas is pulled by the pump through the sampling probe. A needle valve and rotameter are used to ensure the flow rate of gas is in the right range, and into a dry gas meter.
41
42
43 4.5 Standard Analytical Methods EPA has standard methods for various pollutants. (often these are different for ambient monitoring than for source sampling.) These methods define the pollutant. i.e. In ambient air SO 2 is defined as the material which is detected by the SO 2 method shown in EPA STTANDARD METHODS FOR MAJOR AIR POLLUTANTS IN AMBIENT AIR (the West-Gaeke method). However, in powerplant stack SO 2 is defined as that material that is detected by Method 6 (Fig. 4.5) which is
44 Test methods for major air pollutants in ambient air Reference methods Equivalent methods TSP, PM 10, PM standard methods, An inlet designed to exclude particles larger than a certain size. Collecting on a filter for 24 hours Averaging the results (weight difference)
45 SO 2 : West-Gaeke Method Known volume of air bubbled through a solution of sodium tetrachloro mercurate (TCM), which form a complex with SO 2. After several reactions, solution treated with pararosaniline (magenta dye, C 19 H 18 N 3 Cl), to form intensely colored pararosaniline methyl sulfonic acid. The concentration is determined in a colorimeter, at wavelength 548 nm.
46 Ozone (chemioluminscence by etheylene) The air is mixed with ethylene, which reacts with ozone in a light-emitting reaction (chemiluminescent reaction). The light is measured with a photomultiplier tube. Note: Chemiluminescence is the emission of light with limited emission of heat, as the result of a chemical reaction.
47 CO It is measured by non-dispersive infrared (NDIR) absorption. Non-dispersive means that the IR is not dispersed by a prism or grating into specific wavelengths; rather, filters are used to obtain a wavelength band at which CO strongly absorbs. Note: This method is sensitive for water vapor interferences.
48 Hydrocarbons (Non-methane) Gas is passed through a flame ionization detector (FID), where HCs burn in a hydrogen flame. HCs cause more ionization than H 2 and this ionization is detected electronically. Part of the sample is diverted to a gas chromatograph, where CH4 is separated from other gases and then quantified. CH4 concentration is subtracted from the total hydrocarbon value from the FID. Note: HC determination is important even it is not NAAQS, for ozone control program.
49 NO 2 NO 2 is converted to NO which is then reacted with O 3 The light from this chemioluminscence reaction is measured. Ambient air contains NO (often more than NO 2 ), so a parallel sample is run without conversion of the NO 2 to NO. The resulting NO reading is subtracted from the combined NO and NO 2 to give the NO 2 value. The instrument normally reports both NO 2 and NO concentrations.
50 Lead A TSP filter is extracted with HNO 3 and HCL to dissolve the lead. Atomic absorption spectroscopy (AAS) used to determine the amount of lead in the extract. AAS: is a spectro-analytical procedure for the qualitative and quantitative determination of chemical elements employing the absorption of optical radiation (light) by free atoms in the gaseous state.
51 Determination pollutant flow rate The mass flow rate of pollutant is the product of the concentration in the gas and the molar or mass flow rate of the gas. Example 4.3 The sampling train shown in Fig. 4.5 indicates that the concentration of S0 2 in a stack is 600 ppm. The Pitot tube and manometer in the same figure indicate that the flow velocity is 40 ft/s. The stack diameter is 5 ft. The stack gas temperature and pressure are 450 F and 1 atm. What is the S0 2 flow rate?
52
53 Isokinetic Sampling In stack sampling for particulates, one must maintain isokinetic (constant) flow into the sampling probe.
54 Emission Factors Emission testing is expensive For simple, well-defined sources (power plant stack), it can be tedious but it is not difficult. For poorly defined sources (e.g, dust from unpaved roads or Co from forest fires), reliable test results are difficult to get. Furthermore, Testing only possible after the facility in Place.
55 Emission Factors Often we want to know what the emissions from a new facility will be before it is built. To meet these needs, the EPA has produced a very useful set of emission factor documents. These are commonly referred to by their original publication number, AP-42. These are summaries of the results of past emission tests, organized to make them easy to apply.
56
57 Example 4.4. Table 4.2 shows part of two tables from one section of the EPA emission factors library. It shows the estimated emissions from the combustion of bituminous coal if no control devices are used. These are the emissions going into the control devices. Comparing them to the permitted emissions coming out of the plant (Table 3.1), one can estimate the degree of control required. Using this table, estimate the emissions from a 500-MW power plant at full load, burning a typical Pittsburgh seam coal (see inside the back cover and Appendix C). The thermal efficiency is 35 percent. The power plant's boiler is assumed to be of the PC, wall-fired, dry bottom type.
58
59