Microcosm experiments
|
|
|
- Thomasina Higgins
- 5 years ago
- Views:
Transcription
1 Microcosm experiments

2 Theme 5 Results Microcosm screening for toxicity in individuals and populations (reported in 31 papers) Test predictions from HTS, HCS, and F & T on reproduction, growth, behavior, and survival Results support predictions from HTS Results also varied from HTS, often due to ENM behavior in seawater or sediments Organisms transformed, repackaged ENMs altering bioavailability Toxic responses at environmentally very high concentrations Results sometimes varied from HCS, or over time, due to ecological dynamics
3 Long term response of phytoplankton to Ag ENMs Algal culture grown for 23 days with nutrient limitation Exposure to Ag NPs after 1, 6, or 13 days Response involves both nano and ionic effects Toxicity reduced by DOC produced by algae Mechanisms identified by a combination of auxiliary experiments + dynamic model Effects on ecologically relevant time scales involves both biotic and abiotic processes * L.M. Stevenson, H. Dickson, T. Klansjscek, A.A. Keller, E. McCauley, R.M. Nisbet (2013). PLoS ONE.
4 Motivating questions for mesocosms How does ENM bioavailability vary with physical-chemical conditions? How do ecological feedbacks influence bioavailability and toxicity? How do chronic, low level concentrations of ENMs influence ecological dynamics and ecosystem services over relevant time scales?
5 Mesocosm experiments
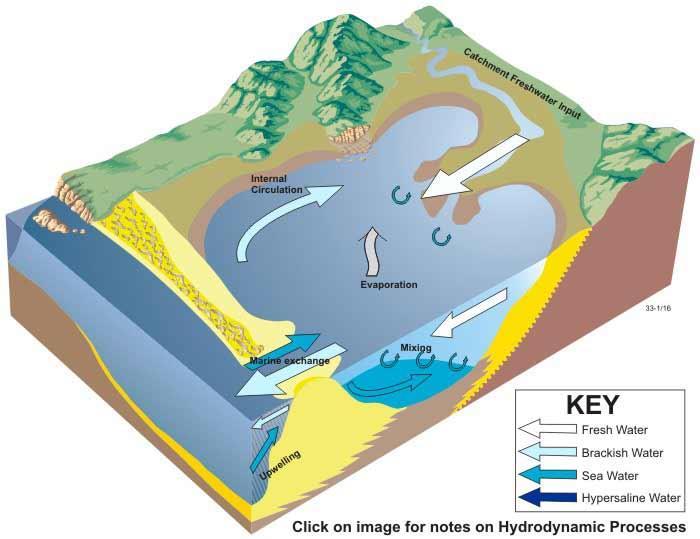
6 Estuaries

7 River Aggregation Dissolution
8 Specific hypotheses for estuarine mesocosm experiments H1: Bioavailability/uptake of ENMs will increase for deposit feeders, but decrease of suspension feeders, with increasing salinity due to increased ENM deposition H2: Increased current speed (Physical), bioturbation (Biological), and their interaction will re-suspend ENM increasing uptake by suspension feeders H3: Increased TOC in sediment will sequester metal oxide ENMs reducing acute toxicity for all fauna but increase bioaccumulation, biomagnification, and chronic toxicity in deposit-feeders and their prey H4: Key ecosystem processes (benthic respiration, N/P cycling, and community productivity) will decrease with ENM bioavailability and uptake.
 deposition.")
9 Hypothesis 1: Bioavailability/uptake of ENMs will increase for deposit feeders, but decrease of suspension feeders, with increasing salinity due to increased ENM (e.g., nano-cu and ZnO) deposition. ENMs water Salinity sediment Estuarine MendNano Model

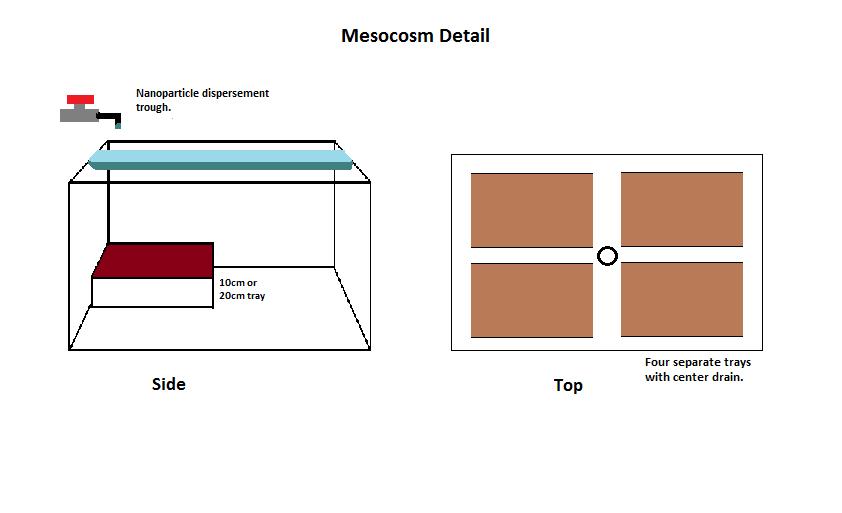
10 Green arrows indicate direction of flow Water levels in tanks can be controlled by internal or external stand pipes of varying heights. Tanks can hold multiple sediment containers. Trough above tank has small holes to allow water or treatments to drip into tank. IV bags will contain ENM stocks. Water from tanks drains through a common drain in the water table. IV bag Sediment containers Trough Internal Standpipe External Standpipe


11 Example of contemporaneous microcosm study NEREIS VIRENS CONTROLLED FEEDING EXPERIMENT FOR CU TOXICITY STUDIES Jay C. Means & Theme 5


12 Experimental endpoints Cu uptake rate, absorption efficiency, depuration rate Survival/mortality Tissue distribution of Cu, histology, other endpoints

13 Hypothesis 2: Increased current speed (Physical), bioturbation (Biological), and their interaction will re-suspend ENM increasing uptake by suspension feeders. ENMs water FLOW RATE sediment

14 Hypothesis 3: Increased TOC in sediment will sequester metal oxide ENMs reducing acute toxicity for all fauna but increase bioaccumulation, biomagnification, and chronic toxicity in deposit-feeders and their prey. ENMs water sediment TOC Hypotheses: Chronic, low level exposures to nano-cu influence population dynamics of amphipods. Results vary with sediment TOC & salinity. Experiments linked to Ecological Dynamics Models
 will decrease with ENM bioavailability and uptake.")
15 Hypothesis 4: Key ecosystem processes (benthic respiration, Nitrogen cycling, and community productivity) will decrease with ENM bioavailability and uptake. ENMs Salinity water bacteria sediment TOC
16 Field experiment


17 Field experiment Hypothesis: Species diversity will vary with ENM bioavailability and uptake Carpinteria Slough Low salinity High salinity

18 Field experiment H1: Species diversity will vary with ENM bioavailability and uptake H2: Results for individual assays similar to that in mesocosms nano-cu, TOC, controls salinity with vs. without predators Recruitment (flora, fauna) Survival and growth Low salinity High salinity
 Environ. Sci. & Tech. 2.")
19 Using stable isotopes to trace the biological fate of CNT-derived carbon C isotope values of tissues and pseudofeces in control and exposed mussels and CNTs were measured and an isotopic mixing model used to calculate CNTderived C contributions. Conclusions 1. Mussels avoided ingesting most CNTs by evacuating them in pseudofeces. Hanna et. al. (Submitted) Environ. Sci. & Tech. 2. CNTs were nevertheless incorporated into all tissues measured in significant quantities. 3. Time-series measurement of C isotopes could potentially be used to monitor CNT contamination in nature


20 Carbon stable isotopes could they be used to trace CNTs in the environment? Oceanic particulate organic matter d 13 C = ~ -14 to -26 Terrestrial particulate organic matter d 13 C = ~ -9 to -35 Carbon nanotubes d 13 C = ~ -35 to -55
21 Estuarine Mesocosm System Design
22 Green arrows indicate direction of flow Water levels in tanks can be controlled by internal or external stand pipes of varying heights. Tanks can hold multiple sediment containers. Trough above tank has small holes to allow water or treatments to drip into tank. IV bags will contain ENM stocks. Water from tanks drains through a common drain in the water table. IV bag Sediment containers Trough Internal Standpipe External Standpipe
23
24


25 Flowmeters seawater prefilters Fresh water prefilters Automated valves YSI Seawater and freshwater enter the system through the manual flowmeters, and are then prefiltered. Salinity is adjusted by automated valves controlled by aysi controlling unit, or manually using the flowmeters. Bypass valves allow switching between manual or automated mixing. Following prefiltration, fresh and seawater are mixed in a mixing chamber, then enter the mixing tank. Water from the mixing tank flows through the chiller/heater, and then flows through to the treatment tanks in the climate change room Chiller/heater Mixing tank Mixing chamber
26
27
28
29

30 Close up of YSI programmable controller and the manual flowmeters


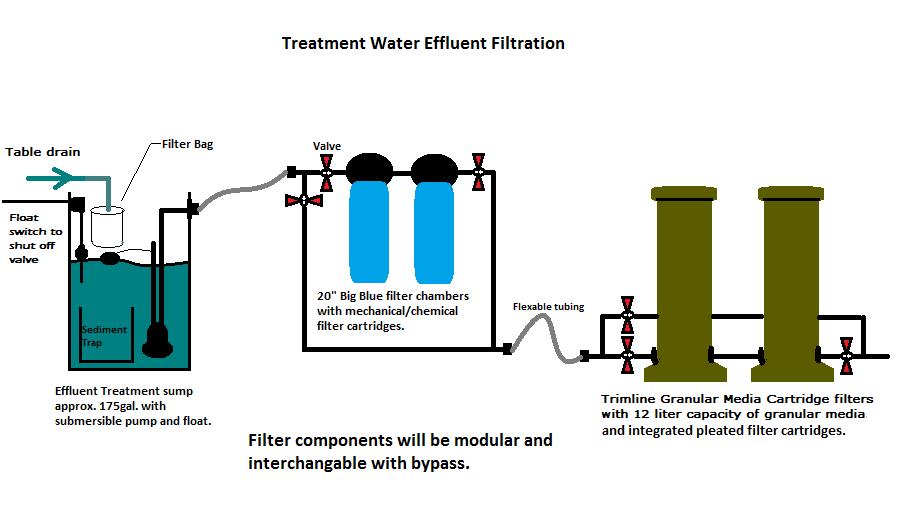
 Two Cuprisorb filters")
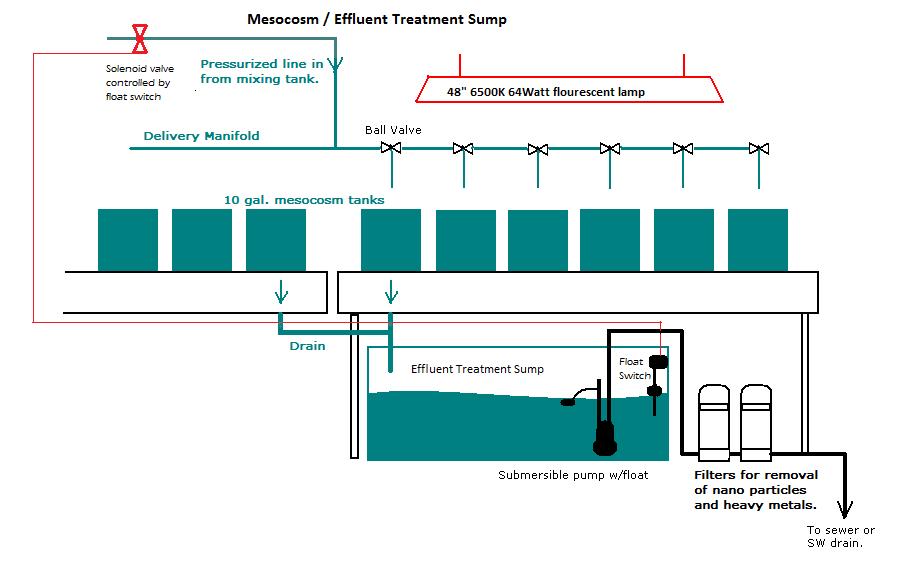
31 Effluent treatment sump Green arrows indicate direction of flow. Secondary sediment trap allows for easier removal and/or treatment of sediment/aggregates of metals Secondary sediment trap Cuprisorb filters Two carbon filters (or granular media) Two Cuprisorb filters for removal of copper Carbon filters