Energy efficiency in Bulgaria
|
|
|
- Wesley Butler
- 5 years ago
- Views:
Transcription
1 BULGARIA Energy efficiency in Bulgaria Ivaylo Aleksiev Executive Director Financing energy efficiency in Central and South-Eastern Europe 20 June 2018, Sofia
 Population: 7 101 859 (2016,")
 Primary Energy Consumption: 17 931 ktoe (2015, NSI) including")

 The largest thermal power plants in Southeastern Europe are")
 RES electricity Total")
 The Belmeken-Sestrimo-Chaira cascade is the most powerful")
2 Bulgaria in numbers Founded: 681 Current territory: square kilometers (Europe's 16th-largest country) Population: (2016, NSI) GDP: M (2016, NSI) Final Energy Consumption: ktoe (2015, NSI) Primary Energy Consumption: ktoe (2015, NSI) including PEC of RES ktoe (2015, NSI) The largest (per capita) producer and exporter of electricity on the Balkan Peninsula. Kozloduy Nuclear Power Plant: ktoe(2015,nsi) (32% of Bulgaria's electricity) The largest thermal power plants in Southeastern Europe are located in the Maritsa East complex. Total production of TPPs: ktoe (2015, NSI) RES electricity Total production : 731 ktoe (2015, NSI) including hydro electricity : 487 ktoe (2015, NSI) The Belmeken-Sestrimo-Chaira cascade is the most powerful hydropower facility: MW 6 planning regions 28 district regions 265 municipalities 2
3 National energy saving targets to 2020 (NEEAP ) 3


 Solid fuels <")
4 Energy Efficiency Obligation Scheme Introduced 2008 Updated 2014 Energy suppliers: Electrical energy < 20 GWh/ann. Heat energy < 20 GWh/ann. Natural gas < 1 mln. nm 3 /ann. Mixed approach Alternative measures introduced 2016 as a supplemented approach to the suppliers obligation Total amount of savings ktoe cumulative savings Liquid fuels < 6,500 tones /ann. (fuels for transport excluded) Solid fuels < 13,500 tones /ann obligated companies 4


5 Progress towards Energy Efficiency Obligation Scheme in 2017 Late start Cumulative target ,5 ktoe Cumulative energy savings ,6 ktoe Unfavorable business - difficult to identify opportunities Difficulties in the regulated market Lack of understanding / interest Some recommended steps: - Incentives / compensation in connection with the expansion of energy suppliers' activities by introducing appropriate financial mechanisms - Identifying opportunities to increase the share of use of alternative measures in the EEOS. - Facilitated procedures for demonstrating energy savings - deemed energy savings" 5


6 Progress towards National energy efficiency target 60,7% Annual report on NEEAP implementation, March 2017, SEDA 6

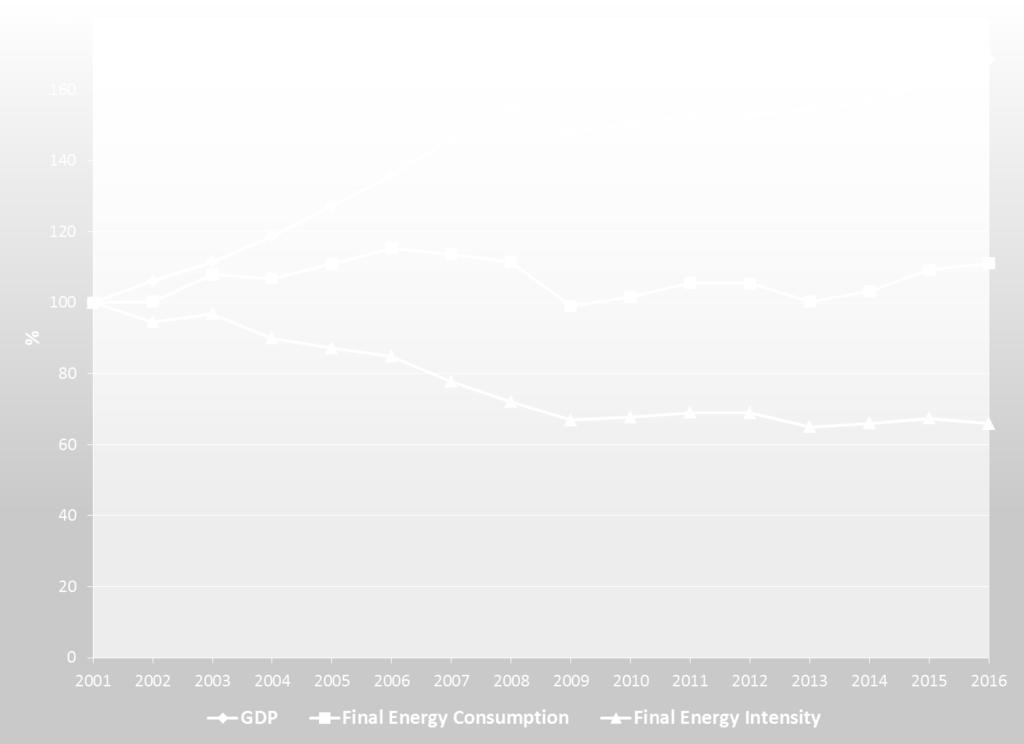
7 Final energy consumption 7
8 Final energy consumption of the main sectors Final energy consumption by sectors 8


9 Final energy consumption by sectors (1) Services Industry Increased energy efficiency Worsen energy efficiency Increased number of employees in the sector Increased area of public buildings; Increased level of energy comfort in public buildings. 9


10 Final energy consumption by sectors (2) Transport Households High energy consumption Increased consumption of the most inefficient transport air transport Increased consumption of the road transport; Increased share of personal cars/bad technical condition of the car park. Decreased share of the most efficient transport railroad transport Better energy efficiency Reducing energy intensity in terms of monetary consumption is an indicator of increased efficiency of household energy use, which limits the growth of energy consumption. 10

11 Energy Efficiency payback - Industry Years 11


12 Energy Efficiency payback - Buildings Per type of measures Per building type 12


13 Energy Efficiency measures NEEAP Annual report for 2017 Industry Energy Audits (154 Industrial companies) Lightning Technology equipment Technology aggregates and facilities Leaks and insulation Monitoring and control systems Cogeneration, RES, etc. "Innovation and Competitiveness Energy Efficiency for SMEs Enhancement of energy efficiency in large enterprises Buildings/S ervices Energy Audits (400 state and municipal buildings) More than EE activities and measures have been implemented by the regional and municipal administrations and by the state authorities in the country Building renovation, Street lightning, municipal transport, etc. Transport Increase of the share of electric and hybrid vehicles Charging infrastructure development Rehabilitation and modernization of road and transport infrastructure Construction of the Sofia subway system TOTAL ENERGY SAVINGS IN 2017 (bottom-up): GWh 13

14 Financing Energy Efficiency 2017 Industry Buildings/Services Households "Innovation and Competitiveness OP 500 projects 425 mln. BGN grant support Regions in Growth OP - 17 contracts for public buildings and households; 31,7 mln. BGN grant support BG04 Programme 34 projects; more than 20 mln. BGN EE and RES Fund: 10 loan agreements; 6,9 mln. BGN. Energy Efficiency of Multi- Family Residential Buildings National Programme: - 100% grant renovated residential buildings mln. BGN Residential Energy Efficiency Credit Line (REECL): % grant projects - 8,5 mln. BGN National Trust EcoFund - Up to 85% grant - 32 projects EE in buildings, 13,9 mln. BGN grant support - scheme for encouraging the use of electric cars 14
15 Energy Efficiency potential 15


16 Thank you! Ivaylo Aleksiev Phone: Fax: IAleksiev@seea.government.bg Web: 16