Engineering Properties, Emissions and Performance of Warm Mix Asphalt Technologies and Best Practices
|
|
|
- Cornelius York
- 5 years ago
- Views:
Transcription

1 Engineering Properties, Emissions and Performance of Warm Mix Asphalt Technologies and Best Practices SCAPA Winter Conference 2016 Brian D. Prowell, Ph.D., P.E.
2 2003 NCAT Study Objectives Evaluate Warm Asphalt Technologies for U.S. Paving Practices High production Rapid Turn-over to traffic Potential Concerns Curing Time Increased Potential for Moisture Damage Binder effects


3 Seeing is Believing! First U.S. WMA Test Section February 2004 Hot Mix 314 F Warm Mix 254 F pcf pcf
4 Paving Benefits Benefits of WMA Compaction aid Cold-weather paving Longer haul distances Use of higher percentages of RAP Less restriction, potentially more production in non-attainment areas Specific pavement rehabilitations Reduced Fuel Usage Reduced Emissions Improved Working Conditions

5 NCHRP 9-47A Sites Dry Freeze Wet Freeze Dry No Freeze Wet No Freeze
6 Mix Design


7 WMA Mix Design AASHTO Appendix to R30: Perform design with WMA additive or lab foaming device Mixing temp. based on coating Compaction temp based on gyrations to 92% G mm Rutting evaluation None of the NCHRP 9-47A field projects were designed with the Appendix to R30
8 Research Plan To compare results with field results, samples batched to match average of field extracted gradation for mix/technology Determine optimum asphalt content Evaluate coating and compactability at laboratory optimum AC% Evaluate TSR and FN (lab opt. AC%)


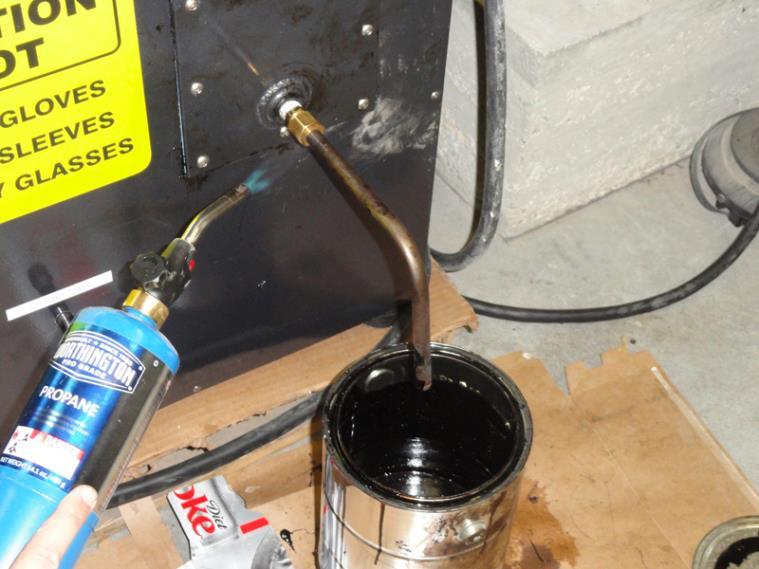
9 Making Foamed Asphalt in the Lab
10 Binder Absorption Binder absorption observed to be less for WMA vs. HMA for early TX project. Percent binder absorption calculated knowing G mm, AC%, G b, and G sb. Comparisons: WMA to HMA Lab to Field


11 Loop 368 One-Year Cores Warm Mix Hot Mix
12 Percent Binder Absorption Difference (WMA - HMA), % Binder Absorption WMA - HMA Field Lab Ver Field Avg %; Lab Avg % Asphalt absorption similar after 1-2 years

13 The Last Great Quandary: Selecting Production Temperatures In many cases HMA produced too hot Excessive temperatures age/stiffen binder, making compaction more difficult Many WMA suppliers wish to minimize temperatures to maximize fuel savings and offset cost of additives Some Agencies specify maximum temperatures for warm mix regardless of other production considerations RAP and RAS? SC-M-408 specifies F
14 Production Temperatures AASHTO Appendix R30 Based on Ross Count coating test after 90 seconds mixing with planetary mixer NCHRP 9-43 research completed with planetary mixer Concern more common bucket mixer may not provide adequate mixing or may need different time.

15 Coating, % Ross Count Field Lab 95.0 WMA 90 seconds 94.0 Foaming processes resulted in slightly less coating. Can coat with bucket mixer
 below production to proposed compaction temperature Supposed to be less than 1.")
16 SGC Compactability Ratio Compactability Ratio used to assess proposed WMA compaction temperatures Ratio of number of gyrations to 92% Gmm at 30 C (54 F) below production to proposed compaction temperature Supposed to be less than 1.25
17 In-place Density, % of Gmm SGC Compactability Ratio Compaction Temperature % increase in AC% 0.39% increase in AC% Opt. AC% Draft AASHTO R35 Field AC% Sample tested at 250F, Field production avg. 273F % decrease in AC% % decrease in AC% SGC Compactability Ratio
18 TSR 1.2 Tensile Strength Ratio Field Lab Mix verification from both MI and FL resulted in lower Opt. AC%

19 Number of Comparisons WMA vs HMA Tensile Strength year cores Same Lower Higher 1
20 WMA vs HMA Tensile Strength > 3 year cores
21 Summary Binder absorption less for WMA, approx. 0.10% field; 0.16% lab. Binder absorption the same after 1-2 years Recovered binder from cores not different after 1-2 years Rutting performance similar NCHRP 9-47A recommends drop-in approach for WMA where WMA technologies are used with existing HMA designs
22 Field Performance


23 Hall Street St. Louis, MO Field Rut Depth, mm Test Section 6 Months 26 Months 66 Months Control Evotherm Sasobit Aspha-min
24 MEPDG Predicted Rutting Layer(s) Sub-Total all Asphalt Layers Experimental (Surface) Layer Prediction Interval, years Mix Mean Rut Depth, mm Variance t-test p- value 12 HMA WMA HMA WMA HMA WMA HMA WMA
25 Summary of Observed and Predicted Field Performance No difference in opening times for WMA vs. HMA Rutting < 5 mm of rutting for all sections after 2 years MEPDG predicts slightly more (0.2 mm) rutting over life WMA performed well at accelerated loading facilities Appears to be discrepancy between laboratory predicted and observed field rutting
26 Summary of Observed and Predicted Field Performance No evidence of moisture damage in field projects, including saturated CA HVS sections Cracking Very little observed after 2 years; similar for WMA and HMA MEPDG predicts slightly more cracking for HMA Where Level 1 data used, MEPDG predicts less thermal cracking
27 = + +
28 Fuel Savings Theoretical calculations indicate a 50 F reduction in production temperature should result in an 11% reduction in fuel usage Actual savings average 13% for average reduction of 50 F Based on preliminary analyses, savings distributed as: 14% from reduction in stack temperature 51% from reduction in mix temperature 37% from reduction in casing loss


29 Best Practice: Reduce Saves fuel 2% decrease = savings of 0.48 gal/ton Drier aggregate in = drier aggregate out, reducing potential for moisture damage Stockpile Moisture
30 Best Practice Benefit 2% Reduction in stockpile moisture saves 0.58 gal. diesel per ton Stockpile Moisture, % Based on field data from fives sites. liters per ton of Diesel
31 Reduced Emissions
32 Reduction in CO 2 Emission, % 70 Fuel Usage Vs. CO Line of Equality WMA D Literature NCHRP 9-47A Reduction in Fuel Usage, %

33 Reduced Emissions NCHRP 9-47A data indicate: Reduced fuel usage = reduced CO 2 With one exception, NO x emissions from WMA were lower than for HMA VOC s significantly lower for parallelflow drum plant 50% reduction in SO 2 with recycled oil
34 Best Practice: Burner Tuning Elevated levels of CO and VOCs can indicate incomplete combustion Stack emissions data indicate examples of improperly tuned burners 32% fuel saving for HMA production at one plant after tuning for WMA project!
35 Worker Exposure NIOSH uses Benzene Soluble Matter (BSM) to measure worker exposure to asphalt emissions In many cases, results for BSM below detectable limits for both HMA and WMA hard to quantify benefits For NCHRP 9-47A, Heritage Research Group used a more discriminative test for Total Organic Matter Tests on 6 WMA and 2 HMA at 2 sites showed WMA reduced exposure by 33 to 61%
36 Summary Warm Mix technologies most frequently used as compaction aids and to improve coating Stiff mixes with polymer modified binders or higher recycle content Longer hauls/cooler weather Can combine chemical and foaming technologies Warm mix technologies are a component of asphalt s sustainability Reduced fuel usage = reduced emissions Better for workers
 246-4428 Brian@AMSLLC.US WWW.AdvancedMaterialsServices.")
37 Contact Information: Brian Prowell Advanced Materials Services, LLC (334)