An Aquatic Plant Lake Plan for Golden Lake Waukesha County, WI November, 2017
|
|
|
- Walter Carroll
- 5 years ago
- Views:
Transcription

1 An Aquatic Plant Lake Plan for Golden Lake Waukesha County, WI November, 2017
2 Acknowledgements Marine Biochemists would like to thank members of the Golden Lake Association for their financial commitment, as well as their time and dedication to the continued protection of this important resource. Many hours of volunteer time were spent attending meetings, recruiting volunteers, selecting vendors and planning their management activities, along with providing guidance on this Report. The data contained within this Report are based, in part, upon countless hours of data collection by WI DNR Science Service Staff (Nault, Van Egeren, et al) during the Aquatic Plant Surveys. We wish to recognize their contributions, as well as the efforts of Heidi Bunk (WI-DNR Waukesha Office) for her Review of this, and previous Reports, along with the Aquatic Plant Management Plan (2015), assistance with Grants, Permitting, Plant Management advisement and on-site field supervision.
3 Introduction Golden Lake is an approximate 250 acre lake located principally in the Town of Summit, Waukesha County, Wisconsin. A portion of the lake lies in the far east portion of Jefferson County in the Town of Concord. While the presence of Eurasian Watermilfoil (EWM) was first recorded by the WI DNR in 2005 during assessment surveys, it was not until 2011 that its presence required a more formal investigation and a review of control options by the local Golden Lake Association. Marine Biochemists was contacted and invited in 2011 to conduct a brief survey of the lake and offer recommendations for control of EWM. In 2012, Marine Biochemists was hired to conduct a more formal lake-wide survey to accurately determine the distribution of EWM and offer recommendations for it s control. The Report, entitled A Survey of the Distribution of Eurasian/Hybrid Watermilfoil in Golden Lake Waukesha and Jefferson Counties, WI was published in February of Since 2012 The Golden Lake Association has used a variety of methods, including manual removal, 2,4-D treatments and Diver Assisted Suction Harvesting ( DASH ) to managed the milfoil population. A number of Full Point Intercept (PI) Surveys (May and August, 2013, and September, 2014) and Partial PI Surveys (Fall, 2015 and 2016) have been conducted to monitor control results and to plan for future management activities. With the assistance of a State Grant the Golden Lake Association contracted with Marine Biochemists to conduct a Full PI Survey in August, This survey was started on August 26 and was completed on September 8, using the same standard protocol and methodology used in the 2013/2014 surveys. This Report presents a summary of the data collected, along with a quantitative analysis and discussion of the results for the various management techniques employed by the Association since the initial Full PI survey was undertaken in Survey Methodology The protocol for the Full PI surveys called for the sampling the vegetation at 565 pre-determined sites within the lake. These locations were spaced apart by approximately 46 meters in general north-south and east-west transects across Golden Lake using waypoints (longitude and latitude coordinates) established by the WI DNR (see fig. #1). During these surveys a crew navigated to each waypoints using a Global Positioning System (GPS). At each point where water depth was at or less than the maximum plant rooting depth (approximately feet), plants were sampled using a rake head attached to either a Pole (P) or Rope (R). Water depth was recorded and the dominant bottom sediment type (muck, sand, rock) noted. Plants collected were identified to genus and/or species, individual plant species density (rake fullness for a single plant type) determined, along with total plant density (rake fullness for all plants). This data was then recorded for each site. An example of this rake fullness density determination is found on fig #3. Please also note that Inadequate depth, emergent plants (cattails) and/or excessive vegetation prevented access to some of these pre-selected waypoints. This information was recorded as well during the surveys. In 2015 and 2016, Partial PI Surveys were conducted that focused on the portion of the lake containing EWM/Hybrid down to a depth of approximately 14 feet. A map for these sites is found in figure 2. 1
4 Survey Results Below are Tables comparing the abundance of both the most common native and non-native aquatic plant species found in Golden Lake during the Full PI Surveys conducted by WI DNR and 2017 by Marine Biochemists using the P/I Survey Methodology. Non-native Species # Sites # sites # sites # sites Scientific Name Common Name Sept Sept Aug May,2013 Myriophyllum spicatum Eurasian Watermilfoil Potamogeton crispus Curlyleaf Pondweed Native Species Rank Rank Rank Rank Scientific Name Common Name Sept Sept Aug May,2013 Chara, sp. Chara Najas flexilis Slender naiad na Ceratophyllum demersum Coontail Vallisneria americana Eelgrass Stuckenia pectinata Sago pondweed 5 4 4* 8 Nitella, sp. Nitella Potamogeton natans Floating-Leaf pondweed Utricularia Common bladderwort Potamogeton gramineus Variable Leaf pondweed 9 7 4* na Potamogeton illoensis Illinois Pondweed The aquatic plant survey indicated that the lake contains a diverse aquatic plant community. Plants were collected at depths of up to 29 feet during the 2017 survey, and ft. during the earlier surveys. Figures #4 and 5 detail the relationship between water depth and the number of sites where aquatic vegetation was found in both Table and Graph forms. Figure 6 provides the location of sites with aquatic vegetation (native or non-native). The locations where AIS (Eurasian Watermilfoil and/or Curlyleaf Pondweed) were found are shown on Figures #7 and #8. It is important to note that Figure #7 provides Pre and Post Treatment Data showing a significant reduction of Eurasian Watermilfoil following the treatment on June 4, It should be noted that treatments for the control of EWM/Hybrids have been conducted in all years since with the exception of Detail on these treatments will be discussed in greater detail in another section of this Report. While Curlyleaf Pondweed has been observed in Golden Lake, very little has been detected during the formal PI Surveys due to survey timing. This species typically reaches a maximum biomass in late May/mid June, then dies back after the 4th of July. It may re-develop once again somewhat in late Fall once water temperatures have cooled. Figures 9-15 detail the location of the Top Seven Ranked Native Plant Species observed in Golden Lake during the 2017 survey. Maps of the distribution and rake fullness for these species during previous surveys are also provided as a comparison. Further discussion of the Results and Comparison with prior surveys continues after the species maps on page 18. 2
5 Figure 1 Location of WI DNR Sampling Waypoints Golden Lake, Waukesha/Jefferson Counties, WI Total # of Sampling Points Visited: 435 3
")

6 Figure 2 Location of WI DNR Sampling Waypoints (Partial PI Surveys 2015/16) Golden Lake, Waukesha/Jefferson Counties, WI # Sampling Points: 201 # Sampling Points: 250 4

7 Figure 3 Aquatic Plant Fullness Ratings 5
8 Figure 4 Depth of Plant Colonization-Golden Lake, Waukesha/Jefferson Counties, WI May, 2013 Sept., 2017 Full PI Surveys (Table Form) Depth (ft.) May, Aug., 2013 Sept., 2014 Sept.,
9 Figure 5 Depth of Plant Colonization-Golden Lake, Waukesha/Jefferson Counties, WI Full PI Surveys ( ) May-2013 Aug Sept Sept

10 Figure 6 Golden Lake, Waukesha/Jefferson Counties, WI Sites with Aquatic Vegetation (all species) May 20, 2013 August 28, 2013 No. Vegetated Sites: 264 September 2, 2014 No. of Vegetated Sites: 289 September 8, 2017 No. of Vegetated Sites: 285 No. of Vegetated Sites: 310 Rake Fullness :


11 Figure 7 Golden Lake, Waukesha/Jefferson Counties, WI Sites with Eurasian/Hybrid Milfoil May 20, 2013 August 28, 2013 No. Sites: 118 September 2, 2014 No. Sites: 70 September 8, 2017 No. Sites: 72 No. Sites: 54 Visual: 6 Rake Fullness :
12 Figure 8 Golden Lake, Waukesha/Jefferson Counties, WI Sites with Curlyleaf Pondweed (Potamogeton crispus) May 20, 2013 August 28, 2013 Note: No Observations Made on August 28, 2013 Survey No. Sites: 4 September 2, 2014 September 8, 2017 No. Sites: 1 No. Sites: 1 Rake Fullness :
 No. of Sites: 115 (Rank #1) September 2, 2014 September 8, 2017 No. of Sites: 123 (Rank #1) No.")
13 Figure 9 Golden Lake, Waukesha/Jefferson Counties, WI Sites with Chara (Chara, spp.) May 20, 2013 August 28, 2013 No. of Sites: 113 (Rank #1) No. of Sites: 115 (Rank #1) September 2, 2014 September 8, 2017 No. of Sites: 123 (Rank #1) No. Sites: 181 (Rank #1) Rake Fullness :
 September 2, 2014 September 8, 2017 No. Sites: 45 (Rank #8) No.")
14 Figure 10 Golden Lake, Waukesha/Jefferson Counties, WI Sites with Slender Naiad (Najas flexilis) May 20, 2013 August 28, 2013 Note: No Observations Made on May 20, 2013 Survey No. Sites: 38 (Rank #8) September 2, 2014 September 8, 2017 No. Sites: 45 (Rank #8) No. Sites: 86 (Rank #2) Rake Fullness :
 No. Sites: 93 (Rank #3) September 2, 2014 September 8, 2017 No. Sites: 106 (Rank #3) No.")
15 Figure 11 Golden Lake, Waukesha/Jefferson Counties, WI Sites with Coontail (Ceratophyllum demersum) May 20, 2013 August 28, 2013 No. Sites: 64 (Rank #2) No. Sites: 93 (Rank #3) September 2, 2014 September 8, 2017 No. Sites: 106 (Rank #3) No. Sites: 73 (Rank #3) Rake Fullness :
 No. Sites: 113 (Rank #2) September 2, 2014 September 8, 2017 No. Sites: 107 (Rank #2) No.")
16 Figure 12 Golden Lake, Waukesha/Jefferson Counties, WI Sites with Eelgrass (Vallisneria americana) May 20, 2013 August 28, 2013 No. Sites: 3 (Rank #20) No. Sites: 113 (Rank #2) September 2, 2014 September 8, 2017 No. Sites: 107 (Rank #2) No. Sites: 68 (Rank #4) Rake Fullness :
17 Figure 13 Golden Lake, Waukesha/Jefferson Counties, WI Sites with Sago Pondweed (Stuckernia pectinata) May 20, 2013 August 28, 2013 No. Sites: 16 (Rank #9) No. Sites: 68 (Rank #5) September 2, 2014 September 8, 2017 No. Sites: 78 (Rank #4) No. Sites: 66 (Rank #5) Rake Fullness :
 May 20, 2013 August 28, 2013 No.")
 September 2, 2014 September 8, 2017 No.")
18 Figure 14 Golden Lake, Waukesha/Jefferson Counties, WI Sites with Nitella (Nitella, spp.) May 20, 2013 August 28, 2013 No. Sites: 44 (Rank #4) No. Sites: 39 (Rank #8) September 2, 2014 September 8, 2017 No. Sites: 41 (Rank #4) No. Sites: 60 (Rank #6) Rake Fullness :
19 Figure 15 Golden Lake, Waukesha/Jefferson Counties, WI Sites with Floating-leaf Pondweed (Potamogeton natans) May 20, 2013 August 28, 2013 Note: No Observations Made on May 20, 2013 Survey No. Sites: 28 (Rank #11) September 2, 2014 September 8, 2017 No. Sites: 41 (Rank #9) No. Sites: 54 (Rank #7) Rake Fullness :
20 Aquatic Plant Survey Results cont d Figure 17 (page 22) provides a Table of Summary Statistics, and Figure 16 (page 21), a Table of the Floristic Quality Index (FQI) for each of the four surveys. A brief discussion of the importance and meaning of this Data, and a comparison between them follows. Total # of Sites w/ Vegetation The number of sites having vegetation in Golden Lake during the four surveys were very similar in number. The lowest value (264) was recorded during the May 20, 2013 survey. This is most likely due to the timing of the survey, as some species of plants had not developed. The later (August/September) surveys recorded 289, 285 and 310 sites with vegetation (2013, 2014, 2017 respectively). Total # Sites Shallower Than Maximum Depth of Plants The number of sites shallower than the maximum depth of plants for the surveys ranged from a low of 329 (2014) to a high of 351 (May, 2013), with the 2014 and 2017 values being 341 and 335, respectively. Changes in water clarity can increase/decrease the maximum rooting depth. While the Maximum Rooting Depth was higher in 2013 (32.5 feet) than in 2014 and 2017 ((29.5 and 27 feet), all are quite high and are an indicator of good water clarity. Relative Frequency of Occurrence Relative Frequency of Occurrence, presented as a percentage, is the number of sites shallower than the maximum depth that contained vegetation. The data for this statistic is provided below: Frequency of occurrence at sites shallower than maximum depth of plants While the September, 2017 is significantly higher than the 2013 surveys, this should not necessarily be interpreted as the lake getting weedier. While much of the bottom sediments within Golden Lake are of suitable consistency (silt, muck) and fertility for plant growth, expansive areas of relatively inorganic sand are present as well. Certain species of plants are able to adapt to this relatively inorganic sediments, and sparsely (below nuisance levels) colonize even sandy areas.. Simpson Diversity Index The Simpson Diversity Index (SDI) measures the diversity of a plant population, using the number of species surveyed and the number of species per site. The decimal scale ranges from 0 (low diversity) to 1 (high diversity). The SDI for the surveys were 0.87 (May, 2013), 0.91 (Aug., 2013) and 0.92 (Sept., 2014) and 0.9 (Sept., 2017) This indicates that a high level of diversity has been maintained since the 2013 chemical treatment (35 acres) in Golden Lake. Maximum Depth of Plants Maximum depth of plants has ranged from 27 feet (Sept., 2017) to 32.5 ft. (May, 2013) for the surveys. The other two surveys recorded 30 ft. (Aug., 2013) and 29.5 ft. (Sept., 2014). The most common type of vegetation present at depths greater than 20 ft. was Nitella, a bottom growing, attached form of algae similar in appearance to Chara. 18
21 Aquatic Plant Survey Results cont d Average # of Species Per Site (Shallower than maximum depth) and Average # of Species (vegetated sites only) The values for the surveys are highlighted below: Average number of all species per site (shallower than max depth) Average number of all species per site (veg. sites only) The values for May of 2013 are significantly lower than the Aug./Sept. surveys. The difference between these surveys is due to the lower number of species (Species Richness) being found in May, as opposed to later in the year. Changes in dominance of a one or two species (whether native or non-native) in a given year can cause fluctuations in this statistic. Avg. # of Native Species/Site (shallower than max. depth) and Avg. # of Native Species/ Site (vegetated sites only) The values for these statistics are also provide below in Table form as a reference: Average number of native species per site (shallower than max depth) Average number of native species per site (veg. sites only) When these are compared to the number s in the preceding Table, they are lower, which reflects year-to -year fluctuations in the native and non-native plant community. Also, the May, 2013 value was the lowest, a reflection of the time of season that the survey was conducted. The 2017 stats fall within the range collected during the August, 2013 and September, 2014 surveys. Species Richness Species richness is simply the number of species observed in the lake during the surveys. The number of species observed during the 2017 survey was the highest (29), and the May, 2013 survey (19), the lowest. The Species Richness for August, 2013 and September, 2014 surveys were (22) and (24), respectively. A number of plant species including Vallisneria americana (Eelgrass), Potamogeton natans (Floating-leaf pondweed), Potamogeton gramineus (Variable-leaf pondweed) and members of the genus,najas (Slender and/or Southern naiad) are known to form later in the growing season. Year to year changes in the weather (air/water temperatures) may also influence data collected early in the season. 19
22 Aquatic Plant Survey Results cont d Floristic Quality of Index The Floristic Quality Index (FQI) is a measure of a plant community s closeness to an undisturbed condition. Urban lakes, or those with a high level of boat traffic have lower FQI s, meaning fewer species or lacking specific native species that are often associated with undisturbed conditions. The FQI for the surveys are as follows: May, 2013 Aug., 2013 Sept., 2014 Sept., FQI s for any particular lake are often compared to regional or state-wide averages in order to provide perspective. FQI values representing the highest value of the lowest quartile, mean and bottom of the highest quartile of all Wisconsin lakes are 16.9, 20.9, and This places Golden Lake in the good category in terms of disturbance. For additional perspective, the lowest FQI measured 3.0 (most disturbed), and the highest, 44.6 (most undisturbed). The 2017 FQI for Golden Lake (32.36) is significantly higher than those previously recorded, and also places it well above the highest quartile (FQI>27.5) of all Wisconsin lakes. This concludes the presentation and discussion of the Data collected from the three P/I Surveys conducted by WI DNR staff ( ) and Marine Biochemists ( ). The next section of this report will be a discussion of the Aquatic Invasive Species Management activities that have been implemented since 2013 and their results, along with a re-visit to the Golden Lake AIS Management Goals. 20
23 Figure 16 Summary of Golden Lake 2017 PI Survey Plant Data Common Name Species Freq. of Occurrence within vegetated areas (%) Average Rake Fullness # sites where species found (does not include visuals) Eurasian Watermilfoil Myriophyllum spicatum Curlyleaf Pondweed Potamogeton crispus Watershield Brasenia schreberi Coontail Ceratophyllum demersum Muskgrasses Chara Water star-grass Heteranthera dubia Northern water-milfoil Myriophyllum sibiricum Whorled water-milfoil Myriophyllum verticillatum Slender naiad Najas flexilis Southern naiad Najas guadalupensis Spiny naiad Najas marina Nitella Nitella Spatterdock Nuphar variegata White water lily Nymphaea odorata Pickerelweed Pontederia cordata Large-leaf pondweed Potamogeton amplifolius Leafy pondweed Potamogeton foliosus Fries' pondweed Potamogeton friesii Variable pondweed Potamogeton gramineus Illinois pondweed Potamogeton illinoensis Floating-leaf pondweed Potamogeton natans Long-leaf pondweed Potamogeton nodosus White-stem pondweed Potamogeton praelongus Small pondweed Potamogeton pusillus Clasping-leaf pondweed Potamogeton richardsonii Fern pondweed Potamogeton robbinsii # of visual sightings Flat-stem pondweed Potamogeton zosteriformis Hardstem bullrush Schoenoplectus acutus Sago pondweed Stuckenia pectinata Cattail Typha sp Common bladderwort Utricularia vulgaris Wild celery Vallisneria americana
24 Figure 17 Floristic Quality Index (FQI) Golden Lake, Waukesha & Jefferson Counties, WI Aquatic Plant Surveys ( ) Species present=1 Species Common Name C Brasenia schreberi Watershield Ceratophyllum demersum Coontail Chara Muskgrasses Heteranthera dubia Water star-grass Myriophyllum sibiricum Northern water-milfoil Myriophyllum verticillatum Whorled water-milfoil Najas flexilis Slender naiad Najas guadalupensis Southern naiad Nitella Nitella Nuphar variegata Spatterdock Nymphaea odorata White water lily Pontederia cordata Pickerelweed Potamogeton amplifolius Large-leaf pondweed Potamogeton foliosus Leafy pondweed Potamogeton friesii Fries' pondweed Potamogeton gramineus Variable pondweed Potamogeton illinoensis Illinois pondweed Potamogeton natans Floating-leaf pondweed Potamogeton nodosus Long-leaf pondweed Potamogeton praelongus White-stem pondweed Potamogeton pusillus Small pondweed Potamogeton richardsonii Clasping-leaf pondweed Potamogeton robbinsii Fern pondweed Potamogeton zosteriformis Flat-stem pondweed Schoenoplectus acutus Hardstem bullrush Stuckenia pectinata Sago pondweed Typha sp. Cattail Utricularia vulgaris Common bladderwort Vallisneria americana Wild celery N = # of of species mean C FQI Note: C is a Coefficient of Conservatism assigned to individual plant species, with higher ranking species more representative of a more natural, undisturbed condition. See Citations for additional information. CITATION: Nichols, SA Floristic Quality Assessment of Wisconsin Lake Plant Communities with Example Applications. Journal of Lake and Reservoir Management, 15(2): CITATION: University of Wisconsin-Madison, Wisconsin Floristic Quality Assessment (WFQA). Retrieved October 27, 2009 from: 22
25 Figure 18 Summary Statistics Golden Lake, Waukesha & Jefferson Counties, WI Aquatic Plant Surveys ( ) Total number of sites visited Total number of sites with vegetation Total number of sites shallower than maximum depth of plants Frequency of occurrence at sites shallower than maximum depth of plants Simpson Diversity Index Maximum depth of plants (ft)** Number of sites sampled using rake on Rope (R) Number of sites sampled using rake on Pole (P) Average number of all species per site (shallower than max depth) Average number of all species per site (veg. sites only) Average number of native species per site (shallower than max depth) Average number of native species per site (veg. sites only) Species Richness Species Richness (including visuals)
26 Eurasian/Hybrid Watermilfoil Control Discussion The surveys conducted in indicate that Golden Lake continues to a highly diverse and unique native aquatic plant community. EWM and its hybrid, while present, have been greatly reduced in terms of Frequency (number of sites present, see figure 7, page 9). The Tables below review the # of sites where EWM/Hybrid was found during the four Full PI and two Partial PI surveys: Full PI Survey # Sites EWM Present Partial PI Survey # Sites EWM Present May, August, October, August, September, September, * *Does not include Visual Observations at 6 sites While a number of external factors (drought, water clarity, etc) can influence the number of plants species present in a lake, as well as their dominance, control efforts targeted at EWM/Hybrid have been in place since These have had a significant impact. These include chemical controls using 2,4-D, manual removal (hand-pulling), as well as Diver Assisted Scuba Harvesting (D.A.S.H.). A summary of the efforts follows: Treatment with 2,4-D Figure 18 (following page) details the distribution of EWM/Hybrid as it existed in October, Please note that this map was created by means of a visual survey using GPS to mark the boundaries of the EWM beds. All areas of the lake, with the exception of Area G ( Sensitive Area ) were treated on June 3, 2013 using either DMA4-IVM (2,4-D liquid) or Navigate (2,4-D granular). The total acreage treated was approximately 35.6 acres. Figure 19 (page 24) shows the location of the survey points for both the Full and Partial Point-Intercept Surveys that have been conducted annually since Figure 20 shows the distribution and density of EWM present during the years during the Full (2013/14 & 2017) and Partial ( ) Surveys. Treatment areas for 2013 and are detailed as well. Diver Assisted Suction Harvesting (D.A.S.H.) Figure 21 shows the distribution of EWM in Golden Lake in Fall, 2015, and for each successive Fall ( ). It also shows the changes in density/distribution of EWM from year-to-year, as well as the location of D.A.S.H. efforts in Hand Harvesting (Venture Crew) EWM in shallow areas have been harvested by hand since Figures 22 and 23 are maps showing the location of EWM present within the harvested areas the Fall prior, and the Fall following the harvesting activities. Finally, a Map summarizing all EWM/Hybrid management activities is found on Figure 24 24

27 FIGURE 19 25

 Total # Sites: 167")
28 Figure 20 Golden Lake, Waukesha/Jefferson Counties, WI Location of Sampling Sites for Full & Partial PI Surveys Sites for Full PI Surveys (2013/14 & 2017) Sites for Oct., 2015 Partial PI Survey Total # Sites: 435 (approximate) Total # Sites: 167 Sites for Aug., 2016 Partial PI Survey Total # Sites:
 6/4/13 Treatment Areas 35.6 acres (Light Blue) # EWM Sites Outside Sensitive Area: 89 # Inside Sensitive Area Mgmt.")
29 Figure 21 Comparison of EWM Sites Inside/Outside of Sensitive Area in Treatment Areas Full PI Surveys (2013/14/17) and Partial PI Surveys (2015/16) Pre-Treatment EWM Sites May,2013 Post-Treatment EWM Sites Aug., 2013 EWM Sites in Sept., 2014 (No Treatment) 6/4/13 Treatment Areas 35.6 acres (Light Blue) # EWM Sites Outside Sensitive Area: 89 # Inside Sensitive Area Mgmt. Area: 27 Post-Treatment EWM Oct., 2015 Partial PI Survey 5/13/15 Treatment Areas 9.8 acres (Light Blue) # EWM Sites Outside Sensitive Area: 53 # Inside Sensitive Area Mgmt. Area: 17 Post-Treatment EWM Aug., 2016 Partial PI Survey 5/17/16 Treatment Areas 10.0 acres (Light Blue) # EWM Sites Outside Sensitive Area: 53 # Inside Sensitive Area Mgmt. Area: 19 Post-Treatment EWM Sept., 2017 Full PI Survey 6/6/17 Treatment Areas 4.2 acres (Light Blue) # EWM Sites Outside Sensitive Area: 28 # Inside Sensitive Area Mgmt. Area: 17 # EWM Sites Outside Sensitive Area: 17 # Inside Sensitive Area Mgmt. Area: 8 # EWM Sites Outside Sensitive Area: 38 # Inside Sensitive Area Mgmt. Area: 20 27
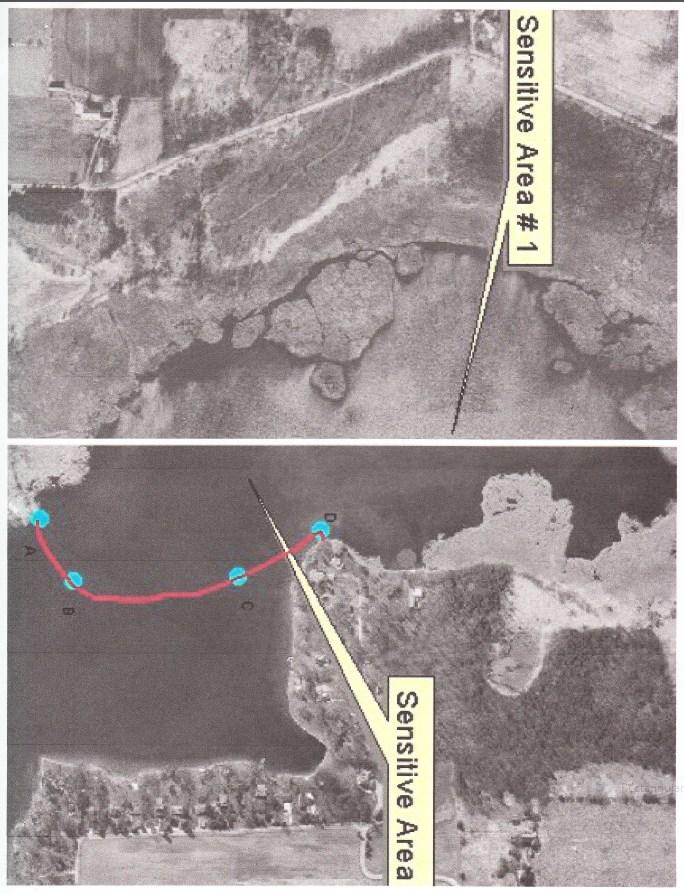
30 Figure 22 EWM Distribution within Golden Lake and location of Diver Assisted Scuba Harvesting (D.A.S.H.) Treatments Oct., 2015 Pre Harvest Aug., 2016 PI (Post) w D.A.S.H. (Light Blue) Sept., 2017 PI (Post) w D.A.S.H. (Light Blue) D.A.S.H. conducted on Note: Mostly CLP harvested with some EWM D.A.S.H. conducted on June 20-23, 2017 Note: Harvesting limited to eastern half of Sensitive Area due to limited budget /amount of EWM present. 28
 Treatments Sept., 2014 PI (Pre-Harvest) Oct.")
 Aug.")
31 Figure 23 EWM Distribution within Golden Lake and location of Hand Harvesting (Venture) Treatments Sept., 2014 PI (Pre-Harvest) Oct., 2015 PI (Post) w Venture-Harvest Superimposed Oct., 2015 PI (Pre-Harvest) Aug., 2016 PI (Post) w Venture-Harvest Superimposed 6/4/16 6/18/16 Venture Location: 29
 Sept.")
32 Figure 24 EWM Distribution within Golden Lake and location of Hand Harvesting (Venture) Treatments August., 2016 PI (Pre) Sept., 2017 PI (Post) w Venture-Harvest Superimposed 6/10/17 6/10 & 6/24/17 6/24/17 Venture Location: 30


33 Figure 25 Summary of All Management Activities on Golden Lake
34 Golden Lake Management Plan Goals: As part of the Aquatic Plant Management Plan for Golden Lake (2015), the Association adopted the following criteria that requires management (page 37 of 2015 Lake Management Plan): Presence of EWM/Hybrid at greater than 25 Points (15% of total number of waypoints in area less than 13 ft. in depth and an average density (Rake Fullness) of greater than (1). Areas that have a Rake Fullness greater than (2), or areas where EWM tops out and interferes with recreation While the goal of 25 points was almost met in 2016 (25 points Sept 2016 Partial PI Survey, Figure 20), Milfoil has rebounded both in and out-side the Sensitive Areas. While the Average Rake Fullness for sites outside of the Sensitive Area remain fairly consistent at 1.21 (high of 1.46 in May, 2013 Survey), the Average Rake Fullness for the Sensitive Area has increased dramatically to 2.21, well beyond the 1.46 May, 2013 Survey, prior to the 2013 treatment. An Analysis of the number of sites having EWM present during each of the (4) Full P/I Surveys is provided below: Area # Sites EWM # Sites EWM # Sites EWM # Sites EWM Present May, 2013 Present Aug., 2013 Present Sept., 2014 Present Sept., 2017 Inside Sensitive Area Outside Sensitive Area Total A discussion of the Results for each of the management strategies employed by the Golden Lake Association follows: Analysis of Eurasian/Hybrid Watermilfoil Treatment Results Chemical Controls It is quite apparent that the initial treatment in May, 2013 had a very positive impact in terms of reducing the amount of EWM in Golden Lake. The number of sites having EWM present in dropped from 118 in May, 2013 to 70 in August, Herbicidal effects were even observed in the Sensitive Area, which did not receive direct treatment with 2,4-D. EWM increased slightly in regards to frequency, with 72 sites overall in This was due to an increase in the number of sites present in the Sensitive Area (19 sites vs. 17). EWM was again reduced in 2015 following the May herbicide treatment. While the number of sites within the Sensitive Area decrease slightly (19 sites to 17), a more marked decrease was found in the areas outside of the Sensitive Area (53 sites to 28). While this can be attributed, in part, to a reduction in the number of sampling points (Partial PI vs. Full), there was a considerable reduction in EWM frequency (and density) within the treatment area along the south shore (see Figure 20, page 26). The Partial PI Survey in 2016 showed a further decrease in the amount of EWM, down from a total of 45 sites (28 outside, 17 inside Sensitive Area), respectively to only 25 (17 Outside, 8 within Sensitive Area). There was a significant decrease within the treatment area along the west shore. Cont d on following page 32

 with an average weight of 35 pounds of invasive plants.")


35 Diver Assisted Scuba Harvesting (DASH) The initial year of DASH, June 2016, had a positive impact in eliminating the presence of Curly Leaf Pondweed (CLP) in Golden Lake s Sensitive area. In May 2016, a visual survey was performed prior to the commencement of DASH in the Sensitive Area. This visual survey determined that CLP was the predominant invasive with only minimal EWM in the area. DASH removed 12,985 pounds or 371 bags (measuring 19 inches x 32 inches) with an average weight of 35 pounds of invasive plants. A year later, a visual review of the area during its growing season in May and June 2017, indicated very small amounts of CLP. The 2017 PI Survey also noted 0 sites (for CLP) in the Sensitive Area. DASH was effective in the removal of CLP. The second year of DASH, June 2017, four days of harvesting EWM was done in the eastern portion of the Sensitive Area with significant EWM and the location of the most boat traffic. This year DASH removed 15,250 pounds of weeds or 305 compacted bags weighing 50 pounds each. Due to high cost and limited grants funds, the western EWM was not harvested. Limited effectiveness was shown in the areas harvested (Fig. 21). Future EWM management should consider that one year with only 4 days of DASH EWM removal was not enough to determine DASH effectiveness. The Golden Lake Association has been informed by the DNR that DASH removal s best results occur when removal is performed over 4-5 years in an area of concentration. Based on the results of the 2017 Survey, the number of points of EWM has increased in the Sensitive Area (Figure 20) and the rake fullness has increased to 2.21 while other parts of the lake are at 1.21 rake fullness. Repetition of DASH for subsequent years harvesting all the EWM present should be considered to determine its impact and effectiveness to maintain and preserve the Sensitive Area s ecological resources. A comparison of EWM present within the Sensitive Area during each of the PI Surveys if provided below: EWM Sites May, 2013 EWM Sites Aug., 2013 EWM Sites Sept., 2014 # Sites Present: 27 # Sites Present: 17 # Sites Present: 19 EWM Sites Oct., 2015 EWM Sites Aug., 2016 EWM Sites Sept., 2017 # Sites Present: 17 # Sites Present: 9 # Sites Present: 20 33
36 Hand Removal (Venture Crew) The initial year of Venture, 2015, had a positive impact maintaining a reduction in EWM from post-harvest 2015 to post-harvest 2016 (Fig. 22). The area of harvest was north of Rhino Point outside of the Sensitive Area. The amount of EWM harvested was 151 cubic feet. Prior to Venture hand pulling there were 7 sites on the September 2014 PI Pre- Harvest (Fig. 22). After harvesting, subsequent PI s showed 1 site on both the October, 2015 and August, 2016 PI Surveys, both with rake density 1. After 2 seasons ( ) of no harvesting performed in this area, the Sept 2017 PI has shown an increase of EWM in the area (Fig. 23). In 2016, Venture conducted 2 days of hand pulling, removing 114 cubic feet of invasive plants. The first dive was off the north shore around the northeastern border of the Sensitive Area. Harvest site is pictured in light blue in (Fig 22) August, 2016 PI (Post) photo. Prior to harvesting, there were 3 sites of milfoil on the pre-harvest October, 2015 (Fig. 22) and after harvest there were no sites on the August, 2016 PI (Fig. 23). A year later the Sept PI (Post) (Fig 23) showed effectiveness in 2 of the 3 sites. The one site that showed minimal EWM was in the Sensitive Area. This can also be seen on page 32 EWM Sites Sept., 2014 through Sept 2017 by comparing the 3 points at the northeastern corner of the Sensitive Area border. The second 2016 Venture was on 3 sites of the western shore in the Sensitive Area - see Fig 22 August, 2016 PI (Post) Venture harvest - 3 western light blue dots. Here, harvesting assisted in removing remaining scattered CLP and some (minimal) EWM. Venture 2016 CLP removal was effective, resulting in 0 sensitive area sites for CLP (see Sept. 8, 2017 Fig. 8) Venture 2016 EWM removal on the western Sensitive edge was not as effective as seen a year later with an increase in sites and density (see page 32 EWM sites Sept 2017). In 2017, 239 cubic feet of EWM was harvested. The first hand pulling was conducted in the bay 500 feet off of the east shore at the end of Krueger Road. Two years (2013 and 2015) of herbicide treatment had been applied there. Prior to this harvest, 5 sites with minimal milfoil were present ( Fig 23 August, 2016 pre-harvest). Although milfoil was removed here, the site number (5) and density (minimum, Fullness = 1) have remained the same but some of the sites have been relocated. The final 2017 hand pull was done north of the Boat launch due its high boat traffic. No EWM was noted in the area (Sept 2017 PI) after the hand pull as seen in Fig 23. To summarize: 1. DASH in 2016 harvested significant amounts of CLP with good results as no CLP was indicated in this area in the 2017 PI Study. 2. DASH 2017 was the first year of EWM Sensitive Area harvest and limited funds reduced the area of harvest. It is difficult to determine effectiveness because of the limited area of focus and limited number of days of harvest. Information from the DNR indicates harvesting over a 4+ years period is needed to determine its effectiveness. 3. Venture 2015 hand pull significantly reduced EWM north of Rhino Point outside of the Sensitive Area for a period of 2 years post-harvest. As of Sept 2017 there is an increase of EWM here. 4. Venture 2016 helped to eliminate the CLP in the Sensitive Area not harvested by DASH and had an influence in reducing EWM off the northwest shore. 5. Venture 2016 helped to reduce the EWM just outside of the Sensitive Area on the north. Venture 2017 control site along the east bay off Krueger Rd maintained the number of EWM sites of EWM at the same level. 6. Venture 2017 control site near the boat launch showed good results with no EWM remaining. 7. DASH and Venture have shown some positive results during the initial years of harvesting on Golden Lake and therefore should be considered as viable options for EWM management in future years and grant applications. 34
37 Hand Removal (Venture Crew) cont d. 8. Venture is best suited for small concentrated areas of AIS and clumps of AIS spread out over an area. Venture is a cost-effective removal option that is 75% reimbursable via DNR Grants. 9. DASH is best suited for highly concentrated, larger areas of AIS. DASH is a costly removal option. DASH is an expensive removal option that is 75% reimbursable via DNR Grants. Recommendations for 2018 A graph detailing the Frequency of Occurrence for EWM during the surveys, along with a Table indicate average Rake Fullness is found on the following page (Figure 25). Based upon the Association s desires and any DNR limitations, chemical controls may or may not be required for While EWM in most of the lake is relatively sparse (Rake Fullness of 1) and infrequent (mixed in with population dominated by native species), problem areas may quickly redevelop and require attention in For this reason, the Association may wish to plan for a treatment in Figure 26 details the location of significant populations of EWM that remain. The first area (Area #1) is along the west shore immediately south of the Sensitive Area. It has relatively dense EWM at regular intervals at the north end. The frequency of EWM observations, as well as the density of plants decreases to the south. This bed is expected to be a maximum of 5-6 acres in size in Smaller, but relatively dense (Rake Fullness of 2) populations are also found in Areas #2 and 3. The final area is the Sensitive Area itself, with a dense canopy reaching the surface (see Figure 26). While the worst growth (Rake Fullness >2) is focused on an area approximately 8 acres in size, the overall size of the infestation is approximately acres. The Golden Lake Association Board has met and reviewed this Survey and its Conclusions. Board Conclusion: Chemical Treatment, Hand Removal and DASH are all viable options for AIS management. Based upon yearly AIS growth, DNR Grant availability and Association funds, the Association will be continue these management activities in 2018 and forward. An Update to the Aquatic Plant Management Plan prepared in 2015 begins on page 37 with a discussion of Aquatic Plant Management Alternatives. 35
38 % Littoral Frequency of Occurrence EWM Figure 26 Frequency of Occurrence Golden Lake, Waukesha/Jefferson Counties, WI % % 21.9% 16.1% 10 May, 2013 Aug., 2013 Sept., 2014 Sept., 2017 Avg. Rake Fullness for EWM Golden Lake, Waukesha/Jefferson Counties, WI Survey Date May,, 2013 Aug., 2013 Sept., 2014 Sept., 2017 Avg. Rake Fullness
 Area 1: 5-6 acres (max.) Area 3: 1.0 acres (max.")
39 Figure 27 Areas of Golden Lake Requiring Management of Eurasian/Hybrid Watermilfoil in 2018 Area 2: 1.5 acres (max.) Area 1: 5-6 acres (max.) Area 3: 1.0 acres (max.) 37
40 Aquatic Plant Management Alternatives As indicated in the Introduction, the primary intent of the 2017 survey was to document the aquatic plant community of Golden Lake and monitor it for any changes. With this information in hand the Lake Association decided to take this opportunity to review the entire plant community, both native and non-native, and review all potential plant management options. Once it has been determined that plants, whether by species (native and/or non-native), abundance, or location within high-use recreational waters are causing a nuisance, an attempt can be made to review and select amongst the control alternatives available. These can be selected based upon the degree of control desired, species present, growth habits of the nuisance plant, location in the lake, size and/or depth of the proposed control area, as well as applicable regulations. Several control methods are currently available to lake residents or organizations within the State of Wisconsin. These include: 1. Manual (physical) Removal, including hand-pulling, raking, or cutting (DASH and Venture hand harvesting). Labor intensive, these are best suited to relatively shallow, near-shore areas. State regulations currently allow residents to manually cut/pull and remove aquatic vegetation along their shoreline without a state (DNR) permit providing that the activity occurs along no more than thirty (linear) feet of shoreline if the vegetation targeted consists of native aquatic plant species. If more than thirty feet of shoreline is to be managed, a permit is required except for instances where the target species is non-native (invasive), such as the case of Eurasian Watermilfoil and/or Curlyleaf Pondweed. Finally, when the frontage is within a WI DNR designated Sensitive Area a NR109 permit is required for hand removal. DASH removal requires a DNR Permit as does the larger scale use of Venture hand pulling. 2. Habitat Manipulation can include temporary activities, such as the installation of bottom-barriers, or more permanent, such as the deposition of sand on the lake bottom. In either event a permit is required. Dredging (permit required), may also be an option for plant control under some limited circumstances. 3. Biological Controls, include plant eating fish (White Amur or Grass Carp), and insects. It is important to note that the import of the White Amur is banned within the State of Wisconsin. Milfoil Weevils, once popular, are currently not commercially available. Their introduction into a lake requires an approved WI DNR permit. 4. Public Information and Education, includes informing the public about the benefits of native plant population, how to identify aquatic invasive species, preventing their spread, and the tools available for control, along with regulations pertaining to their use. This includes the Clean Boats Clean Waters program for boaters. 5) Aquatic Herbicides and/or Algaecides are chemical compounds specifically formulated to control excessive plant and/or algae growth. These products may be used for aquatic plant control only if they are registered for use by the United States Environmental Protection Agency (USEPA) and the Wisconsin Department of Agriculture (DATCP) in lakes, ponds, etc. Their application is regulated under a permit system by the WI DNR. Further, the type of product that can be applied to a public body of water by individuals is limited to granular formulations to sites under 0.25 acres in size, unless it is applied by an certified applicator (WDATCP). 6. Mechanical harvesting involves the cutting and collection of aquatic plants using a single large piece of equipment mounted on a pontoon-type barge. Once full of plants, the harvester returns to shore to off-load the plants. On larger lakes, transport barges are used to collect plants from the harvester for transport to and unloading site. Harvesters are available in a number of sizes. The largest can cut swaths of vegetation up to 10 feet wide at depths of 0-6 feet deep. 38
41 Proposed Aquatic Plant Management Plan The surveys conducted indicate that Golden Lake contains a highly diverse and unique native aquatic plant community. It also contains significant amounts of both EWM and its Hybrid. These all can create conflicts with lake users if they develop in great enough density in high use areas. The Data suggests that selective controls, such as 2,4-D, can be effective in controlling EWM in a manner that has minimal effect upon most native species of plants. Native species dominate the shallow (up to 4 feet in depth), nearshore plant community, whereas EWM becomes more noticeable beginning at the 5-ft. contour and increases in abundance with depth. In Golden Lake, EWM typically becomes problematic, forming dense canopies that impede motor traffic and shade native plant species between 5-12 feet. Native plant species also occur at densities that can impede recreational activities, such as swimming and boating within high use areas. Manual and mechanical techniques are generally preferred for control of native plants, as they control, rather than kill the entire plants. As a healthy and diverse native aquatic plant population is a necessary component of a lake ecosystem, it is important to manage them, if desired, in a manner that protects them in the long term by limiting controls to areas where they significantly impair the waters recreational usage. Aquatic plants play a vital role in the health of a lake system, including: Serve as a food source for waterfowl Provide habitat for small fish and the aquatic insects they feed upon. Contribute to good water clarity by binding up sediments that would otherwise be stirred up by wind and wave action. They can also assist in reducing the likelihood of troublesome algal blooms (both filamentous and/or plank - tonic, Pea Soup variety) by taking up space and nutrients (phosphorus and nitrogen). Native plants by their presence can reduce the severity of invasions by non-native species, such as Curly-leaf Pond- weed and/or Eurasian Watermilfoil. We therefore recommend a strategy that favors protection of the native aquatic plant community while providing for their control in high use recreational areas. Rather than an eradication strategy for Eurasian and Hybrid Watermilfoil, we recommend a strategy that minimizes the formation of dense surface canopies that can interfere with recreational use and may pose a risk to the native plant populations. Recommended control measures will now be discussed in greater detail in the following Section of this Report. 39
42 Recommended Aquatic Plant Control Strategies The following are recommend to be considered in the Golden Lake Management Plan. A. Information and Education The Association is encouraged to disperse information to their residents regarding the importance of plants, the controls available, as well as the circumstances where control may be necessary. Information can be distributed by many forms of media, including: 1) Electronic: Via or website. 2) Newsletter: Via , or website. 3) Availability of Literature at regular Meetings. 4) Volunteer Opportunities such as participation in the Clean Boats, Clean Waters, for example. 5) Posting of Educational Signs at Boat Launch. 6) Association representation at annual Wisconsin Association of Lakes conferences. Examples of a variety of Educational Materials available through the WI DNR is located in Appendix B. B. Manual (Physical) Removal Hand removal can be an effective tool in small, relatively shallow, near-shore areas. Residents should be encouraged to utilize this technique in and around piers and swim areas. Residents should also be notified that a permit for this activity is required unless: Removal of plants is restricted to less than thirty feet of shoreline and is not assisted by mechanical means (ex., suction removal) Plants targeted include Eurasian Watermilfoil or Curlyleaf Pondweed (Aquatic Invasive Species) Area of removal is not located within Golden Lake s Sensitive Area. Residents may remove plants themselves, or hire individuals/firms qualified to do this work. A list of vendors offering manual removal services is located in Appendix C. C. Hand Harvesting via Venture Crew This method of removal utilizes scuba divers skilled in AIS identification. The trained divers are best suited to remove AIS in areas that are relatively shallow, are less dense or in relatively small clumps spread out in a specified area. The divers remove AIS plants including roots. The AIS is placed in netted bags, given to support team members in kayaks/ boats and taken to shore. Once on shore, the AIS is placed in containers and taken to a proper disposal site. Support team members in kayaks/boats net AIS fragments to negate the effects of fragmentation. This method of harvesting is best done in early summer, while the AIS is growing and plant structure is strong. This method is cost effective, but requires substantial number of volunteers to support the dive staff. A DNR permit is required for this removal option. 40
43 D. Diver Assisted Suction Harvesting (DASH) Diver Assisted Suction Harvesting (DASH) is best utilized in removal in large, high-density beds of EWM or other AIS. Surface supplied air allows divers skilled in AIS identification to remain underwater for an indefinite period, greatly improving efficiency and allowing a more systematic approach to a large AIS stands. Once underwater, a team of two divers removes the roots and plants and feeds them into a 50-ft. suction hose. The entire plant is then transported via suction hose to the deck of a boat at which point the AIS is pumped into large mesh nets for collection. Water from this process is then returned to the lake and only AIS remains in the nets. Support team s net fragments to negate the effects of fragmentation. The collection boat takes the mesh nets to shore, where they are off loaded to a truck for disposed at a proper site. This method of harvesting is best done while the AIS is growing and plant structure is strong. DASH is an expensive AIS control option. The number of volunteers need to support the method is less than Venture hand harvesting. A DNR permit is required for this removal option. E. Mechanical Harvesting Mechanical harvesting of native aquatic plants, or in beds containing a mixture of both native and non-native species is often recommended, as needed, to maintain recreational access. A permit from the WI DNR will be required for this activity. While at the time of this Report there are no immediate plans for harvesting, due to both to limited funds and the perceived need (frequency of conflicts with native plants), this will continue to be evaluated in the future. Areas where Mechanical Harvesting may be considered by the WI DNR include maintenance of private or public access within highuse recreational areas. It also be necessary to provide for skimming of floating fragments on any future harvesting plans. Considerations for the pursuit of mechanical harvesting include: Accurate determination of the location and size of area(s) and depth to be harvested. Species present (low vs. tall growing species) and contour of the lake bottom. Areas requiring harvesting may vary year to year based upon weather, degree of plant growth, etc. Start Date: A typical start date of approximately June 1 is anticipated. Weather, growth stage of plants, and DNR permit restrictions may require a later or earlier start. Frequency of Harvesting: A maximum of (4) monthly harvests between June and September is anticipated. Disposal Site: A disposal site must be clearly identified by address and /or location on a map accompanying the DNR Permit Application. Costs for harvesting on an annual basis will be dependent upon the size of the area (acreage) to be harvested and the number of times it will be conducted during the year (two to four times/season is typical). Contractors typically have a Minimum per visit cost of $ $ , and the typical (average) per acre cost of approximately $ Cont d on following page 41
44 Mechanical Harvesting cont d The following Table lists some of the commonly accepted Advantages and Disadvantages of Mechanical Harvesting. Advantages Water can be used immediately following treatment. Majority of cut plants are removed Less plant material left to decay. Some plant material is left behind to serve as habitat for fish, aquatic insects, etc.) Provides for a limited amount of nutrient removal, along with plants Control can be confined to a well defined area. Disadvantages Regrowth may occur quickly (2-4 weeks) Not all cut plants are removed. Fragments may form floating mats and/or generate new plants (Milfoil) Removal of some non-target organisms (fish, aquatic insects, etc.) is likely to occur. May be cost prohibitive, depending on number of harvests required in a season. Efficiency (acres/day) varies widely, dependent upon plant density, distance to plant un-loading site, and wind. Finally, due to a variety of reasons there are a limited number of Harvesting Contractors in the State of Wisconsin. Thus, their schedules are typically fairly full with time allotted on a first come, first serve basis. New clients are encouraged to contact them early in the year (January) before there is fully Booked for the season. F. Herbicides As indicated earlier, the Association has elected to have areas infested with EWM treated using formulations of 2,4-D. The use of selective herbicides to control dense, mono-typical stands of Milfoil (or Curlyleaf Pondweed) is recommended. It is important to note that other tools may be used (as mentioned earlier) to control smaller, isolated infestations, or plants interspersed with native plant species. While harvesting of native plants is recommended in the event that their density should become problematic, its use is likely restricted to waters greater than three feet in depth. Therefore, in the instance where the degree of infestation is too severe to remove plants by manual means, some other tool may be needed. It is under these circumstances where treatment for native species may be appropriate. While treatment of native plant species is not recommended at this time, it is not the intent of this Plan to expressly prohibit it in the future. While the WI DNR does not prohibit treatment of native plants, it is strongly discouraged except for instances where especially dense infestations in shallow waters (less than 3 feet) make recreational areas virtually impassable. While herbicide treatments for control of aquatic vegetation may be cost-effective, their use does have limitations and/or disadvantages, including: While effective, control is limited in length (months) requiring re-treatment While some herbicides are narrow-spectrum (only control a limited number of species), negative impacts may be observed on desirable (native) species. May contribute to the accumulation of dead, decaying plant material Nutrients within the dying plant are released. This may, or may not, in turn, affect algal production. This will be dependent upon a variety of factors, including treatment area size, water temperature, depth, etc. Any proposed treatment will require DNR permit approval. DNR Permit may or may not require supervision on the day of treatment. WI DNR has requested the Association s acceptance of a proposal to conduct a Pre-Treatment Survey in lieu of an on-site supervision on the day of treatment. Such practice is commonplace on other lakes in southeast Wisconsin to avoid treatment delays. 42
45 Herbicide Treatment Options Option A. Spot-Type Applications Spot-Treatment with 2,4-D alone for control of Eurasian Watermilfoil on Golden Lake is considered by the WI DNR as a viable option for control. DNR recommendations for Spot-Treatment suggest that 2,4-D may be used at a concentration of up to 3.5 ppm, up to approximately ten acres. A concentration of ppm liquid 2,4-D equates to approximately gallons of product applied per acre-ft. of water. Depending on the portion of Golden Lake being treated, a good estimate of average depth would be five to seven feet. Thus, fifty to seventy acre-ft. of water (maximum) may be treated with a minimum /maximum of gallons of 2,4-D for treatment area ten acres in size. A herbicide treatment plan should allow for a second treatment, if needed, later in the season. This should not add appreciably to the risk upon native species, particularly if applied late in the Fall when most native plant species are entering dormancy. This would offer a higher likelihood that any problem areas developing later in the season be addressed before they reach a size where an entire lake treatment is required. Option B. Whole Lake, Low Concentration Treatments The concept of a whole-lake, or epilimnetic treatment using a combination of Aquathol-K and liquid 2,4-D has been discussed and has been judged to be unnecessary and unaffordable at the present time. However, the population of Eurasian/Hybrid Watermilfoil in Golden Lake can be expected to change over time, and it is the Objective of this Plan to identify and consider all potential treatment alternatives, both for now and for the future. Ongoing research in Wisconsin has provided for treatments of an entire lake volume, or the entire epilimnion of a lake. Entire lake volume treatments can be conducted in relatively shallow lakes where thorough vertical mixing occurs and thus, no thermocline exists. Epilimnetic treatments occur once a thermocline forms in lakes of sufficient depth, and after the depth at which the thermocline forms can be measured. Both occur early in the season when AIS target plant biomass is at a minimum, native species are for the most part, dormant, and water temperatures are cool. This results in a relatively long herbicide half-life and exposure time that allows for lower herbicide concentrations to be used. The costs of most of the Options available for Epilimnetic Treatment of Golden Lake are cost prohibitive. However, these should not be dismissed entirely in the future as cost-sharing may be available through AIS Grants (WI DNR). While an entire lake, epilimnetic treatment for Golden Lake may be appropriate at some time in the future, it is not recommended at this current time for the following reasons: 1. Higher costs in comparison to Spot treatments: Current DNR research regarding lake-wide treatments seem to indicate that more than one season of control may be obtained at certain 2,4-D concentrations. However, until this Research is complete, we cannot be sure if these higher treatment costs will be offset by a greater length of control. 2) Lack of solid Bathymetric (water volume) Data: This makes it difficult to precisely determine the quantity of liquid 2,4-D herbicide (in gallons) required to achieve the desired target (part per billion) concentration. 3) The relatively low abundance (density and number of locations) of Eurasian/Hybrid Watermilfoil at present. On the other hand, the milfoil population is subject to change and thus, this type of treatment remain in consideration for the future under the following conditions: 1) Accurate determination of lake volume within certain depth contour becomes available. This may, or may not require an updated bathymetric survey of the lake using modern methods. Annual monitoring of the thermocline will also assist with planning. 2) The Associations Objective to control AIS within an acceptable level changes to one to control it lake-wide to the greatest extent possible. 3) That spot treatments fail to maintain control of the nuisance and the Milfoil population returns to unacceptable distribution and density. 43
46 Proposed EWM/Hybrid Milfoil Spot Treatment Strategy For the immediate future we recommend limiting treatments to applications of no more than 175 gallons of liquid 2,4- D at one time. Concentrations to be applied will range from 2 to 3.5 ppm. This may be changed in the future according to need (success of prior years treatment), anticipated costs, and availability of funds. As stated earlier, a second treatment could be conducted later in the year, if warranted. The actual treatment size and timing will be determined by a variety of criteria that will be used to monitor the EWM/ Hybrid population. These will include: 1) A comparison of the current lake conditions relative to prior surveys. Survey data and visual survey data exists for multiple years. Milfoil growth representing a minimum of 2 on a Rake Fullness scale of 1-3 is an unacceptable condition that requires management. 2) Point Intercept Data, including Frequency (# site Milfoil present), and Density and Distribution. The Association can use the number of sites (existing PI Points) where Milfoil found as one criteria. Golden Lake s goal is to maintain at 15% of total waypoints. While lakes within the Eco-Region (Southern Wisconsin Till Plains or SWTP) vary widely in terms of their Frequency of Occurrence, the average for the region is significantly lower, approximately 17%. 3) Density: Density Data can be collected on a survey date, with it being measured on a Rake Fullness Scale (0-3) for Milfoil. At the end of the survey, Rake Fullness can be tabulated with the Result of the Sum being divided by the number of points where Milfoil was present. By this measure, an average density closer to 1 would be much more favorable than one closer to 2. A discussion of the methods used to collect this EWM/Hybrid data follows. G. Aquatic Plant Monitoring We recommend an annual Fall Survey of all PI points at 13 feet or less in depth, with the exception of the far north end of the lake. Data collected will include Absence/Presence of Milfoil, Depth and Rake Fullness. Criteria which will require a chemical treatment will include: 1) Presence of EWM/Hybrid at greater than 25 points (15% of total number of waypoints in area less than 13 ft. in depth) and an average density (Rake Fullness) of greater than (1). 2) Areas that have a Rake Fullness of (2), or areas where Milfoil tops out and interferes with recreation (navigation/ swimming). The data from the Fall surveys can then be used to project treatment requirements for the following year, as well as compare the Milfoil population year to year. Survey costs in the range of $1, $2, can be anticipated. The Association will attempt to conduct a full Point Intercept Survey every five years or so. Survey cost in the range of $5, $6, can be anticipated. Page 44 lists (in Table Form) the Association s recommended activities. The Appendix contains the original DNR Sensitive Area Assessment conducted in 2006, as well as other helpful information for the Association s consideration. H. Miscellaneous Considerations and Recommendations The importance of knowing, with a high degree of accuracy, either the entire lake volume, or the volume that lies above a certain depth contour is important. Without this information it is very difficult to begin discussing the feasibility of cost of large scale treatments. The cost of a Bathymetric Survey will be approximately $5, In the future it may be necessary to conduct a treatment of the entire lake. A whole lake treatment can be partially funded (75%) via an Aquatic Invasive Species Grant administered by the Wisconsin DNR. Finally, while not specifically required to be discussed in this Plan, implementation of a Water Sampling Program to monitor the quality of water runoff from the surrounding watershed is recommended. A Draft of the specific Protocol, is provided in the Appendix. 44
47 Figure 28 Summary of the Golden Lake -Waukesha & Jefferson Counties, WI Aquatic Plant Management Plan Recommended Activities Information and Education Physical Removal Ongoing. Obtain literature regarding Invasive Species for distribution to members and /or post Boat Launch with information regarding AIS. Attendance at annual Wisconsin Association of Lakes Conference and participation in Clean Boats Clean Waters program, as needed. Educate and promote removal in pier/swim areas, by property owner. Thirty feet of shoreline may be maintained by manual means w/o WI DNR permit approval. Removal along greater than 30 ft. of shore requires WI DNR Permit (Exception for non-native species). DNR Permit is required if property is within Sensitive Area for any removal activity. Continue the use of Venture Crew hand pulling in select areas with AIS (WI DNR Permit required). DASH and Mechanical Harvesting Herbicide Treatments Aquatic Plant Monitoring Continued use of DASH in Sensitive Area of lake for control of AIS. Need for DNR Grant funds for DASH is essential because of its cost. Mechanical harvesting and collection of plants will not be conducted in immediate future due to limited need and relatively high expense. This will be under continued consideration in future for management of primarily native plant populations. Annual Spot treatments (1-2x/yr.) for selective control of Aquatic Invasive Species (AIS). Objective: To minimize formation of plant beds dominated by AIS and impacts upon recreation. Control Milfoil within Association established standards. Evaluate lake-wide treatment options, if needed in future. Recommended when 25 acres (or more) of lake have EWM at density of (1.5)or greater and total number of points present is equal or greater than 105. Annual Fall Survey for EWM/Hybrid Milfoil using prescribed methodology. Identify number of PI Points with Milfoil and Rake Fullness (Density), where present. Full PI Survey recommended by WI DNR every three to five years. 45
48 APPENDIX Aquatic Plant Survey and Management Plan for Golden Lake Waukesha and Jefferson Counties, WI March, 2015 (Updated November, 2017) Appendix A DNR Sensitive Area Assessment Appendix B. Examples of Educational/Informational material Available for Lake Groups Appendix C. Potential List of Suppliers for Aquatic Plant Management Services Appendix D. Water Sampling Project Protocol (Proposed) Appendix E. Historical (1998) Map by J. Prah showing EWM Distribution on Golden Lake
49 Appendix A

50
51
52

53
54
55
56
57
58
59


60 Appendix B Example of Boat Launch Signage Available through UW Extension


61 Appendix B cont d. Example of Literature Available through UW Extension
62 Appendix C Potential Supplier List Aquatic Plant Management Services I. Physical (Manual) Removal Venture Crew 519 Mike Whittlieff (608) mwittlieff@sbcglobal.net Sweeney s Aquatic Weed Removal, LLC David Sweeney aquaticweedremovers@gmail.com website: II. Diver Assisted Suction Dredging EcoWaterways Pat Dalman W346 S4109 Virgin Forest Drive Dousman, WI (Pat) (Gregg) III. Mechanical Harvesting Midwest Aquatics Dave Fetzer N105 W14564 Wilson Dr. Germantown, WI Local (262) ClearWater Plant Harvesters, LLC 7135 Fairway Dr. Crystal Lake, IL
63 Appendix D Proposed Water Quality Sampling Project Protocol
 by Lake")
64 Appendix E Sketch Map of Eurasian Watermilfoil Distribution in Golden Lake (1998) by Lake Resident