Particulate Matter Prediction and Source Attribution for U.S. Air Quality Management in a Changing World
|
|
|
- Gerard Hart
- 5 years ago
- Views:
Transcription
1 Particulate Matter Prediction and Source Attribution for U.S. Air Quality Management in a Changing World Xin-Zhong Liang (PI), xliang@umd.edu University of Maryland, College Park, MD Co-PIs: Donald J. Wuebbles, University of Illinois, Champaign, IL Zhining Tao, Goddard Earth Sciences Technology & Research, Greenbelt, MD Russell R. Dickerson, Hao He, University of Maryland, College Park, MD RD
2 Objective To better understand how U.S. air quality evolves in a changing world, to attribute key sources for PM 2.5 and O 3 episodes, and to provide actionable information for designing effective dynamic management strategies to sustain U.S. air quality improvement RD

3 Approach Apply an advanced dynamic prediction system to determine individual/combined impacts of global climate & emissions changes on U.S. air quality Quantify pollution sources and assign their attribution natural vs. anthropogenic emissions, national vs. international agents, natural variations vs. climate changes Develop a time line for the global change factors to become significant to take effective actions

4 Science Concept
 The import of aerosols to North America is 64 Tg/a, including trans-pacific dust and pollution aerosols and trans-atlantic dust.")
5 a) Satellite-based estimate of dust mass flux in East Asia outflow and North America inflow. b) The import of aerosols to North America is 64 Tg/a, including trans-pacific dust and pollution aerosols and trans-atlantic dust. c) The annual emissions and productions of aerosols of 69 Tg/a from major domestic sources in North America. Primary PM emissions include only anthropogenic sources (excluding prescribed fires). Yu, H., L.A. Remer, M. Chin, H. Bian, Q. Tan, T. Yuan, and Y. Zhang, 2012: Aerosols from overseas rival domestic emissions over North America. Science, 337,

6 Air pollution contribution by China emissions embodied in export Lin, J.-T., D. Pan, S.J. Davis, Q. Zhang, K. He, C. Wang, D.G. Streets, D.J. Wuebbles, and D. Guan, 2013: China s international trade and air pollution in the United States. Proceedings of the National Academy of Sciences, 111,


7 U.S. Impact of Canadian Wildfires (a) MODIS Terra AOD (b) Maximum 8-Hour Ozone (c) 24-Hour Average PM2.5 Even a single wildfire event can put a region out of compliance with O 3 or PM 2.5 standards Need for a method to quantify and justify O 3 or PM 2.5 impacts from wildfires This requires models based on observations Dreesen et al. (2016)
 OBS BHI COR MDA8")
8 Circulation Pattern c) OBS BHI COR MDA8
9 Decadal Change GPLLJ, Bermuda High, Ozone 3 2 MDA8 (Central U.S ppb) MDA8 (Eastern Coast 5.87 ppb) 1 BHI (0.76 hpa) Zhu, J., and X.-Z. Liang, 2013: Impacts of the Bermuda high on regional climate and air quality over the United States. J. Climate, 26,
10 Defining Episodes EPA s National Ambient Air Quality Standards O 3 daily 8-hr maximum 70 ppbv PM 2.5 daily average 35 µg/m 3 annual average 12 µg/m 3 (primary) 15 µg/m 3 (secondary) Episodes may be defined by the number of monitoring sites that violate the daily NAAQS in the U.S. or five states, IL, MD, TX, CA, GA
11 All sites of O3 ( ) and PM2.5 ( ) Sites with more than 75% time coverage

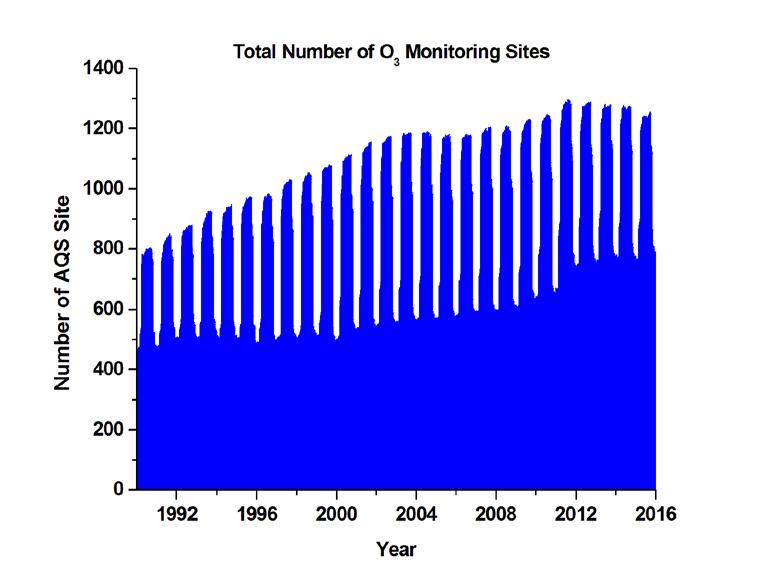

12
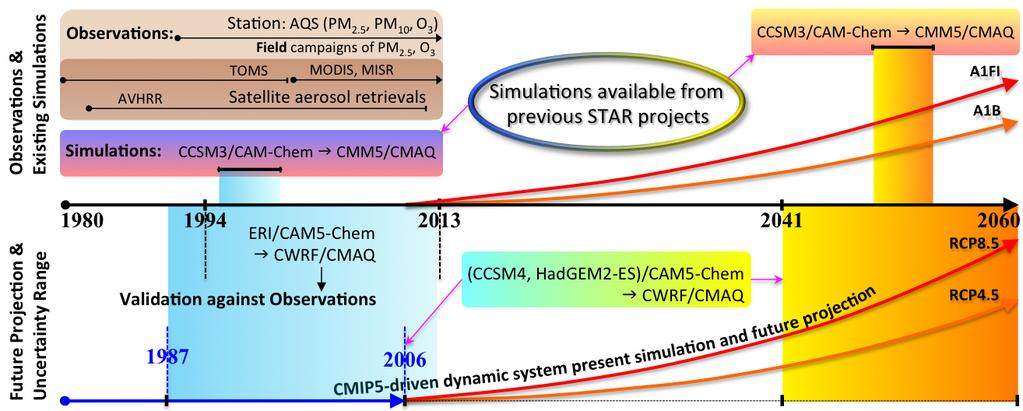
 Our approach [1] Use the latest NASA MERRA-2 aerosol reanalysis with historical meteorological data [2] Use the nested GCCT/RCAQ dynamic prediction system")
13 Defining Episodes Difficult to identify extreme events and long-term trend of PM 2.5, given short data records ( ) Our approach [1] Use the latest NASA MERRA-2 aerosol reanalysis with historical meteorological data [2] Use the nested GCCT/RCAQ dynamic prediction system simulations Buchard et al. (2016) showed that MERRA-2 aerosol reanalysis can capture PM 2.5 seasonal-interannual variations in the U.S.

14 Dynamic Prediction System Nested GCCT/RCAQ

15 CAM5-Chem Test Meteorology: MERRA-2 (later ECMWF Interim) reanalysis to facilitate comparison Chemistry: Couples tropospheric aerosol to chemistry through heterogeneous reactions Emission: POET, REAS, GFED, including ~30 species with speciated aerosols Test simulation: o x 1.25 o over the globe

16 CAM5-Chem/MERRA-2 Black Carbon
17 CWRF-CMAQ Test Meteorology: CWRF driven by ECMWF Interim reanalysis, and MCIP v4.2 modified to convert CWRF output into CMAQ input Chemistry: CMAQ v5.1 with SAPRC07 (gas phase) and AERO6 (aerosol) schemes, online biogenic emissions using BEIS v3.6.1 Test simulation: km grid over the N.A. including CONUS

18 High Canadian/Mexican emissions along the U.S. northern/southern boarder may cause PM 2.5 and O 3 violations in NE/CA.
19 CWRF Improves Precipitation Extremes PCT95 (mm/day)
20 CWRF Improves NCAR Climate Change Projection No of clear days (precipitation < 0.25 mm) Observed Present-day NCAR Present-day NCAR Future Change DIF CWRF Present-day CWRF Future Change DIF Present: Future:
21 Experiment Design
22 GCCT/RCAQ O 3 Change Contributions He, H., X.-Z. Liang, H. Lei, and D.J. Wuebbles, 2016: Future U.S. ozone projections dependence on regional emissions, climate change, long-range transport, and differences in modeling design. Atmos. Environ., 128,
23 CMAQ PM 2.5 Speciations Prediction

24 Summary Defining PM 2.5 episodes is difficult due to the lack of adequate data. We will combine MERRA-2 aerosol reanalysis data with nested GCCT/RCAQ dynamic prediction system simulations. The advanced state of the prediction system will produce more complete scientific understanding of the challenges from global climate and emissions changes imposed on U.S. air quality management and a more reliable projection of future pollution sources and attribution changes. Sensitivity analyses using the prediction system will determine future changes in pollution sources and their relative contributions from anthropogenic and natural emissions, longrange pollutant transport, and climate change effects.