Renewable energy global trends and implementation of the South East Europe Initiative
|
|
|
- Matilda Sharp
- 5 years ago
- Views:
Transcription

1 Renewable energy global trends and implementation of the South East Europe Initiative Vienna - 22 March th Renewable Energy Coordination Group Meeting


2 Content of the presentation IRENA s South East Europe Initiative Update CESEC 2

3 RE Finance - Global overview Renewable energy annual investment by technology type, Source: IRENA and CPI (2018) Global annual investment in renewable energy rose steadily in , peaking at USD 330 billion in 2015 before falling to USD 263 billion in 2016.
 While annual investment declined in 2016, capacity additions in the same year were up from 2015, reaching record-high")
4 Capacity vs investment trends Public and private investment in renewable energy finance, Capacity additions in 2017 Solar PV 98.9 GW Source: SolarPower Europe Wind Source: IRENA and CPI (2018) While annual investment declined in 2016, capacity additions in the same year were up from 2015, reaching record-high levels GW Source: Global Wind Energy Council
 The East Asia-Pacific region was the dominant destination for renewable energy investment during 2013-2016, followed by the OECD Americas and")
5 Renewable energy investment by region Annual renewable energy investment by region of destination, Central Asia and Eastern Europe Average annual investment 2015/ USD billion Source: IRENA and CPI (2018) The East Asia-Pacific region was the dominant destination for renewable energy investment during , followed by the OECD Americas and Western Europe.
6 Recent cost evolution (1) Latest trends in the cost and performance of renewable power generation technologies Global results to 2017, country/regional results to 2016 Detailed analysis of equipment costs and LCOE drivers Integration of project LCOE and Auction results to look at trends to 2020
")
7 Recent cost evolution (2) 7


8 Costs continuing to fall for solar and wind All technologies falling into competitive range Remarkable rate of cost deflation for solar & wind All commercial RE power to be competitive by 2020/22 Drivers: Technology Competitive Procurement Experienced Developers Potential for further reduction by 2025: Solar PV - 59% Onshore wind - 26% Offshore wind - 35%

9 Solar & Wind: LCOE/Auction Price Evolution

10 Storage stationary applications Installed energy costs of battery storage systems to fall 50-66% by 2030 Performance improvements Market to support range of technologies Overall market for electricity storage to grow 2-3X by 2030 Battery storage to grow 17-38X by 2030


11 South East Europe Regional Initiative Update on implementation Action Areas Resource assessment Long-term planning for RE deployment Enabling frameworks: technical, policy, regulatory, institutional Market based RE support schemes Socio-economic benefits vs. affordability Access to financing for RE projects Full alignment with the objectives of CESEC RE Action Plan


12 SUSTAINABLE ENERGY MARKETPLACE Objective: to support initiation, development and financing of sustainable energy projects by:» Improving the transparency of the market» Offering IRENA s tools and databases for market players» Supporting projects at the development stage New geographical coverage:» Sub-Saharan Africa» Latin America» Asia» MENA» Eastern and Southern Europe» SIDS 19


13 RE Statistics Enhancing capacities to improve the collection of reliable data on renewables, in particular bioenergy Training to enhance capacities to improve the collection of reliable data on renewables, in particular bioenergy 5 7 December 2017, Tirana, Albania Co-hosted by the Ministry of Infrastructure and Energy


14 RE project development RE project development training: Governments Project developers Financial institutions A comprehensive platform giving project developers the tools at no cost to create robust, bankable renewable energy project proposals. Academia June 2018 Belgrade, Serbia Co-hosted by the Ministry of Mining and Energy 19


15 Socio economic benefits Renewable Energy Jobs Source: IRENA (2017), Renewable Energy and Jobs Annual Review 2017 South East Europe market analysis with focus on socio-economic benefits In
16 Planned activities for 2018 and 2019 Renewable Energy Prospects for the CESEC region South East Europe market analysis with focus on socio-economic benefits Workshop on grid integration of intermittent renewables Additional capacity building activities on regulatory and policy aspects Renewable Readiness Assessment for the Republic of Moldova 16
17 Renewable Energy Prospects for South East Europe
18 What is REmap? #REmap REmap explores: Renewable energy deployment potential by 2030 and Costs/benefits of accelerated renewables deployment. Bottom-up process: Developed in close consultation with country experts. 18

19 IRENA s REmap analysis coverage #REmap 70 country analyses, more than 90% of global final energy demand Dark green: REmap countries Middle green: Countries covered under the REmap regional analyses for the EU and ASEAN Light green: Countries covered under the REmap regional analysis and IRENA power pools projects for Africa 19
20 #REmap REmap explores technology options to accelerate renewables deployment cost-effectively 1. What is the RE outlook by 2030 in government plans? (Reference Case) 2. What are the additional RE deployment options? (REmap Options) 3. What are the costs and benefits of the RE options? (Impact analysis)


21 #REmap IRENA s experience with regional renewable roadmaps 2015 A regional approach to renewable energy can be more efficient by: 2016 Tapping into the best resources available within the region Identifying synergies in e.g. infrastructure development Creating economies of scale for market players Sharing best-practices 2018 A way of maximizing IRENA s impact

22 REmap analysis for the European Union #REmap Background: In 2014, the European Council agreed on 2030 climate and energy targets, including a minimum of 27% renewables Discussions on the Clean Energy for All Europeans legislative package. Aim: Identify options to meet and potentially exceed the proposed 27% renewables target for 2030 Assess the aggregated impact of national renewable energy plans Assess the role of renewables in long-term decarbonisation 22
23 REmap analysis for the EU overall results #REmap The EU can double its renewable share to reach 34% by 2030, cost-effectively All EU Member States have cost-effective potential beyond reference case Additional GHG reduction of 15% by 2030 compared to reference case REmap case results in savings of EUR 21 billion/year in 2030 on LCOE basis Total estimated savings range from EUR 44 billion and EUR 113 billion per year by 2030, when including health and environmental externalities Additional investments of EUR 368 billion until 2030 (estimated average investment in renewable energy of around EUR 62 billion/year) Direct impact on GDP: +0.3% 23

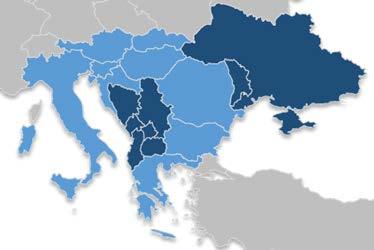
24 #REmap REmap CESEC study: planned geographical scope The boundaries and names shown on this map do not imply any official endorsement or acceptance by IRENA.

25 REmap CESEC: planned outputs (I) #REmap Portfolio of technology options to accelerate renewables by 2030 Across all sectors Country-specific Technology-specific Benefits/costs and economic impact of accelerated renewables Energy system costs compared to reference case Investment needs and direct impact on GDP Sample cost-supply curve from IRENA s REmap analysis for the European Union
26 REmap CESEC: planned outputs (II) #REmap Other impacts Impact on fossil fuel imports / energy security Operation of power sector integration of renewables GHG emission reductions Avoided health damages Opportunities for energy sector integration Across sectors > sector coupling Across countries > power interconnections, biomass trade Policy recommendations to unleash the potential
27 REmap CESEC: key data needs #REmap Existing energy sector plans, targets, projections Sectoral indicators e.g.: Age profile of generation plants, building renovation rates, market share of heat pumps, industrial output, biofuel production capacity, etc. Power sector data e.g.: Historic demand/generation profiles, hydro storage and pumping capacities, interconnection capacities, etc. Energy commodity prices and applicable taxes Other socio-economic indicators
28 #REmap REmap CESEC: timeline and engagement process Tentative timeline: April 2018 October 2019 Multiple opportunities for stakeholder engagement: Initial workshop (present approach and initiate data-gathering) Sectoral webinars (power and end-use sectors) Second workshop (preliminary findings) Final workshop (final results)


29 Thank you Luis Janeiro, Programme Officer Marcin Scigan, Associate Programme Officer