Selecting the Most Cost Effective BMPs for the Removal of Specific Nonpoint Source Pollutants
|
|
|
- Annis Karin Butler
- 5 years ago
- Views:
Transcription


1 Reproduction or reuse of any material without approval of the author is prohibited. Selecting the Most Cost Effective BMPs for the Removal of Specific Nonpoint Source Pollutants NEWEA Annual Conference January 2016 Jeff Herr, P.E., D.WRE
2 Hydrology: Most rainfall events are 1-inch or less Manage common rain events for WQ improvement Rainfall Event Range (inches) Mean Rainfall Depth (inches) Mean Rainfall Duration (hours) Fraction of Annual Rain Events Number of Annual Events in Range (117) >


3 Minimal runoff from pervious areas and N-DCIA Even in HSG D soils DCIA is the driver 3
4 Development Impacts Streams and Estuaries 4
5 Valuable Freshwater Resource Is Lost to Tide 5

6 Up to 60% of our water use does not require potable water 6
7 Which Pollutants? Which Forms? Sediment Biochemical oxygen demand Pathogens Phosphorus: SRP, OP, TP Nitrogen: TKN = Org N + NH3; NOX = NO2 + NO3 TN = TKN + NOX (Only some forms of nutrients are bioavailable) Metals Toxic compounds Organic or inorganic, dissolved or particulate 7
8 BMP Selection Criteria Land area availability/ownership/access Site characteristics Regulatory requirements and constraints Mass pollutant load reduction/environmental benefits Construction/Annual O&M/Life cycle cost Maintenance staff availability/sophistication Decreased maintenance of problem areas Public acceptance Funding partners/grant potential Piggyback on other planned capital improvements Regional vs. many smaller systems 8
9 Evaluation and Selection of Projects Identify primary and secondary pollutants Determine min and max influent pollutant concentrations and stormwater flow rates Determine desired removal efficiencies Identify available land area Identify effective treatment train components Evaluate potential treatment trains based on BMP Selection Criteria Factors Implement best solution keep pushing forward, you will have obstacles! 9
10 L1 Treatment Train - Implementing Cost Effective BMPs For Non-Point Source Management MAXIMIZE MINIMIZE Runoff & Load Generation Conveyance and Pretreatment Additional Treatment & Attenuation Final Treatment and Attenuation Regulations Public education Erosion control Roof runoff Disconnect IA Landscaping Pervious paving Pavement cleaning GI Swales Catch Basins Inlets filters Oil/water separators Trash/sediment traps Detention Wetland Storage Sediment sump Toolbox Retention Detention Wetland Chemical Ozone UV Reuse End of pipe 10
11 Slide 10 L1 I would remove LHawks, 3/4/2013
12 Relative Comparison of Structural BMP Pollutant Removal Effectiveness POLLUTANT INFILTRATION/ VOLUME REDUCTION DETENTION WETLAND 1 CHEMICAL COAGULATION FILTRATION/ UV FILTRATION/ OZONE LIQUID/SOLIDS SEPARATION STUCTURE Nitrogen H - VH L -M L H L -M L -M L -M L Phosphorus H - VH L -M L H H - VH L -M L -M L TSS H - VH H H H - VH H - VH H -VH L M BOD H - VH L -M M M M H M H L M Heavy Metals H - VH L -M M - H M - H L -M L M L M Pathogens H - VH L L H - VH VH VH L Gross Solids H - VH H H L - H VH VH H-VH 1. Highly dependent on influent pollutant concentration and hydraulic loading rate VH Very High H High M Medium L- Low 11


13 End of Pipe Stormwater Treatment Typically for gross solids and sediment removal but new medias effective for removing other pollutants Used extensively for removal of primary pollutants Minimal land required Relatively inexpensive Can be implemented relatively quickly BC Design for CalTrans Baffle Box CDS Unit Vortechnics Stormceptor Many others 12
14 Comparison of BMP Treatment Efficiencies for Primary Pollutants Type of BMP INFILTRATION/REUSE Volume Reduction 1.00 VOLUME 1.50 VOLUME WET DET (14-21 day WSRT) Estimated Removal Efficiencies (% Load Reduction) TN TP TSS BOD WET DET/FILTER DRY DETENTION DRY DET/FILTER (-)-20 (-) CHEMICAL TREATMENT > WETLAND TREATMENT (-)-90 (-) (-)-50 13
15 Volume Reduction No volume = no load Also reduces conveyance requirements and cost. Disconnect Impervious Areas Rainwater Harvesting and Reuse Stormwater Storage and Reuse Low Impact Development and Infiltration Practices (permeability of native soils critical) 14


16 Permeable Pavers and Porous Pavement Subgrade and proper material installation critical to success. Maintenance required. 15
 1-inch of")


17 Rainwater Harvesting and Reuse (relatively clean water) 1-inch of runoff over 3,000 sf = 1,870 gallons. 55 gallon rain barrels provide minimal storage for a typical single family home. HDPE Tanks ~ $1/gallon storage 16


18 Stormwater Reuse Reduces runoff volume and pollutant load and reduces potable water demand. Higher concentrations of pollutants than rainwater but can be used for irrigation and gray water. Must have sediment removal element prior to any underground storage with ability to remove sediment. 17
 Research to improve TP")
.")
19 Bioretention Area (different than biofiltration) Research to improve TP and TN removal. Aluminum precipitates for TP (4-5x). Anaerobic zone for denitrification. 18
20 Biofiltration/Biodetention Lower volume reduction than bioretention but can achieve substantial pollutant concentration reduction. Dense vegetation/engineered soil key. 19


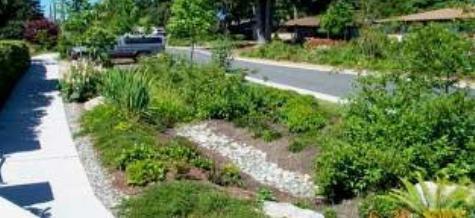
21 Bioswales 20


22 Blue/Green Roof 21


23 Curb Extension 22


24 Sidewalk Planter 23
25 Wet Detention and Wetland Treatment PPV and residence time key factor for wet detention effectiveness (21+ days) Significant land area required for wetlands, efficiencies highly dependent on influent concentrations and hydraulic loading rate, plan for future maintenance. - emergent marsh w/ open water pools - submerged aquatic vegetation (SAV) - hardwood elements - design to minimize short circuiting 24


26 Lake Claiborne Restoration Removed 442,043 lbs/yr TSS/restored PPV Completed in 6 months $1.2M Construction Cost $3.68/lb TSS County average cost per pound is $10/lb TSS Homeowners happy Monitor for WQ and habitat improvements 25

27

28 15 Acre SAV/Wet Detention System treats 600 acres Construction cost $1M Annual O&M cost $20,000 Property owned by FDOT
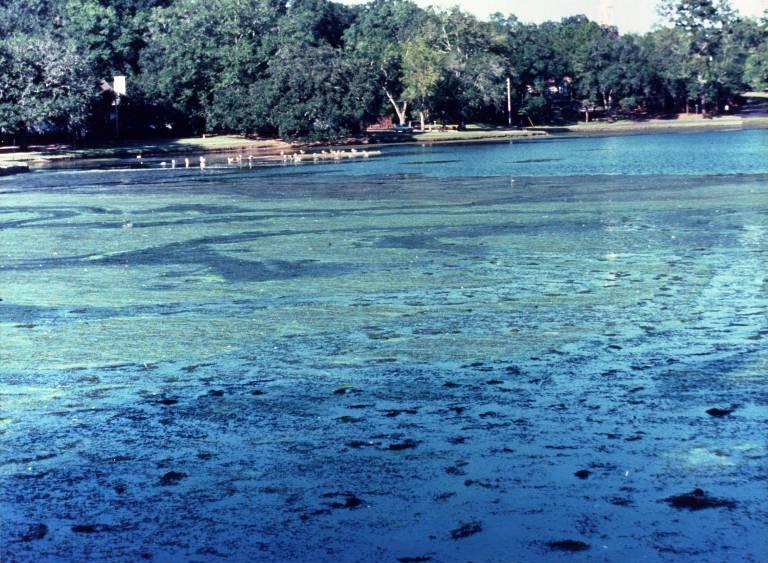
29 Enhanced Treatment Using Coagulants Achieves significantly higher removal efficiencies than traditional treatment methods for many pollutants; 80-90% TP, 99.9% pathogen removal Requires significantly less land than traditional methods Typically has the lowest life cycle cost per mass TP and pathogen removed Improves receiving surface water quality for aesthetics, recreational use or public health Provides source water protection and controls growth of algae and bacteria (including blue-green algae) 28
30 How Does the Process Work? Removal of particulate pollutants Removal of dissolved phosphorus The addition of acid salts consumes alkalinity and reduces water ph, however, a ph buffer is rarely required. 29

31 Before Stormwater Chemical Treatment

32 No land available in watershed for traditional treatment.

33 Stormwater Flow Metering and Chemical Feed Equipment

34 After Stormwater Chemical Treatment


35 Largo Central Park 1200 acre watershed treated using 3 acre pond, floc pumped to SS Construction cost = $1,000,000 Annual O&M cost = $50,000 34


36


37 LCWA Nutrient Reduction Facility Treats flows up to 300 cfs and 50,000 ac-ft of water per year from a 60,000 ac watershed. Meets P TMDL requirements for entire watershed. Construction Cost $7.5M Annual O&M Cost $1M 36


38 Floc Removal and Dewatering 37


39 Capital Trail Cascade Park 38


40 Enhanced Wetland Treatment System to Meet TMDL 6500 acre watershed treated Flows up to 100 cfs diverted Construction cost = $2,000,000 Annual O&M cost = $75,000 Reduces chemical requirements; wetland alone achieves desired TP reduction during lower flows. Dewatered floc used to amend constructed wetland treatment soils to bind P Annual load reductions = 2,000 kg TP, 1,300 kg TN, 18,000 kg TSS 39


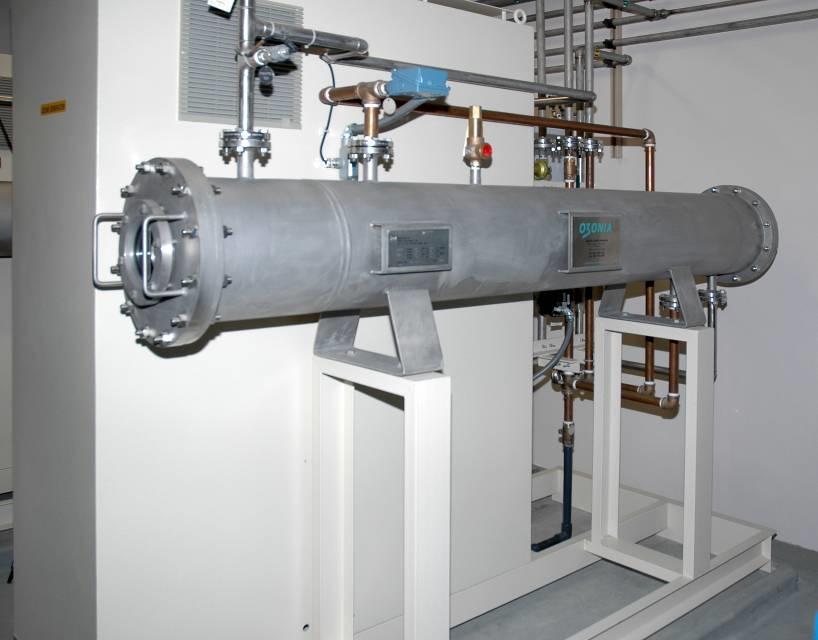
41 Ozone Ozone Disinfection Disinfection 40
42 Influent and Treated Water Monitoring Results Summary of Representative Data (through July - 06) Location Minimum Maximum Mean Influent Total Coliform (MPN/100mL) 1, ,000 33,539 Fecal (E. Coli) (MPN/100mL) ,000 4,266 Enterococcus (MPN/100mL) 15 37,000 5,859 Treated Water Total Coliform Fecal (E. Coli) Enterococcus Treats 1 cfs Baseflow; Construction Cost $3M, Annual O&M Cost $40,000 41

43 UV Disinfection Intake line from creek inside of existing box culvert Wet well with alternating pumps Basket filters Multimedia filters UV light bulbs Discharge from facility reintroduced to creek inside existing box culvert 42
44 3 Year Monitoring Results >99% Bacteria Kill in Treated Water from the Plant Treats 0.33 cfs Baseflow, Construction Cost $400,000; Annual O&M Cost $20,000 Bacteria Removal Efficiencies with UV Treatment 100,000 10,000 16,155 Creek Wat er Pre-t reat ment Creek Wat er Post -t reat ment 1, , Total Coliform (99.97%) 5 Fecal Coliform (99.79%) Bacteria Indicator 3 3 Enterococcus (99.61%) 43


45 City of Boise, Idaho Dixie Drain Enhanced Water Quality Treatment Phosphorus Offset Project } Nutrient removal } Integrated watershed approach Will be first nonpoint source project used to offset total phosphorus requirements in a wastewater NPDES permit Includes coagulant addition facility to precipitate TP from the diverted agricultural flows Brown and Caldwell 44


46 Recreational and Educational Elements Include recreational elements to allow a stormwater treatment system to be useful to the public and a benefit to community 45
47 BMP Life Cycle Cost Comparisons are highly variable Retrofit BMP Life Cycle Cost per kg TP removed ($) Life Cycle Cost per kg TN removed ($) Pet Waste Education Second Generation Baffle Box 400 1, Wet Detention Pond 200-2, ,000 Dry Detention Basin 1,500-7,000 1,250-2,500 LID - Bioretention 1,000-40, ,000 Stream Restoration 1,000-4, Chemical Treatment Enhanced Wetland Treatment Larger - regional systems tend to have significantly lower life cycle costs per mass of TP and TN removed than many smaller systems. LID for new construction is more cost effective. 46

48 Questions Jeff Herr, P.E., D.WRE 47
49 Stormwater Pollutant Sources Of Urban Stormwater POLLUTANT Particulates Nutrients N and P Zinc Copper Cadmium Chromium Nickel Petroleum Pathogens Synthetic organics PRIMARY SOURCES Erosion, sedimentation, pavement wear, atmosphere-fossil fuels, maintenance Fossil fuels, fertilizer application, pets, septic tanks, sewer spills, wastewater reuse Tire wear, motor oil, grease Metal plating, bearing and bushing wear, moving engine parts, brake lining wear, fungicides and insecticides Tire wear, insecticides Metal plating, moving engine parts, brake linings Diesel fuel and gasoline, lubricating oils, metal plating, bushing wear, brake linings, asphalt Spills, leaks or blow-by of motor lubricants, antifreeze and hydraulic fluids, asphalt Birds, animal waste, septic tanks, sewer spills Industrial processes, pesticides, insecticides, spills, asphalt


50 Maximize Implementation of Non-Structural BMPs Nutrient Management Street Sweeping Catch Basin Cleanout Material Storage Typically cost effective pollutant load reduction 49