Nitrogen Pollution and its Impacts
|
|
|
- Dwain Sanders
- 5 years ago
- Views:
Transcription
1 Nitrogen Pollution and its Impacts
2 OUTLINE: Background forms and cycling Sources Cycling, transport dynamics and loadings from watersheds Landuse and N exports Management Options to reduce N Effects and impacts of excess N on ecosystems
3 Notes based on Environmental Protection Agency Nitrogen: Multiple and Regional Impacts. EPA-430-R Follett, R Chapter 2: Transformation and ransport processes of nitrogen in Agricultural Systems. In Nitrogen in the Environment: Sources, Problems, and Management. Passeport et al. 2013; Environmental Management
4 OUTLINE: Background forms and cycling
5 Forms of N: Inorganic: Reduced 1. NH 4+ (ammonium g, aq, s) 2. N 2 (nitrogen g) 3. N 2 O (nitrous oxide g) 4. NO (nitric oxide g) 5. NH 3 (g, aq) Oxidized 1. NO 2- (nitrite aq) 2. NO 2 (nitrogen dioxide - g) 3. NO 3- (nitrate aq) Organic N urea, amines, proteins and nucleic acids Tied to carbon molecules
6 Reactive vs. Non-reactive species Non-reactive Nitrogen gas N 2 atmosphere - largest N store on the planet (78%) Reactive (N r ) Ammonia Ammonium Nitrogen oxides Nitric acid Nitrous oxide Organic compounds N 2 N r Concern Anthropogenic activities increasing N r accumulation in environmental reservoirs and increasing impacts on these reservoirs.
7 Table 1. Estimates of the active pools in the global nitrogen cycle. million tonnes N Air N N 2 O Land Plants Animals 200 of which people 10 Soil organic matter of which microbial biomass Sea Plants 300 Animals 200 In solution or suspension of which NO 3- -N of which NH 4+ -N Dissolved N
8 OUTLINE: Background forms and cycling Sources


9 Sources Natural Sources: lightning N 2 + O 2 2NO biological nitrogen fixation N2 NH3 amino acids proteins Symbiotic bacteria in rhizobium/roots of plants Types of plants that host these bacteria? Other types of bacteria?
10 Prior to anthropogenic influences - there was a balance between BNF and denitrification which kept Nr low Anthropogenic sources Burning of fossil fuels Widespread cultivation of N fixing crops Use of fertilizers in agriculture synthetic and animal manures Urban, suburban, rural sources wastewater, lawn fertilizers, septic tanks, CSOs. Human activity has had a profound effect on the N cycle.
11 1. Energy production - under high temperature combustion processes, unreactive nitrogen is converted to reactive nitrogen by two processes. a. Thermal NO x 1000 o K N 2 + O 2 2NO b. Fuel NO x - the oxidation of organic N in fuels 2. Fertilizer-Most anthropogenic fertilizers are either NH 3 or urea produced from NH 3. This material is produced by the Haber-Bosch process. 4N H 2 = 8NH 3 Types of N fertilizers Ammonium nitrate, Ammonium sulfate, Calcium nitrate, Sodium nitrate, Urea [CO(NH 2 ) 2 ], Urea-ammonium nitrate


12 Fritz Haber Carl Bosch Historical high pressure steel reactor
13 Global Population and Reactive Nitrogen Trends Human Population (billions) 4 2 Natural N Fixation Tg N yr Populati on Haber Bosch C-BNF Fossil Fuel Total Nr From Galloway et al In review.
 7. Wastewater effluent 8.")
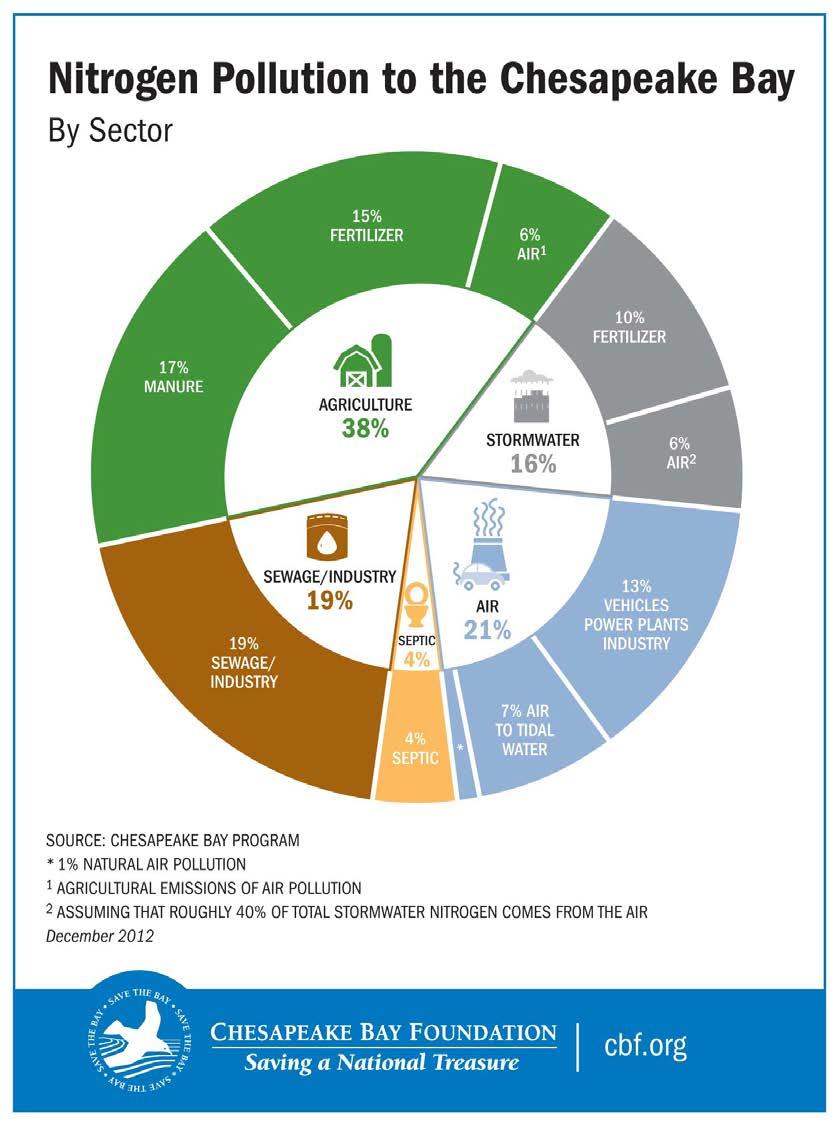
14 Major Sources 1.Power plant emissions 2.Vehicle emissions 3. Septic tank leakage 4. Manure/livestock runoff 5. Agricultural emissions 6.Fertilizer runoff (e.g. lawns and fields) 7. Wastewater effluent 8. Food and feed imports
15
16 What happens to inputs of Nr? Denitrification (loss as N 2 gas) Biomass storage (crops, forests, animals) Soil storage Groundwater storage Exported to streams/estuaries Exported in food and feed
17 OUTLINE: Background forms and cycling Sources Cycling, transport dynamics and loadings from watersheds

18 Cycling, Transport Dynamics and N loadings from watersheds Nitrate high mobility Ammonium low mobility, fixation with clay particles in subsoils Organic N moderate mobility Particulate versus dissolved species (?)
19 Key N Cycle Processes: Mineralization & Immobilization: Mineralization: Conversion of organic N into inorganic N forms (NH 4+, NO 3- ) via processes like decomposition -- organic N forms decompose and form ammonium first. 1.5 to 3.5 % of the organic N may mineralize annually Immobilization: Conversion of inorganic N forms to organic N forms (via processes like plant & biological uptake) o NH4+ preferably immobilized compared to NO3- The carbon and nitrogen pool ratios in soils and implications for mineralization and immobilization
 is more mobile that ammonium.")
20 Fixation/Sorption by Clay Minerals Positively charged ammonium ions are adsorbed on the negatively charged clay & humus sites remember the CEC! Because of the adsorption of ammonium to clay particles ammonium is the less mobile form of N --- nitrate (negatively charged) is more mobile that ammonium. Thus soils with higher clay content will retain or tie-up more ammonium (compared to sandy soils)
21 Ammonia Volatilization Conversion of ammonium from the soil to ammonia gas NH 3 Typical sites for occurrence locations where animal manures are spread on land. Moist and high ph conditions increase the rate of volatilization.
22 Conversion of Ammonium Nitrate ******Nitrification Performed by bacteria classed as autotrophs because they obtain their energy from the oxidation of ammonium ions. Ammonium Nitrite Nitrate Occurs in dry soils
23 Denitrification Process of conversion of nitrate NO 3 - to nitrogen gas N 2 Typically occurs in saturated soils like wetlands, riparian soils, flooded rice fields,. Bacteria involved are heterotrophs extract their energy from carbon (as opposed to autotrophs) Conditions for Denitrification: o Nitrate availability o Energy source Carbon o Anaerobic conditions soil air less than 10% O2 or less that 0.2 mg/l
24 Hydrologic delivery processes: 1. Precipitation 2. Surface runoff 3. Sediment and soil associated 4. Vertical drainage, leaching 5. Groundwater flow Surface & sediment drainage Groundwater flow
25 Primary pathways of transport for various N forms Either in dissolved or particulate forms Dissolved < 0.45 or 0.7 micron Particulate > 0.45 or 0.7 micron Surface runoff DON, diss-nh 4+, NO 3 - Vertical drainage - DON, diss-nh 4+, NO 3 - Near subsurface flow - DON, diss-nh 4+, NO 3 - Groundwater flow - DON, diss-nh 4+, NO 3 - Sediment - PON, particulate-nh 4 + DON dissolved organic N PON particulate organic N
26 OUTLINE: Background forms and cycling Sources Cycling, transport dynamics and loadings from watersheds Landuse and N exports
27 N exports with landuse
28
29 Forested watersheds: Primary inputs atmospheric deposition (nitrate, ammonium) Atmospheric deposition for Newark region ~ 3-4 kgn/ha/yr Primary N species exported nitrate and DON; PN could be high during large storms or watersheds with significant erosion and sediment export Inorganic N species constitute 50 to 80% In some undisturbed tropical forested watersheds DON is the predominant form of N (could be as high as 60-80%) Nitrate-N concentrations less than 1.0 mg/l Exports occur with surface as well as with groundwater flow o DON surface waters o Nitrate groundwaters
30


31 Agricultural watersheds: Primary inputs fertilizers, manure, atmospheric deposition Poultry manure N:P = 3:1 << that required for plant uptake ~ 8:1. Manure application rate for corn ~ 214 kgn/ha/yr N species nitrate, ammonium, organic N Nitrate concentrations in runoff and groundwater may be as high as 10 mg/l Particulate concentrations could be high if soil erosion occurs


32 Chicken manure on Delaware farm to be applied in spring
33 12.0 QN Annual N load (kg/ha) particulate dissolved-organic nitrate ammonium pre-bmp 5 post-bmp 2 N exports from an Agricultural Watershed in Coastal Plain of Virginia
 Runoff and N short-circuited, bypasses natural sinks in the")
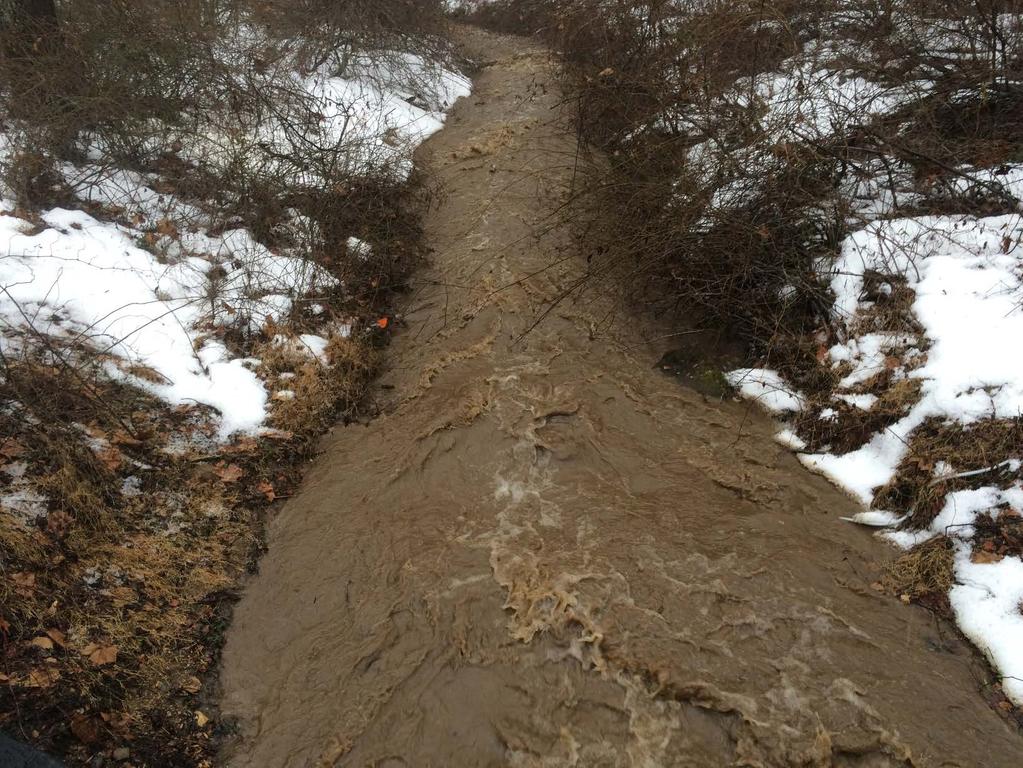
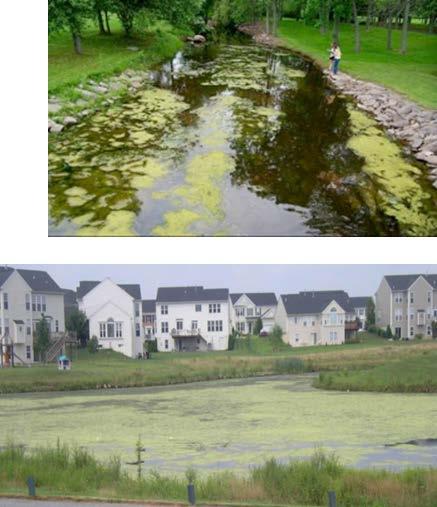
34 Urban watersheds: Primary sources wastewater, leaking septic tanks, leaking sewer lines, CSOs, lawn fertilizers, golf courses, atmospheric deposition Golf course N application rate = 173 kgn/ha/yr! Key N species nitrate, ammonium N N concentrations may vary considerably with season and hydrologic conditions (baseflow versus stormflow) Runoff and N short-circuited, bypasses natural sinks in the landscape Increasing concerns in regions like the Chesapeake Bay watershed.
35
36 OUTLINE: Background forms and cycling Sources Cycling, transport dynamics and loadings from watersheds Landuse and N exports Management Options to reduce N
37 Management strategies for N Source Control Emissions Control o Reduce emissions from power utilities o transportation Fertilizer applications o Reduce applications rates o Timing and location of fertilizer application o Retardants (e.g., nitrification inhibitors)
38 Management strategies for N Source Control Manure management & application o Storage o Timing of applications winter manure ban in some states o Location and amount of application Suburban & rural areas o Septic tanks o Homeowner lawn fertilizers timing and amounts o Golf courses

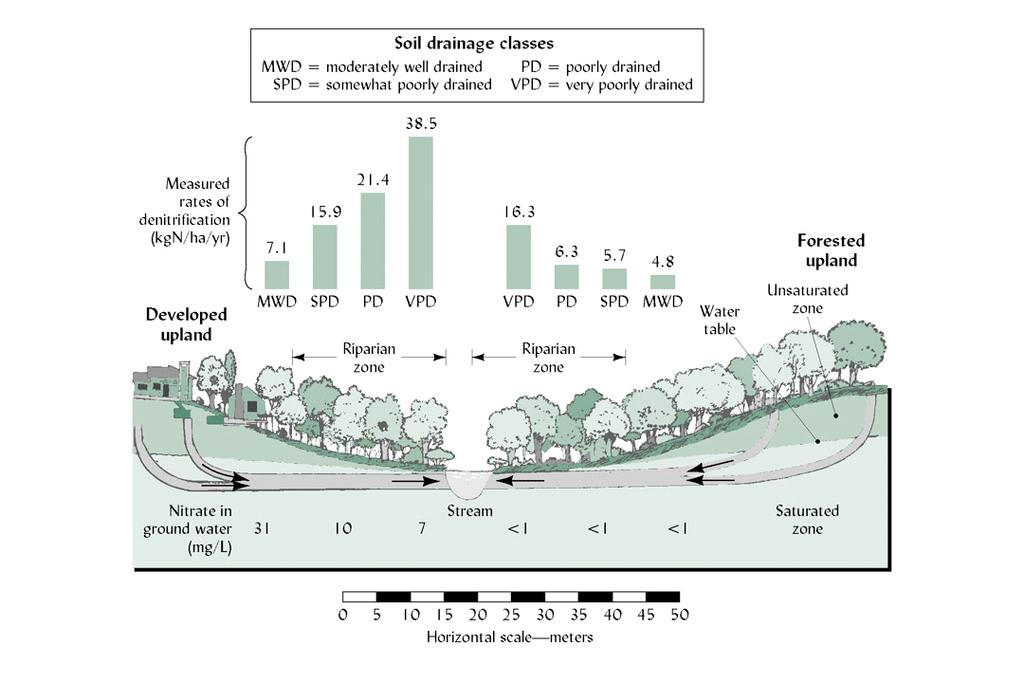
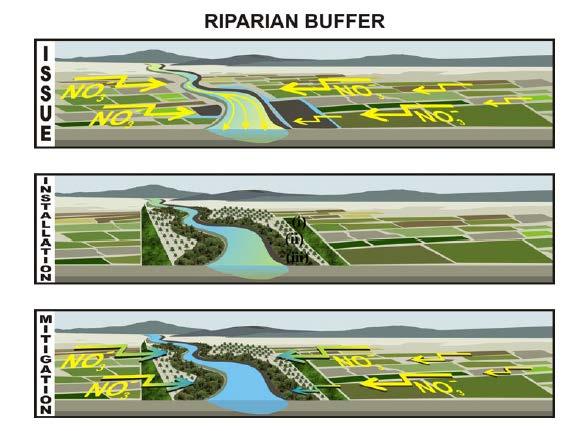
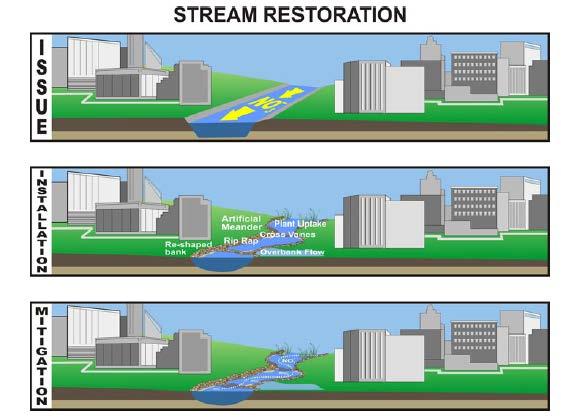
39 Transport & delivery controls Intercept and reduce nutrients during transport Riparian zones, wetlands, buffer strips Ripar beside the stream o Denitrification of N o Vegetative uptake of N o Deposition of sediment & sediment-n o Conversion of inorganic N to N 2 & organic N Riparian forest on a Midwestern farm
40

41 Effectiveness of riparian zones as N sinks is site specific Flow paths o Deep versus shallow Carbon availability/vegetation o Why? Vegetation growth status

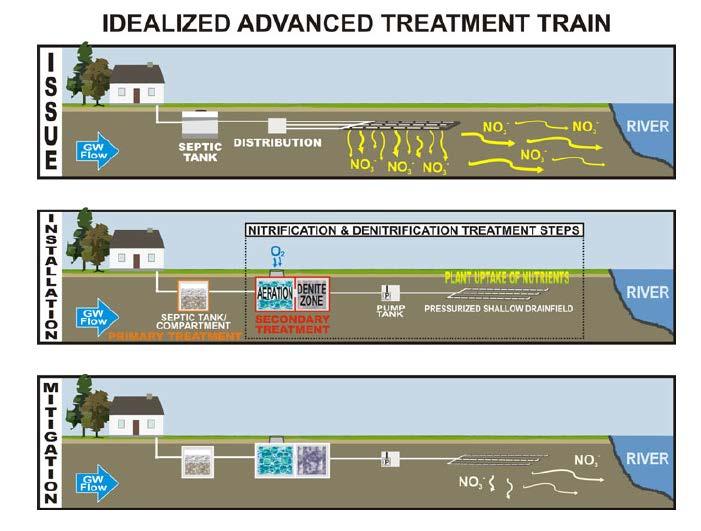
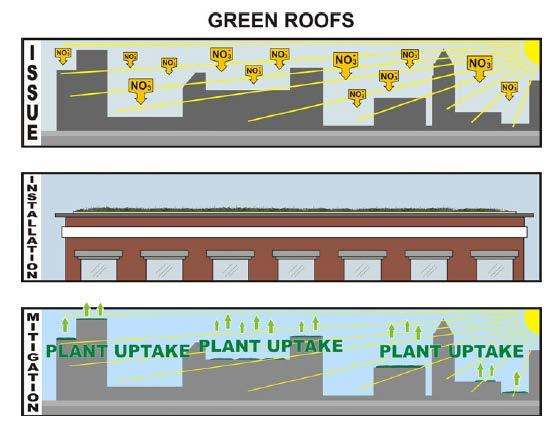
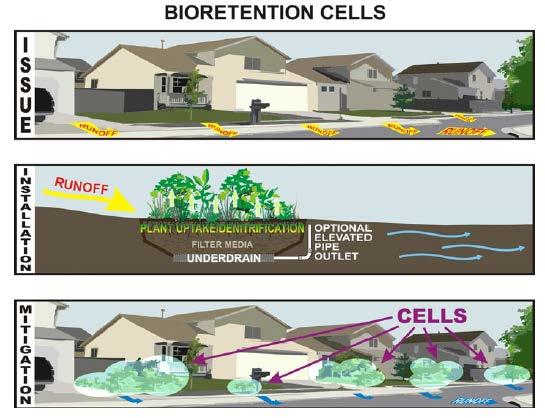
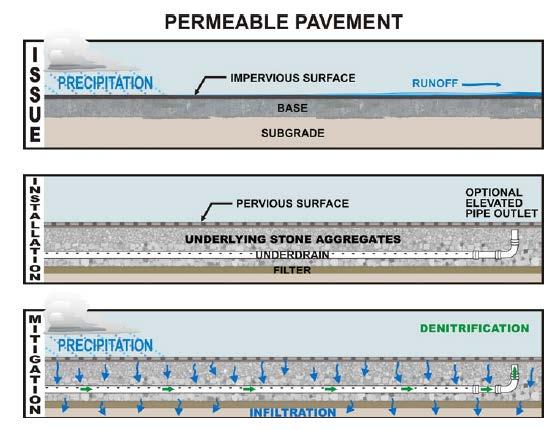
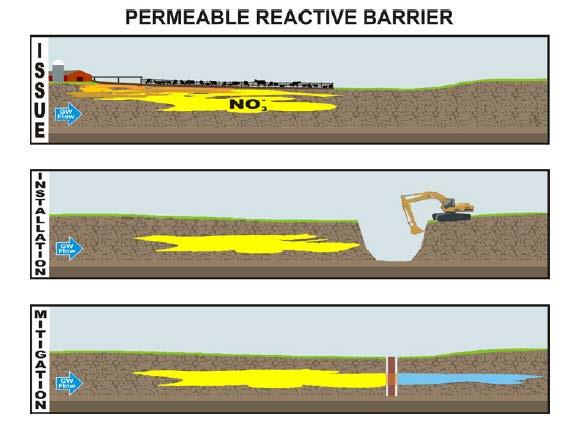
42 Other types of management practices for N control (notes and graphics from Passeport et al., 2013, Environmental Management)
43
44
45
46
47
48
49
50

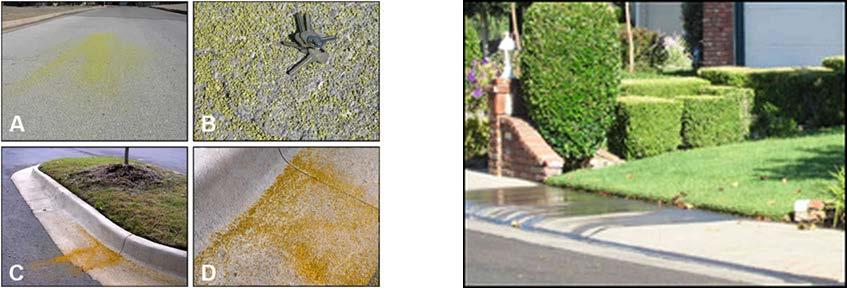
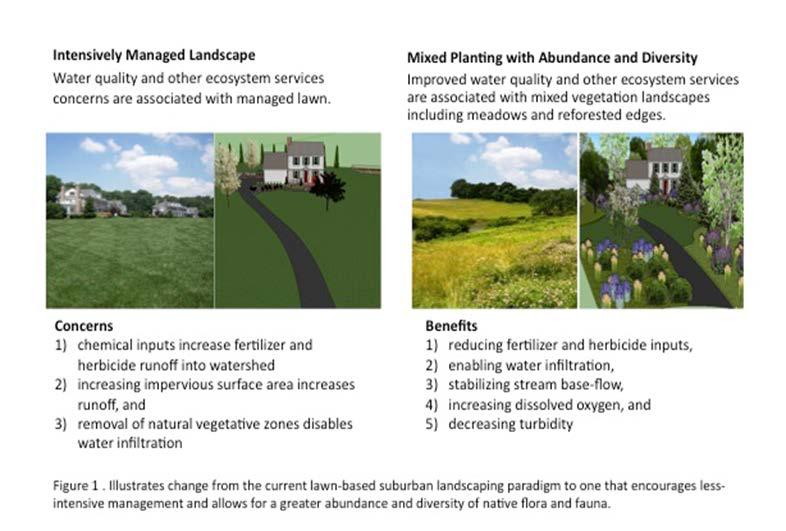
51 Urban landscape management practices Reduce management intensity Increase biodiversity Enhance native species
52
53 OUTLINE: Background forms and cycling Sources Cycling, transport dynamics and loadings from watersheds Landuse and N exports Management Options to reduce N Effects and impacts of excess N on ecosystems
 o 80 ppb for 8hrs can cause problems Acid deposition (deterioration of exposed structures) Nitrate")
54 Effects of Excess N: Human health and non-ecosystem effects: Particulate matter (PM) especially < 2.5 μm Ozone formation (NO x triggers ozone) o 80 ppb for 8hrs can cause problems Acid deposition (deterioration of exposed structures) Nitrate concentrations in waters (blue baby syndrome)
55


56 N-poor terrestrial landscapes and impacts of N enrichment e.g., Ombrotrophic Bogs and carnivorous plants
57 Eutrophication Coastal & inland Eutrophication excess growth of algae (N, P) N especially a concern for coastal water bodies N limited. N deposition plays a greater role
58 Symptoms and Consequences of Nutrient Enrichment Nutrient Inputs Primary Secondary Consequences Effects Effects of Symptoms Increased Nitrogen Load Increased Primary Production Loss of Habitat Low D.O. Algal Blooms Fish kills Human health risks Loss of Tourism Closed fishing areas

59 Dead Zones Anoxic or Hypoxic waters an increasing problem! Hypoxic when dissolved O 2 < 2 to 3 mg/l Anoxic when devoid of O 2 Dead zones occur in: Gulf of Mexico Chesapeake Bay Florida Bay Long Island Sound Adriatic sea Baltic sea

60 Gulf of Mexico Hypoxic zone 20,000 sq km! attributed to N loadings from the Mississippi River watershed.