Peak Everything Running Out of Commodities in a Crowded World
|
|
|
- Nicholas Watts
- 5 years ago
- Views:
Transcription


1 Pollution Ocean Stocks Food Decline Peak Everything Running Out of Commodities in a Crowded World Desertification Gary McMurtry Climate Change Social Unrest Peak Oil Extinctions
2 History of Earth s Human Population From: Nate Hagens; Graph Credit: Dr. William Stanton

3 Peak Oil, Carrying Capacity & Overshoot: From: (Paul Chefurka)
4 Peak Oil, Carrying Capacity & Overshoot: From: (Paul Chefurka)

5 Peak Oil, Carrying Capacity & Overshoot: You Are Here From: (Paul Chefurka)
6 Type of Energy Use for Past 200 Years Graph Credit: Cutler Cleveland Boston University From: Nate Hagens;


7 Amazing Energy Density (45 MJ/kg, compared with MJ/kg for coal, 16 MJ/kg for dry wood) Easily Transportable Safe (relatively) & Cheaply Storable Major Uses: Properties & Uses of Oil Transportation Fuel for motor vehicles, trains, ships & airplanes Fuel for Power Plants Industrial Applications, e.g. mining, farming, manufacturing Source of Petrochemicals, including chemical fertilizers (N,P,K)*, pesticides*, herbicides*, plastics & pharmaceuticals *Basis of the green revolution, as a means to fix or reduce atmospheric nitrogen. In this usage, I include natural gas, another limited fossil fuel, and mineable phosphate, probably next on the global depletion list. K is abundant.
 occurred in 1970; In 1956, M.")
8 USA Oil Production History & Projection The US lower-48 production peak (Texas + Rest of USA) occurred in 1970; In 1956, M. King Hubbert predicted this outcome to within a few years.


9 Where the USA Currently Gets Its Imported Oil (>60%) Cantarell Giant Oil Field, Mexico


10 Export Land Model Jeffery Brown and Sam Foucher -


 Hubbert s Global")
11 Hubbert s Predictions Exxon Mobile data M. King Hubbert From: K. S. Deffeyes, Hubbert s Peak (2001) Hubbert s Global Production Predictions, 1970

12 Predictive Global Models from WebHubbleTelescope, TheOilDrum.com Production Rug Pushing 40 years Extended Plateau Cliff! Source: and links therein.

13 World Liquids Production, From: EIA data;

14 Crude Oil Production by Country

15 Bottom-Up (Mega-Projects) Prediction Possible future supply capacity scenario for crude oil and NGL based on the Wikipedia Oil Megaproject database. The resource base post-2002 decline rate is a linearly increasing rate from 0% to 4.5% between 2003 and 2008 then constant at 4.5% afterward. The decline rate for each annual addition is 4.5% after first year. The observed data points are the monthly crude oil + NGL estimates from the EIA. From: Khebab, Ace, et al., node/4419#more

16 Net Oil Exports & Crude Prices Exports Oil Price

17 Oil Prices Over Time
18

19
20 Why Oil s the Uber-Commodity Oil is a key commodity because almost everything in our industrial economy depends on the continued flow of cheap oil for either the manufacture, processing, storage, or delivery of whatever it is. With ordinary commodities, a shortage of tulips or flour or pork bellies isn't likely to affect the typical commuter's ability to get to work, heat the home, etc, unless perhaps that person works directly in one of the affected industries. It takes only as little as a 5% decline in availability of this key commodity to affect a 50%+ change in pricing. -- Bette Williams, Nudge of CFN History of Whale Oil Price Demand Wedge or Price Production

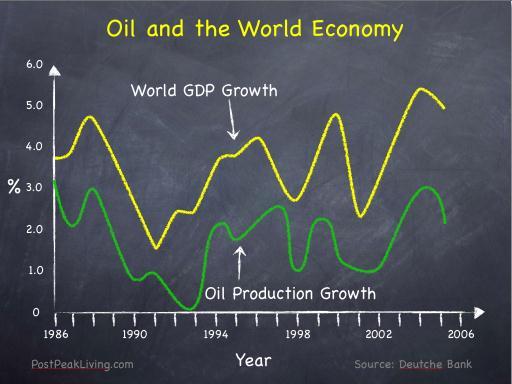
21 Oil Price vs. Recent Economic Events Source: Euan Mearns on TheOilDrum.com

22 Net Oil Imports to OECD* *Organization for Economic Co-operation & Development Source: Ron Patterson, Darwinian on TheOilDrum.com
 Source: Jeff Brown, Westexas on")
23 Export Land Model & Chindia Economic Effects GNE = Global Net Exports ANE = Available Net Exports (to rest of world) Source: Jeff Brown, Westexas on TheOilDrum.com

24


25 Campbell s Predictions World Oil Production World Population Colin J. Campbell, Founder, ASSOCIATION FOR THE STUDY OF PEAK OIL AND GAS

 Population")
26 It s about the Food Made available to plants by fossil fuel (natural gas reductant) Population Disaster!


27 Growing Global Demand Chronic Low Productivity of Farmers in Poorest Countries Is there any cause for alarm? Misguided Diversion of Food Crops into Biofuel Production Climate Change => Droughts Jeffrey D. Sachs, Act Now, Eat Later, Time (May, 2008)

28 Peak Oil, Carrying Capacity & Overshoot: From: (Paul Chefurka)

29 Nature Takes Care of Her Own From: Ugo Bardi, Peak Caviar, Overfishing Caspian Sea Sturgeon 4367#more Rapid Depletion of a Critical Resource?

. Oil = very slow growing, initially ample but essentially finite food resource for humans (via industrialization).")
30 Nature Takes Care of Her Own St. Mathews Is. Deer: Ran out of Lichens. Let me see if I get this deer/human analogy correct: Lichens = very slow growing, initially ample but essentially finite food resource for reindeer. Reindeer introduction to island, lichens (human caused event, circa 1940). No significant predators or other population growth controls. Result: rapid population growth, followed by overshoot, die off (starvation, disease). Oil = very slow growing, initially ample but essentially finite food resource for humans (via industrialization). Human oil discovery & exploitation (human caused event, circa 1850s). No significant predators or other population growth controls. Result: rapid population growth, followed by overshoot, die off (starvation, disease). First Introduced St. Mathews Island (bounded by sea) = Earth (bounded by space) Lichens = Oil Introduction = Discovery Reindeer = Humans

31 Global Oil Production & Prediction

32 Global Oil & Natural Gas Depletion From: C. J. Campbell, The End of the First Half of the Age of Oil (2005)

33 Global Peak Coal From:
")
34 USA Coal - Net Energy (BTU) Peak
 plants; David Goodstein, Out of Gas, The End of the Age of Oil,")
35 Magnitude of the Problem or Why Most Alternatives Won t Work, or Not in Time To make up for the coming oil depletion, a 1 Gigawatt nuclear power plant needs to be built every day for the next 30 years* * To replace 10 Terawatts or watts = 10,000 new 1 Gigawatt (10 9 watt) plants; David Goodstein, Out of Gas, The End of the Age of Oil, 2004.


36 USA Current Energy Breakout 85% 13% 1.24%

37

38 The List of Alternatives Category Brief Comment Heavy Oil Most helpful in near future Oil Sands Moderate supply Coal-Derived Liquids Moderate supply Liquefied Natural Gas Minor supply Natural Gas Coal Methane hydrates Solar-voltaic Hydro-electric Wind Tidal, Waves, Currents OTEC Biomass Geothermal Nuclear Fission, Nuclear Fusion N.A. post-peak; world will soon follow Maybe more years--see CDL Abundant on and off-shore--impacts unknown Moderate supply Moderate supply--local impact Moderate supply--local impact Minor supply--local impact Scaleable to 5 TW, but impacts unknown Land forms are net energy losers; marine? Minor supply--local impact Most helpful in far future--probably our only long-term hope


39 Offshore Wind Algae Biodiesel Tidal Power Solar PV Array Can They Scale to Need? Fossil Fuel Platform?

40 Fossil Fuel Platform Like windmills on the sea, alternative energy technology rests upon a vast pool of fossil-fuel energy that will decrease and become more expensive over time. Industries that make alloys, turbines, solar panels, batteries, & construction equipment and transportation all rely on fossil fuels. Even coal is mined with diesel-powered equipment.

41 What s Wrong with This Picture? HINT: Study this chart as if your life depended upon it!

42 Different Infrastructure Requires Different Power Densities From: Nate Hagens;


43 Crude Oil Alternatives--Canadian Oil Sands * currently 1 million barrels (MB)/day * projected to 3 MB/day in 2020 * projected to 6 MB/day in future --tops * reserves equal to oil of Saudi Arabia * environmental impacts huge & scaleable Source: K. Bourzac, Dirty Oil, MIT Tech. Review, Dec. 2005


44 ERoEI: Energy Returned on Energy Invested General resource example Oil well, field example Or, If it takes a barrel of oil to recover a barrel of oil, why bother?

45 ERoEI summary chart: USA Source: Charles Hall;


 From: Ken Deffeyes, Current")

46 ERoEI Futures Per Prof. Deffeyes, $300 per barrel oil = 15% GDP. ERoEI = 5-6 at point of collapse (below). World Oil Production vs. Price, with % World GDP (Gross Domestic Product) From: Ken Deffeyes, Current Events, May, 2008, From: Euan Mearns, theoildrum.com

47 Working Near the Net Energy Cliff (Energy Out/Energy In) = ERoEI From: Chris Martenson;

48 Another Way of Calculating ERoEI: Marginal Costs