The Atlanta Commercial Buildings Efficiency Ordinance: Establishing Atlanta as a National Leader in Energy Performance
|
|
|
- Adam Terry
- 5 years ago
- Views:
Transcription


1 The Atlanta Commercial Buildings Efficiency Ordinance: Establishing Atlanta as a National Leader in Energy Performance Presented by Megan O Neil City of Atlanta Mayor s Office of Resilience April 25, 2018

2 Overview City Energy Project CEP is a national initiative aimed at improving the energy efficiency of commercial buildings. Priorities Innovative economic solutions cut energy bills boost the local economy reduce pollution Move Atlanta toward becoming a top-tier city for sustainability.


3 ATLANTA S ENERGY AND EMISSIONS FOOTPRINT City of Atlanta Energy Consumption Transportation and Others 34% City of Atlanta CO2e Emissions Transportation and Others 42% Buildings 58% Buildings 66% 3


4 Overview Energy/Water Efficiency Leading by Example RM Clayton WTC American Society of Civil Engineers Cogeneration Project of the Year Atlanta Civic Center Historic Fourth Ward Park Urban Land Institute Award 2013 Historic 4th Ward Park U.S. Department of Energy 1st Better Buildings Challenge Showcase 4th Nationally - ENERGY STAR Certified Buildings georgiatransitconnector.org


5 U.S. Benchmarking Policy Landscape
6 Context - Commercial Building Figures Covered Buildings Covered Square Footage 18% 20% 82% 80% Exempt Action Required Exempt Action Required 6

 Cumulative Social Costs (Millions) Benefit/Cost Analysis Value of Lower Energy Avoided Expenditures Emissions Net Reduced Utility Total Social")
7 ORDINANCE COSTS AND BENEFITS Energy Savings Millions 1,800 1,600 1,400 1,200 1, $250 $200 $150 $100 $50 Millions $ kwh Millions $30 $25 $20 $15 $10 $5 $- Public Health Benefits 0 $ Combined Value of Emissions Savings Year Cumulative Social Benefits (Millions) Cumulative Social Costs (Millions) Benefit/Cost Analysis Value of Lower Energy Avoided Expenditures Emissions Net Reduced Utility Total Social Expenditures Benefits Investments Total Social Costs Social B/C Ratio Net Social Benefits , ,
8 Part I: Benchmarking 1 What is benchmarking? Tracking energy and water consumption on site for properties over 25,000 ft 2 2 How do you benchmark? Utilize ENERGY STAR Portfolio Manager (ESPM) *Free web-based platform 8
9 Part II: Transparency 1 What is transparency? Reporting energy and water consumption characteristics of a property. 2 How does it work? Properties will send a benchmarking submission using a twostep process in ESPM. The City of Atlanta will check the data and make it publicly available. 9
10 Part III: Energy Audits 1 What is an energy audit? A professional walk-through of a facility to check for opportunities to improve energy performance, focusing on equipment retrofits. 2 How does it work? Property owners use a certified professional to perform the work and produce an itemized list of opportunities. Owners then choose which opportunities to pursue. 10
11 ORDINANCE TIMELINE AND REQUIREMENTS What Needs to be Done? Who/What Bldg owner inputs consumption Benchmarking Transparency Energy Assessment Retrocommissioning Bldg owner submits 12 months of data to municipality If the ABID* ends in the same digit as the year, contract professional services Frequency Annually Annually 1/10-years Optional Contract professional services if desired When? 2015: City of Atlanta municipal buildings >10,000 ft2 benchmarking only Commercial (non multifamily) buildings >50,000 ft2 benchmarking only 2016: Continued annual benchmarking of buildings above 1 st year of audit requirement 2017: Commercial (non multifamily) buildings >25,000 ft2 benchmarking + audit 2019 Multifamily buildings >25,000 ft2 benchmarking + audit 11


12 VOLUNTARY SUPPORT PROGRAM 12
13 Questions? General: Go to or Questions? Contact the Mayor s Office of Resilience buildingefficiency@atlantaga.gov *Average response time: within 24 hours (business days) 13

14 Commercial Buildings Energy Efficiency Ordinance (CBEEO) Basics of Benchmarking and Energy Audits for the City of Atlanta Meghan McNulty, PE Project Engineer at Servidyne


15 History of Energy Mandates King Edward I, Circa 1300 Ban on Coal Burning in London Penalty: Torture or Death

16 Benchmarking


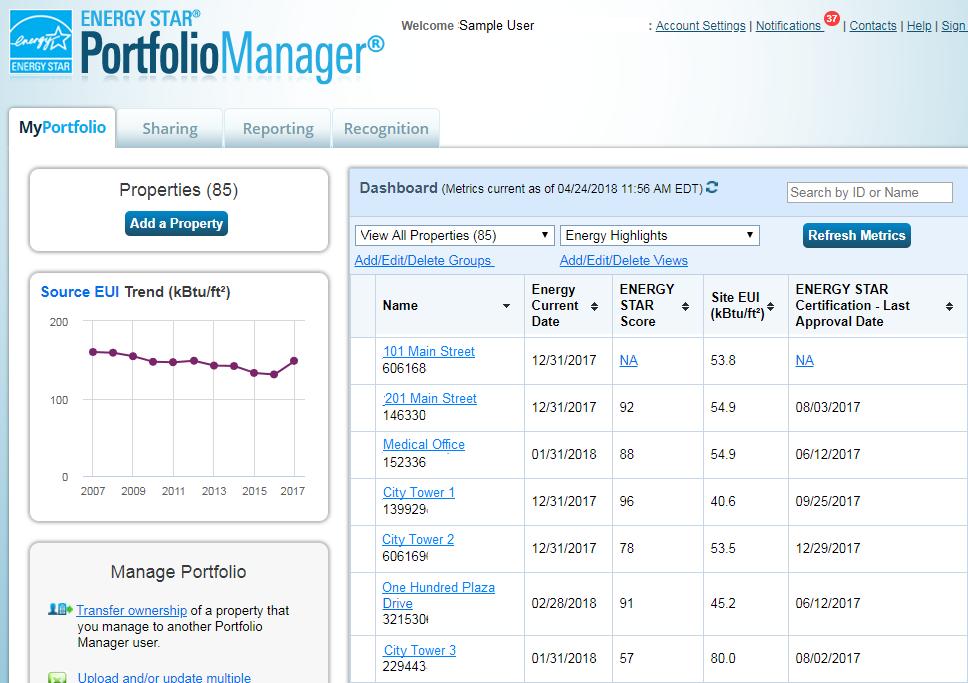
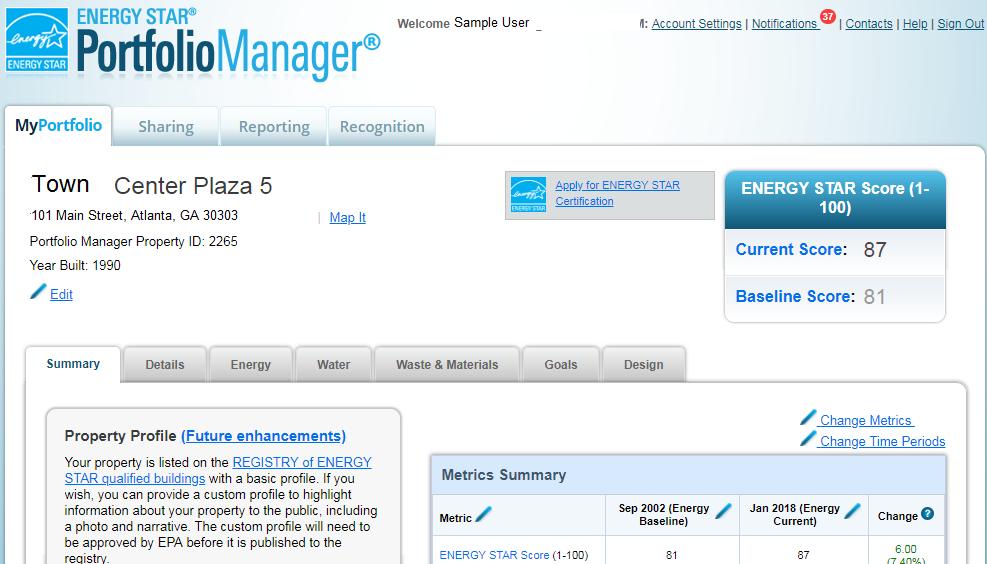
17 What is ENERGY STAR Portfolio Manager? Assess energy, water and waste/materials consumption Track changes over time ENERGY STAR score (available for many building types) Apply for ENERGY STAR certification


18 EPA s ENERGY STAR scores are based on market data Nationally representative survey - CBECS gathers data on building characteristics and energy use from thousands of buildings across the U.S. EPA analyzes & filters the data - ensuring data robustness and quality EPA creates a statistical model that correlates the energy data of the property use details to identify the key drivers of energy use, accounting for weather variations Compares the actual energy data for a building to the modeled estimate to determine where the building ranks relative to its peers on a scale


19 Property Types with 1 to 100 ENERGY STAR Scores Score based on CBECS data Bank Branch Medical Offices* Barracks* Hotels Financial Offices Residence Hall/Dormitory* K-12 Schools Office Buildings Supermarkets Courthouses Wholesale club/ Supercenters Worship Facilities Score based on other survey data Retail Stores Data Centers Distribution Centers Hospitals Warehouses Senior Care Communities Wastewater Treatment Plants* *These building types are not eligible for ENERGY STAR certification. Multifamily Housing
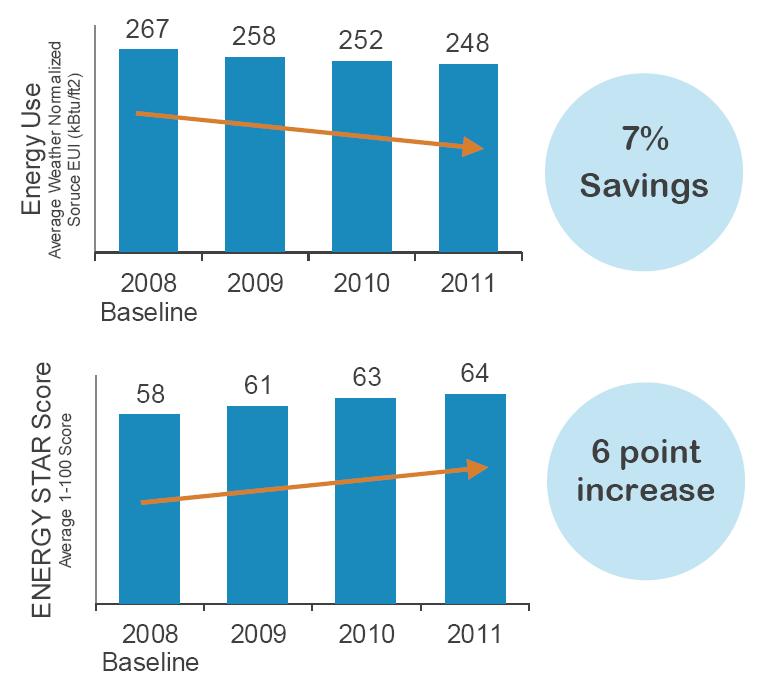
20 Value of benchmarking
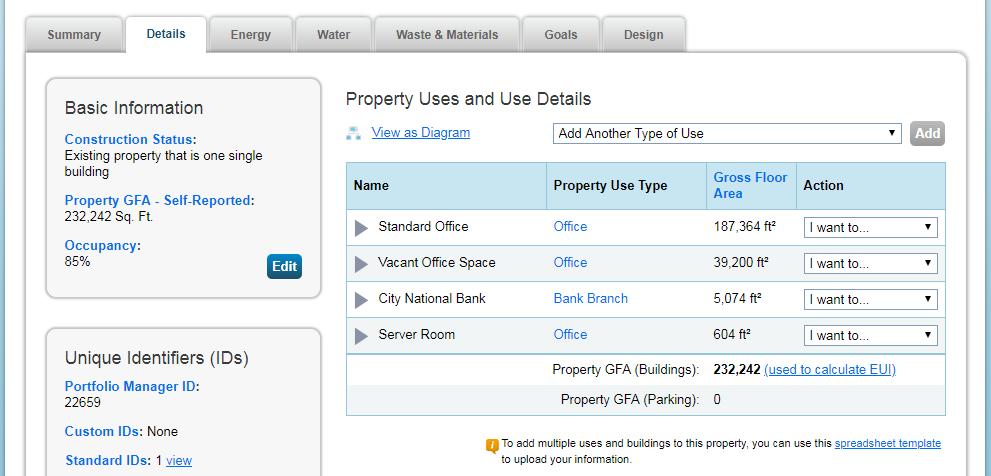
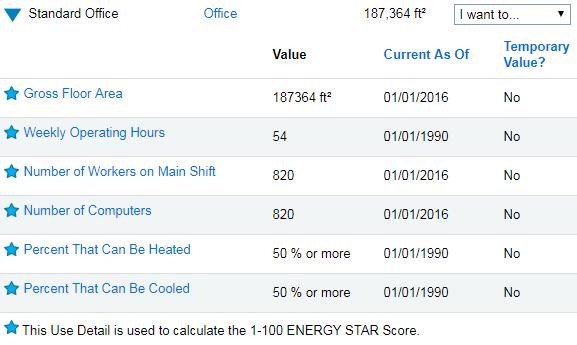
21 Property information Building type Name, street address, ZIP/postal code Information Needed to benchmark Property type data Gross floor area Use details (e.g., workers, operating hours) Utility bills All purchased and on-site generated energy and water
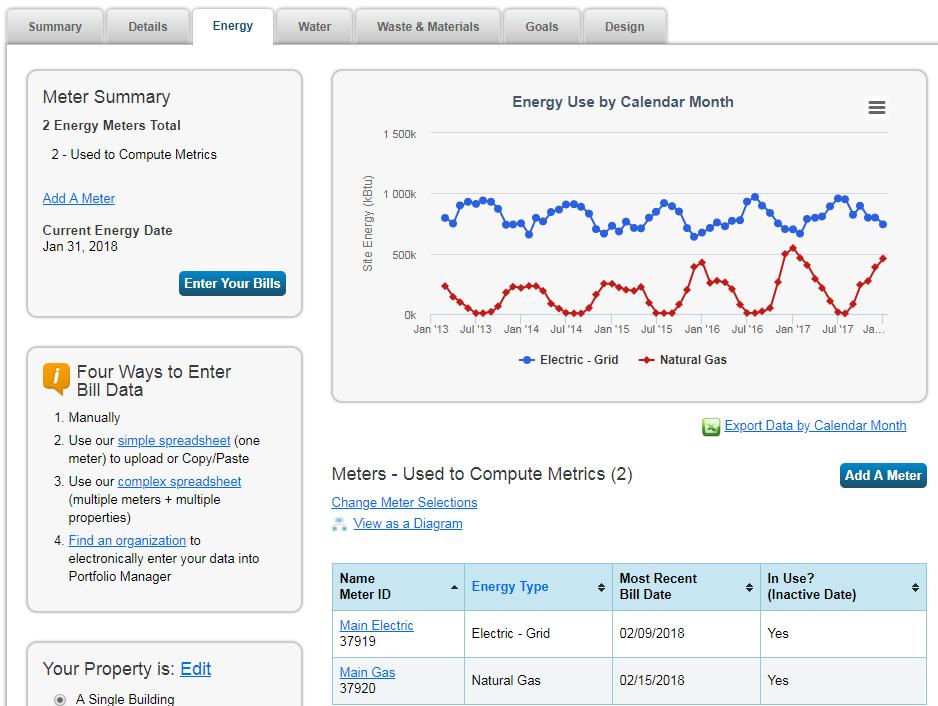
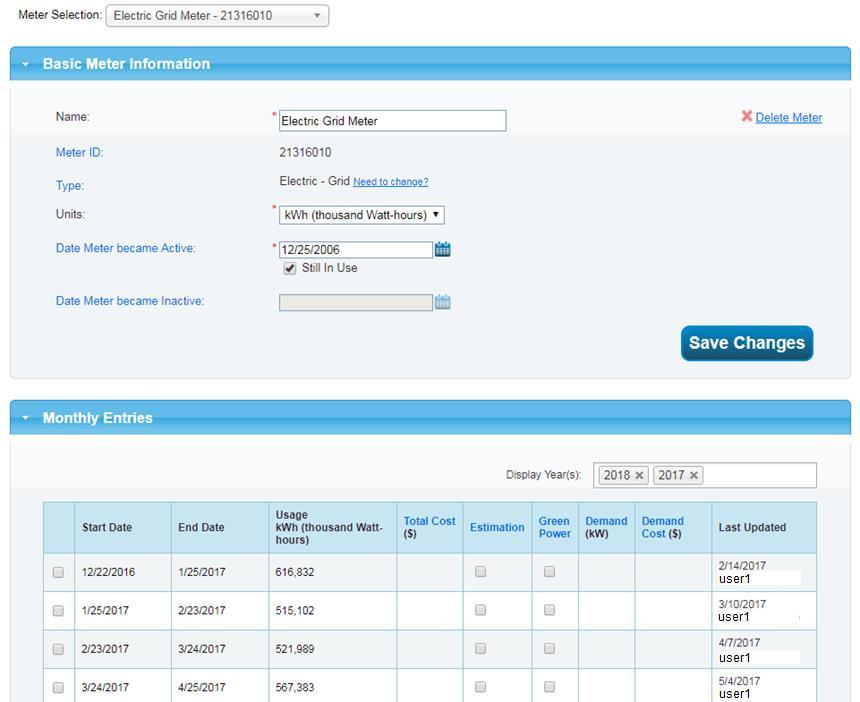
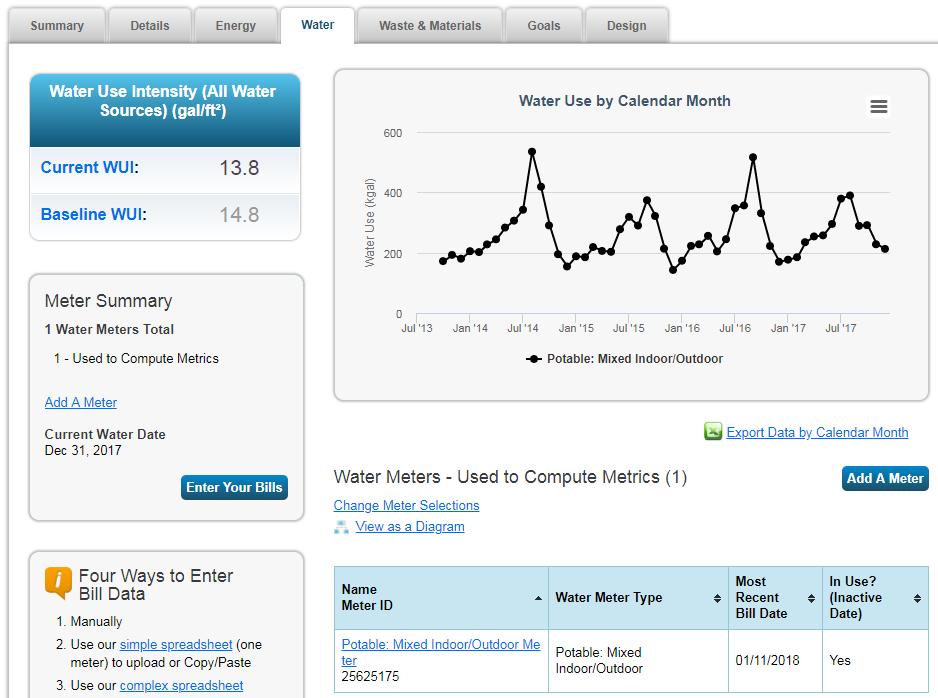
22 Manual Data Entry Type in each number for each monthly entry Four Ways to Get Data in to Portfolio Manager Single Meter Spreadsheet Use a spreadsheet to update one meter a time Multi-meter Spreadsheets Use a spreadsheet to update multiple meters from multiple properties Web Services Companies electronically enter utility data into Portfolio Manager through a process of data exchange called web services
23 10
24 11
25 12
26 13
27 14
28 15
29 16

30 How to submit your benchmarking data to the city 17

31 DIY Quality Assurance Angry exclamation points Data Checker Tool
32 Wrong gross floor area Wrong operating hours Top Benchmarking Errors Missing utility meters Too many space types Utility data entry errors

33 Energy Audits
34
35 Value of an Energy Audit Understand how energy is used in the building Identify opportunities for low cost / no cost and capital improvements Provide financial analysis of opportunities
36 An energy audit is not What is an energy audit? Vendor proposal Preventive maintenance / calibration Cloud-based analytics tool Only completed in order to meet the city mandate An energy audit is Objective study Comprehensive all energy sources and uses Feasible, concrete actions to save energy Financial analysis for strategic planning

37 ASHRAE Energy Audit Levels

38 Level 2 Energy Audit Components Building systems description Utility analysis Recommended measures Low-cost/no-cost Capital projects Financial analysis Energy and cost savings Implementation cost Simple payback/roi Additional issues IAQ Maintenance considerations Future measures
39 RA, PE, CEM 2 Years Auditing Experience Energy auditor means AEE, AABC, ASHRAE 2 Years Auditing Experience No Certifications 5 Years Auditing Experience RA, PE, CEM, AEE, AABC, ASHRAE 2 Years Experience in the Building
40
41 Auditor Selection Process Meets City qualification criteria Has previous experience with facility type Provides a sample report Describes audit process with sufficient time on site Proposes reasonable fees Collaborative Bonus: Understands GA Power electric rates
42 GA Power Electric Rates: Average vs. Incremental Office Building: 300,000 SF Annual Energy Use 4,200,000 kwh Annual Energy Cost $525,000 Average Electric Rate $.125/kWh Incremental Electric Rate - RTP $.035/kWh Lighting Retrofit Average Rate Annual Energy Savings 400,000 kwh Implementation Cost $100,000 Annual Cost $.125/kWh $50,000 Payback 2.0 Years Lighting Retrofit Incremental Rate Annual Energy Savings 400,000 kwh Implementation Cost $100,000 Annual Cost $.035/kWh $14,000 Payback 7.1 Years
43 Missed opportunities Bad audits Wrong opportunities Not feasible Overstated savings Understated costs


44 Great audits!
45 Questions? Meghan McNulty

46 Addendum: 2018 ENERGY STAR Changes 33

47 ENERGY STAR certification for existing buildings Recognition for superior energy performance score of 75 or above, as calculated in Portfolio Manager and verified by a Professional Engineer or Registered Architect Based on a 12-month period of energy performance Buildings can re-apply for certification every 12 months 1 to 100 ENERGY STAR scores National Average Superior Energy Performance! Eligible to earn the ENERGY STAR Find certified buildings and plants: energystar.gov/buildinglist
48 Overall trend in U.S. building energy use (CBECS)

49 What does this mean for individual buildings? Because average energy and grid performance is improving, the ENERGY STAR scores and performance metrics of individual buildings will, on average, go down.
50 Any other changes in August? Data center energy estimates New option: Estimated data center energy use Designed for smaller data centers, within another property type, and where it is not practical to measure IT Energy If IT energy is not metered, users will have the chance to apply estimates generated by Portfolio Manager Estimate capped at 10% of the building area New use details in Portfolio Manager Warehouse Percentage of gross floor area used for cold storage (New in August) Percent that can be cooled and percent that can be heated (New in August for refrigerated warehouses) Worship Facilities Gross floor area used for food preparation (New in August) Percent that can be cooled and percent that can be heated (New in August) K-12 Schools Number of workers on main shift o Exists now, but will be required in August Supermarket Number of open or closed refrigeration/freezer units o Exists now, but will be required in August


51 Preparing for the metric updates If needed, document preupdate metrics with Portfolio Manager reports Performance Highlight Report Portfolio-level, multi-year Statement of Energy Performance Building-level, represents 12-month performance period

52 Preparing for the updates Apply for ENERGY STAR certification (policy for 2018 only): If you earned 2017 ENERGY STAR certification for your building, you may apply for 2018 certification using a period ending date of April 30, 2018, or earlier. Applications submitted: Before July 26, 2018 and which require no significant follow-up or changes, will be guaranteed to be approved and awarded certification using the existing score models. July 26, 2018 August 26, 2018 may be evaluated using the updated score models, especially if significant follow-up or changes to the application are required. After August 26, 2018 will be evaluated using the updated score models.