Orion In Situ Oil Sands 2015 Progress Update. Presented May 25, 2016
|
|
|
- Joan Rogers
- 5 years ago
- Views:
Transcription
1 Orion In Situ Oil Sands 2015 Progress Update Presented May 25, 2016

2 Agenda Introduction Geoscience Scheme Performance Surface Operations Compliance Future Plans 2

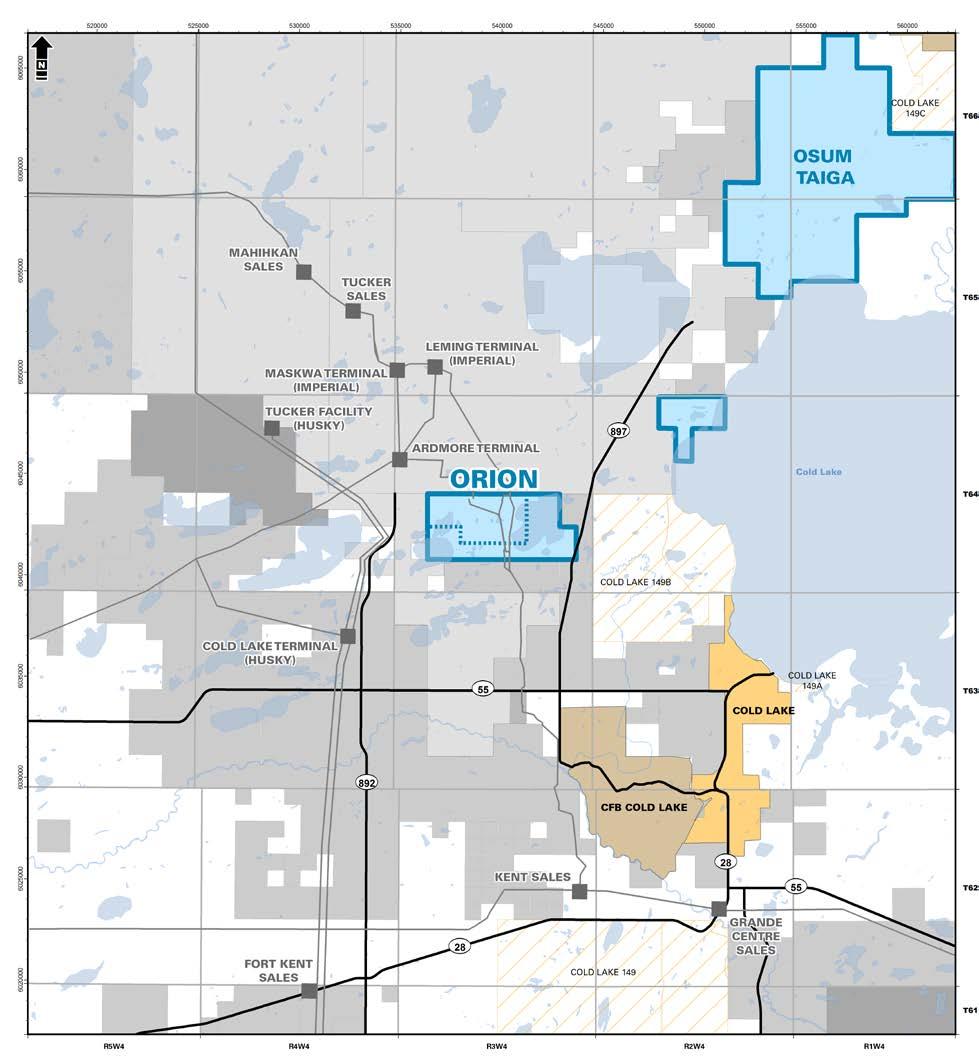

3 Project Location Osum Production Corp. 3
4 The Orion Project - History Osum Production Corp.. Daily Average Production (bbls) 10,000 8,000 Hilda Pilot 1 first steam Hilda Pilot 3 first steam Commercial Development Application 6,000 4,000 2,000 year EUB Commercial Scheme Approval Construction Shell acquires Black Rock Ventures Inc Commissioning and Start Up 0 EDTA Stimulations Conducted First Slotted Liner Perforation Osum Production Corp acquires Shell Orion 4

5 Geoscience 5

6 Well Data Osum Production Corp. 6

7 Cross Section W-E Osum Production Corp. 7

8 Cross Section N-S Osum Production Corp.. 8

9 Clearwater SAGD Reservoir Top Pay as per Commercial Scheme Approval 10103G Osum Production Corp. 9

10 Clearwater SAGD Reservoir Base Pay as per Commercial Scheme Approval 10103G Osum Production Corp. 10

11 Clearwater SAGD Reservoir Pay Thickness as per Commercial Scheme Approval 10103G Osum Production Corp. 11

12 Clearwater Reservoir Osum Production Corp. 12


13 Clearwater Sand Mineralogy Osum Production Corp. Sand is angular very fine- to fine-grained feldspathic litharenite Clay content is less than 2% of total rock Clay composition is Kaolinite, Illite, Chlorite, and Smectite 13
14 Reservoir Properties Osum Production Corp.. Horizontal Permeability ~2 6 D Vertical Permeability ~ D (Kv/Kh = 0.85) Viscosity ~100,000 cp Oil Saturation 67 70% Porosity 32 34% Thickness m Reservoir Depth ~425 m KB Initial Reservoir Pressure 3.2 MPa Initial Reservoir Temp 15 o C Basal water ~10 m below base pay Sandy heterolithic strata (SHS) facies between pay and basal water 14
15 Original Bitumen in Place (OBIP) and Recovery Osum Production Corp. Drainage Area, 50 m boundary (10 3 m 2 ) Average Net Thickness (m) Porosity (frac) Oil Saturation (frac) Total OBIP (10 6 m 2 ) Current Recovery % Estimated Recovery % Net thickness based on maps TOP to BASE of interpreted Clearwater SAGD Reservoir Pad % 60% Pad 104 * % 50% Porosity and oil saturation from logs and core; formation volume factor (FVF) = 1 Pad % 60% Pad 106 * % 50% Pad % 60% OBIP = Area x Net Pay x porosity x oil saturation x FVF Hilda Lake Pilot % 60% Orion Operating Area Orion Development Area Hilda Pilot Pad 107 Pad 103 Pad 105 Pad 104 Pad 106 Orion Project Area Net thickness measured from production well to top pay All SAGD Pairs ~ 100 m spacing 15

16 Clearwater Shale Caprock Thickness Osum Production Corp. 16


17 Caprock Osum Production Corp. 3 units of capping shales of significant thickness Undisturbed basement mapped on 3D seismic Vertical in-situ stress gradients at the top of the Clearwater Formation for seven wells in the Orion lease range from 20.3 to 20.8 kpa/m Depth Structure of Beaverhill Lake based on 3D seismic Seismic traverse 17
18 Seismic Data Osum Production Corp. 3D, 2D, Swath2D Hilda 3D March 2005, 1.8 km 2 2D seismic Blackrock, 2005 Orion baseline Swath 2D July 2007, 50 km Orion 3D April 2009, 8.4 km 2 Orion 3D and Hilda Lake 3D merged December 2015 Orion monitor1 Swath 2D November 2009, 50 km Orion monitor2 Swath 2D February 2011, 40 km Orion monitor3 Swath 2D February 2014, 66 km 18


19 Repeat Seismic 2D Swath Osum Production Corp. First Steam & Seismic Schedule Observations: Good thermal conformance and steam-chamber growth along most of the horizontal well bores RMS extractions of quadrature trace amplitude difference in the Clearwater Reservoir interval: 5 ms above to 3 ms below. Good lateral resolution allow estimates of perpendicular reach of steam chambers, to enable in-fill planning 19

20 Scheme Performance 20
21 Orion Field Production Osum Production Corp. Production/Injection (m3/d) Water 4250 Steam 4000 Oil Cum SOR
22 Orion Update 2015 Production Osum Production Corp. Oil Production (bbls/d) 10,000 9,000 8,000 7,000 6,000 5,000 4,000 3,000 2,000 1,000 - Jan-15 Feb-15 Mar-15 Apr-15 May-15 Jun-15 Jul-15 Aug-15 Sep-15 Oct-15 Nov-15 Dec-15 Well Interventions 3 stimulation jobs in PCP conversions Central Plant Facility 2015 average production 7736 bopd Full facility Turnaround performed in June
23 Well Stimulations Osum Production Corp. 3 EDTA stimulations were conducted on the following wells in 2015: P105-P4: 60 m3 10% EDTA Solution; Feb P105-P4: 40 m3 10% EDTA Solution; Oct Pilot P3: 18 m3 10% EDTA Solution April 2015 These stimulations were conducted on producer wells that had not been perforated, mainly to improve inflow by removing suspected calcium carbonate scaling. 23
24 Orion Production Performance Osum Production Corp production averaged 7736 bbl/d, peak monthly production of 9326 bbl/d Rates declined Q3/ as pressure dropped in the reservoir, and lift issues were encountered on some pads. Pressure declined as a result of boiler reliability issues resulting in steam injection shortfalls in the latter part of 2014 and the first half of Following comprehensive mechanical remediation of the (two) boilers, boiler reliability and steam injection rates have significantly improved and averaged ~4600 m3/d for Q3/ High, consistent steam rates will be utilized to re-pressure steam chambers With the pressure decline in the steam chambers the following occurred: Production from wells on natural flow dropped off sharply. Four of these wells were equipped with PCP pumps in December in order to improve production rates. There was also a loss of thermal energy within the steam chambers leading to a temperature decline and increased viscosity of the mobilized bitumen. 24
25 Orion SAGD Pressure Scheme Osum would ideally have liked to maintain a constant SAGD chamber pressure of MPa until late life SAGD operations. However the Q1/ boiler reliability challenges led to end-2015 pressures ranging from MPa. Osum has significantly improved boiler reliability and overall capacity, thus increasing the overall steam injection for the latter half of Osum has stabilized reservoir pressures and is gradually building pressure in several areas of the field. 25


26 Good Well Placement Pilot, Pad 103, Pad 105 Osum Production Corp. Clearwater Clearwater Sandstone Top Pay Base Pay Wabiskaw P105 - Pair 1 Sandy Injector Producer SHS 26
27 Well 105-P1 - Good Performance Well Pair Well placed in high quality facies, high rate potential Osum Production Corp. 300 Oil Prod Water Prod Acid Wash Acid Wash Perf Turnaround 250 Steam Inject Cum SOR


28 Well Placement Too Low Pads 104 & 106 Osum Production Corp. Clearwater Clearwater Sandstone Top Pay Lost core Base Pay Wabiskaw P106 - Pair 1 Sandy Injector Producer SHS 28
29 Well 106-P1 - Poor Performance Well Pair *injector and producer placed in sandy heterolithic sands, impact on production Osum Production Corp Oil Prod Water Prod Steam Inject Cum SOR Acid Wash Workover Turnaround Perf


30 P106-OB1 (109/ W400) Osum Production Corp. 16 m Distance to Nearest Horizontal: 10m (105/09-16 P106-I1) Steam chamber development occurring - P106-I1 (105/09-16) - P106-P1 (100/09-16) 30


31 Moderate Well Placement Pad 107 Osum Production Corp. Clearwater Clearwater Sandstone Top Pay Lost core Base Pay Wabiskaw P107 - Pair 1 Injector Sandy Producer SHS 31
32 Well 107-P1 - Medium Performance Well Pair *Production well placed marginally too low in the sandy heterolithic sands, reasonable rates Osum Production Corp. 300 Oil Prod Water Prod Steam Inject Cum SOR ESP Changeout Perf Turnaround

 Confirm")
 - P107-P1")
33 P107-OB1 (100/ W400) Osum Production Corp. Distance to Nearest Horizontal: 12m (105/14-16 P107-I1) Confirm calibration; fiber failed - P107-I1 (105/14-16) - P107-P1 (105/14-16) 33
34 Pad Recovery & Performance Osum Production Corp. 60% 50% Recovery % 40% 30% Pilot 1 Pilot 3 20% 10% 0% PV Steam 34

35 Osum Production Corp. Hilda Lake Pilot Injector Schematic 35

36 Osum Production Corp. Hilda Lake Pilot Producer Schematic 36

37 Typical Phase 1 Injector Completion Osum Production Corp. 37

38 Typical Phase 1 Producer Completion PCP Osum Production Corp. 38

39 Typical Phase 1 Producer Completion Steam Lift Osum Production Corp. 39

40 Artificial Lift Orion Wells Osum Production Corp. 107-WP1 PCP SAGD 15 Wells Natural Lift SAGD 7 Wells Pilot 1 Pilot WP2 107-WP3 107-WP4 Redrilled 1 Well 103-WP1 104-WP1 105-WP1 106-WP1 103-WP2 104-WP2 105-WP2 106-WP2 103-WP3 104-WP3 105-WP3 106-WP3 103-WP4 104-WP4 105-WP4 106-WP4 106-WP5 Criteria All Metal PCP Operating Temperature Range 350 o C Rate m3/d RPM 40


41 Ground Uplift Monitoring Osum Production Corp. Ground deformation measured with InSAR since March, corner reflectors; 938 coherent targets Ground uplift is normal and expected with thermal operations Osum Orion SAGD operations coincides with < 1.5 cm/yr uplift Imperial Oil Ltd CSS operations coincides with < 45 cm/cycle uplift Map location of InSAR corner reflectors assigned to areas 1-6 Within Osum SAGD operation, near CSS, observe cyclic overprint; uplift < 1.5 cm/yr, < 9 cm over 5.5 yrs Within Osum SAGD operation, no cyclic overprint uplift < 1.5 cm/yr, < 9 cm over 5.5 yrs Within Imperial CSS operations, uplift up to 45 cm/cycle No detrimental cap-rock, production or HSE impact reported, or expected Five years of monitoring have confirmed SAGD operations result in minimal, < 9 cm, uplift As a result, InSAR acquisition was suspended June 20, 2015 Monitoring equipment is still in place and data can be collected if deemed necessary Source InSAR Deformation Monitoring Osum Orion and Boundary 2015, Quarter 2, MDA Geospatial Services, June 20,

42 Orion Observation Well Location Map Osum Production Corp. 42
43 Osum Production Corp. Hilda Lake Pilot Observation Wells 43
44 Osum Production Corp. Typical Phase 1 Observation Well 44
45 Surface Operations
46 Plant & Facilities Summary Osum Production Corp. Osum has focused on maintaining: A safe operating environment Increasing asset reliability Maintaining/Improving production performance Meeting or exceeding regulatory license requirements Increasing the reliability of the two steam generation boilers was a primary focus in

47 Orion CPF Plot Plan Osum Production Corp. A Reverse Osmosis water treatment unit was added to treat brackish water. 47

48 Orion Water Usage and Treatment Osum Production Corp. 43
49 Orion Central Processing Facilities (CPF) Two conventional drum boilers are used to generate steam, which is sent via steam pipelines to the field for injection into the reservoir. Emulsion returns to the CPF by pipeline, produced gas is separated at the well pad and separately piped to the CPF where it is mixed with purchased natural gas for boiler fuel. Oil separation occurs in the FWKO and treater vessels, produced water is cooled and sent to de-oiling while oil is transferred to sales storage. The water treatment facilities treat produced water allowing it to be re-used to generate steam. The process allows us to reuse almost all of the produced water (95.5%). Brackish water is drawn from two McMurray formation source wells to supply required makeup water. The waste produced in the evaporative water treatment process is trucked offsite to an AER approved waste disposal facility. 49
50 De-Oiling Produced water from the production treating train is de-oiled using the following equipment: Skim Tank Designed to maximize retention time. Induced Gas Flotation Vessel Micro-Bubble Flotation (Hydrocarbon Content < 10ppm oil/water) Oil Removal Filters walnut shell Deep Bed Filtration. 50
 51")
51 Water Treatment Evaporator technology is utilized to produce Boiler Feed water (BFW) The evaporators at Orion: Produce BFW that meets or exceeds the water criteria set out by ASME Generate a concentrated brine waste stream that is disposed of at an AER approved facility Have a 95% design conversion rate of feed to distillate (BFW) 51

52 Steam Generation Conventional Boilers generate 100% quality steam at 6,000 kpag for injection at the Well Pads. A small concentrated blowdown of 3-5% of the inlet mass flow is recycled back to the Evaporator Feed Tank for re-use. Boiler Reliability was a key focus for Orion in Mud drum (tube-end to drum joints) fully welded out in both boilers. Re-configured Fuel Gas Control philosophy, to incorporate produced gas heating value. Tuning of boilers to address vibration issues at start up conditions and low firing rates. Boiler stress reduction improvements. 52
53 Orion Vapour Recovery System The vapour recovery system allows for collection, compression and utilization of produced vapours. All recovered vapour is used as fuel in the steam generation system. The sources of vapour are: Evaporator vent recovery Ten storage tanks Diluent recovery system Induced Gas Flotation system The vapour recovery system is integrated with the Low Pressure (LP) flare system. If the vapour recovery system is not available the recovered vapour is diverted to the LP flare system 53

54 Orion Well Pad Facilities The facility has 6 well pads with a total of 22 SAGD well pairs Typical well pad configuration is 4 SAGD well pairs, which consists of 4 injector and 4 producer wells 54
55 Plant & Facilities Summary Boiler reliability improvement and maximizing Boiler Feed Water (BFW) supply in 2015 was a major focus: Increased boiler and overall plant reliability to target measures mainly after the turnaround in June 2015 Installed an Reverse Osmosis (RO) unit to increase BFW and steam supply Utilization of ph and Silica carrier chemical for Evaporator fouling reduction and increase in BFW supply Facility performance and site condition improvements: Well pad berm rebuild for improved containment capability Site grounds grading for better run-off management Improved Well pad maintenance program Improvements to boiler control parameters yielding higher steam production rates 55
56 2015 Plant Reliability 94.2% Plant Reliability Downtime due to: June Turnaround 2.9% Boiler Outages 2.2% Power Outages 0.3% Others 0.4% 56
57 Monthly Steam Production Steam Volume (M3) Jan-15 Feb-15 Mar-15 Apr-15 May-15 Jun-15 Jul-15 Aug-15 Sep-15 Oct-15 Nov-15 Dec-15 57
58 Brackish Water Modifications June brackish water well was tied into production line, increasing brackish water capacity. Sept rental RO package installed to support boiler feed water demand. 58
59 Brackish Water Usage , ,000 1F1/15-16 and 1F1/ W4M brackish water wells 35,000 30,000 Cumulative usage Total brackish water usage 209,495 m 3 200,000 Volume (m 3 /month) 25,000 20,000 15, , ,000 Cumulative Volume m 3 10,000 50,000 5,

60 Produced Water Total brackish water usage 209,495 m 3 60
61 Water Disposal Limits Increased limit Sept 1st 2015 Cumulative Disposal Water Disposal (m3) 30,000 25,000 20,000 15,000 Limit Disposal Water Disposal (m3) 180, , , , ,000 80,000 Compliant as of early December 10,000 5,000 60,000 40,000 20,000 Cumulative disposal Cumulative limit - Jan Feb Mar Apr May Jun Jul Aug Sep Oct Nov Dec - Jan Feb Mar Apr May Jun Jul Aug Sep Oct Nov Dec Effective September 1 st, 2015 water disposal limit calculation changed to the Directive 81 formula from a 90% produced water recycle rate: In early December our cumulative disposal was within acceptable limits. 61
62 On-Site Water Disposal 2015 License permits produced water and recovered steam condensate to be disposed into the Granite Wash formation. Disposal Approval #8175 Granite Wash water disposal well 02/ W4M (AER License # ) Normal Operating Pressure Range: KPa Protected by a high pressure shutdown limit of KPa Normal Disposal Temperature Range: deg C McMurray water disposal well 03/ W4M (AER License # ) Suspended Nov. 2011
63 Measurement, Accounting & Reporting Plan (MARP) Enhanced Production Audit Program (EPAP) MARP Annual MARP revision prepared in conjunction with third-party specialist April 2015 Accounting meters calibrated / verified on an annual basis EPAP EPAP initial declaration for reporting facilities (treating, injection and water disposal) effective March 2016 Utilized third-party controls specialist to complete initial controls documentation, evaluation and testing Remediation of identified deficiencies is underway 63
64 Orion Well Integrity Wellhead Integrity Maintenance Include wellhead integrity checks as part of all completions activities Yearly wellhead integrity maintenance completed June, All thermal wellheads and components visually inspected and re-torqued to specification Wellhead components inventory and tracking system components specifications, up-to-date pictures, scheduled maintenance information will be available online through service provider s website During Conducted Multi-finger Caliper and/or Vertilog on five wells well casings on all five wells checked out satisfactory 64
65 Monthly Energy Intensity 2015 Osum Production Corp Bitumen Production (m3) GJ/Bitumen Production 50,000 45,000 40, ,000 Gj/m3 Bitumen ,000 25,000 20,000 15,000 Bitumen m3/month ,000 5,000 - Jan-15 Feb-15 Mar-15 Apr-15 May-15 Jun-15 Jul-15 Aug-15 Sep-15 Oct-15 Nov-15 Dec-15-65
66 Monthly Gas Usage 2015 Osum Production Corp Total Fuel Gas Consumption: 110,338 E3M Total fuel gas (E3m3) Vented gas (E3m3) Flared gas (E3m3) Gas production (E3m3) Gas receipts (E3m3) Jan Feb Mar Apr May Jun Jul Aug Sep Oct Nov Dec 66
67 Monthly Power Consumption 2015 Osum Production Corp Total Annual Power Consumption: 58,891 MW-hr 6000 Power Consumption (MW-hr) / / / / / / / / / / / /12 67
68 Water Proration Factors 2015 Osum Production Corp Range to Jan-15 Feb-15 Mar-15 Apr-15 May-15 Jun-15 Jul-15 Aug-15 Sep-15 Oct-15 Nov-15 Dec-15 68
69 Oil Proration Factors 2015 Osum Production Corp Range to Jan-15 Feb-15 Mar-15 Apr-15 May-15 Jun-15 Jul-15 Aug-15 Sep-15 Oct-15 Nov-15 Dec-15 69
70 Fresh Non-Potable Water Usage 2015 Osum Production Corp. Volume m3/month 1,600 1,400 1,200 1, Cumulative Fresh Water Usage Monthly Fresh Water Usage Water drawn from WSW well Situated at W4M Under Water Act Approval Water levels have steadily increased since monitoring began in 2006 even though water production increased from TDS concentration is 750 mg/l Dissolved iron concentration is 2.4 mg/l All concentrations exceed Drinking Water Guidelines Water is therefore used for domestic needs Total 2015 Fresh Water Usage = 4,577 m3 Max Annual Allowable Volume = 23,725 m3 5,000 4,500 4,000 3,500 3,000 2,500 2,000 1,500 Cumulative volume m , Jan-15 Feb-15 Mar-15 Apr-15 May-15 Jun-15 Jul-15 Aug-15 Sep-15 Oct-15 Nov-15 Dec-15-70
71 2015 Cumulative Water Balance Osum Production Corp. Source Water Wells Brackish Water-Make-Up W4M W4M BRACKISH Water Treatment and Steam Generation STEAM PRODUCED Injection Wells Produced Water Fresh Water Well W4M Water Act Approval DISPOSAL IN Volume Produced 1,292,782 m 3 Brackish 209,495 m 3 Disposal Evaporator Blowdown/ Excess Produced Water Disposal Well W4M Tervita W4M UTILITY Fresh 4,577 m 3 Diluent Pipeline Water 38 m 3 Septic TOTAL 1,506,892 m 3 OUT Volume Steam 1,364,998 m 3 Disposal 157,690 m 3 Fresh water usage 4,577 m 3 IPF Pipeline Water 2,087 m 3 TOTAL 1,529,352 m 3 DILUENT PIPELINE WATER IPF PIPELINE WATER Difference (as a percentage of total in s) 22,460 m 3 1.5% Disposal Limit 13 % Actual Disposal 12 % 71
72 Compliance 72
73 Off-Site Waste Disposal Tervita-Lindbergh Class 1b W4M Evaporator Blowdown 83,591 m 3 Turnaround Volumes from Vessel Cleaning- Sludge 520 m 3 RBW Waste Management Contaminated soil from housekeeping and hydro-vac activities 50 m 3 Recycle-Glycol, Lube oil, Filters, Oily rags, Aerosols, Methanol 33.6m 3 Recycle-Scrap metal 0.2 m 3 NORM from refractory brick 2.3 m 3 67
74 Domestic Waste Disposal Domestic waste water from the administrative offices washrooms and kitchens are collected in holding tanks and disposed of weekly by a commercial septic service. Total volume disposed of at a Town of Bonnyville Waste Facility was 1297 m 3 Domestic waste is hauled to municipal landfills in either Cold Lake or Bonnyville. Approximately 262 kilograms was disposed. Paper, cardboard and steel recycling program processed 1077 kg of material. 68
75 Air Monitoring Programs Monthly air contaminant concentrations for SO 2 /NOx, annual manual stack survey results, fugitive emissions, greenhouse gas emission and summarized monthly emission reporting is submitted in accordance with EPEA Approval requirements. Sulphur emissions at the facility peaked at 0.45 t/d in May 2015 and averages 0.34 t/d. This trend is not anticipated to change in the near term. Sulphur dioxide emissions peaked at 0.9 t/d in May which prompted a request to raise the facility EPEA limit from 0.9 t/d to 1.61 t/d based on modelling results the average daily emission rate for SO 2 is 0.67 t/d. The 2015 fugitive emissions survey noted 22 leaks - all were repaired within a week of determination. 69
76 25.00 Sulphur Emissions (Tonnes) Monthly Limit tonnes/month Quarterly Emissions Volume (Tonnes) Q1 Q2 Q3 Q4 Limit t t t t t Jan-15 Feb-15 Mar-15 Apr-15 May-15 Jun-15 Jul-15 Aug-15 Sep-15 Oct-15 Nov-15 Dec-15 Jan-15 Feb-15 Mar-15 Apr-15 May-15 Jun-15 Jul-15 Aug-15 Sep-15 Oct-15 Nov-15 Dec-15 Sulphur

77 SO2 Volumes Monthly/Quarterly (Tonnes) Monthly Limit tonnes/month Volume (Tonnes) Jan-15 Feb-15 Mar-15 Apr-15 May-15 Jun-15 Jul-15 Aug-15 Sep-15 Oct-15 Nov-15 Dec-15 Jan-15 Feb-15 Mar-15 Apr-15 May-15 Jun-15 Jul-15 Aug-15 Sep-15 Oct-15 Nov-15 Dec-15 Flare Stack
78 Monthly NOx Emissions Per Boiler Limit tonnes/month/boiler Volume (Tonnes) January February March April May June July August September October November December Boiler Boiler

79 Air Monitoring Program Passive Ambient air monitoring is fulfilled by supporting the LICA Airshed and participating on the Airshed steering committee. Osum continues to operate 5 passive monitoring stations- 4 fence-line and one at landowners request. 73
80 Monthly Greenhouse Gas Emissions (Tonnes of CO2E) 25, , Compliance Emission Rate CO 2 eq/m 3 Actual CO 2 eq/m 3 Volume (Tonnes CO2E) 15, , , Jan-15 Feb-15 Mar-15 Apr-15 May-15 Jun-15 Jul-15 Aug-15 Sep-15 Oct-15 Nov-15 Dec-15 Jan-15 Feb-15 Mar-15 Apr-15 May-15 Jun-15 Jul-15 Aug-15 Sep-15 Oct-15 Nov-15 Dec-15 Emissions Tonnes of CO2E 12, , , , , , , , , , , ,

81 Groundwater Monitoring Program The groundwater monitoring program was consistent with previous years, no negative trends were detected No new wells were added Arsenic well program sampling events were increased to quarterly and a solute transport model was commissioned 75

82 Wildlife Monitoring Program The wildlife monitoring program included a breeding bird, yellow rail and amphibian survey and a winter tracking event; A comprehensive report summarizing the last 7 years of monitoring was submitted in 2016; and The 2015 monitoring program was augmented with the addition of remote cameras for above ground pipeline crossing utilization and acoustical recorders in addition to the approved program. The additions increased the species richness captured over previous years. 76
83 Environmental Monitoring Program In accordance with Conditions outlined in EPEA Approval and Water Act Approval the remaining annual reports were prepared and submitted for: Industrial Waste Water and Surface Water Surface Water Quality-Ethel and Hilda Lake Conservation and Reclamation Domestic Water Use Conditions were reflective of previous years for these reports. 77
84 Amendments to Existing Approvals EPEA Approval was issued in response to increasing sulphur dioxide daily emissions from 0.9 t/d to 1.61 t/d. An extension of the existing approval was issued on July 21 to move expiry of current approvals to July 31, 2016 or upon issuance of EPEA Approval Changes to Scheme Approval for J/M- Phase 2 development (Pads 301,302,403,404) and amendment to well layout and addition of 103 wells K- Installation of Reverse Osmosis Unit L- Rescinding of Condition 8-Regarding Long-Term Supply Pumping Test 78
85 Compliance Sulphur dioxide emissions were exceeded on May 18 th. This prompted both the investigation into the source of the increased volume of produced gas entering the facility and applying to increase the limit to reflect modelled tolerances. Osum requested a joint audit of the facility by the AER to ensure continued compliance efforts and identify any gaps requiring correction. This was conducted on March 8 and 9 th,
86 Future Plans 86
 but with the following changes: Pad 302: Changed from 8 SAGD well pairs with 100 m spacing to 12 SAGD well")
87 Future Plans Field Development for Orion Phase 2 Osum Production Corp. AER Category 2 Amendment Application for Orion Phase 2 was submitted November 2015 and approved Jan 6 th Included the full development plan as submitted previously (for Pads 301, 302, 403 and 404) but with the following changes: Pad 302: Changed from 8 SAGD well pairs with 100 m spacing to 12 SAGD well pairs with 67 m spacing and 990m well length Pad 103 Infill wells: 3 Producer wells drilled between existing Pad 103 and the toe end of Pad 105 SAGD well pairs; total well length 980 m The timing of executing this development is under review 87
88 Future Plans CPF Debottlenecking Debottlenecking projects under consideration for near term implementation. Objectives include: o Reduce time to build reservoir pressure across the field back into the target range o Provide incremental production o Reduce OPEX through on-site treatment of evaporator blowdown waste stream which will: o Reduce off-site disposal volumes o Increase water recycle rates to be used for additional steam generation Within Existing AER Scheme Approvals from Orion Phase 2 Expansion: Installation of 3 rd Boiler (H-4300) Installation of new underground brackish water pipeline from well to CPF AER Scheme Amendment Approval Required (D78 submission ~ July 2016): Crystallizer addition to treat evaporator blowdown waste Additional Reverse Osmosis (RO) unit for brackish well feed Polisher addition for boiler continuous blowdown to remove loading on evaporators for additional steam generation 88
89 Thank you