Chesapeake Bay Water Quality Restoration:
|
|
|
- Tyler Taylor
- 5 years ago
- Views:
Transcription

1 Chesapeake Bay Water Quality Restoration: The Transition to a Regulatory Approach Building on Decades of Cooperative Partnership Rich Batiuk Assoc. Director for Science Chesapeake Bay Program Office U.S. Environmental Protection Agency Region 3
2
3

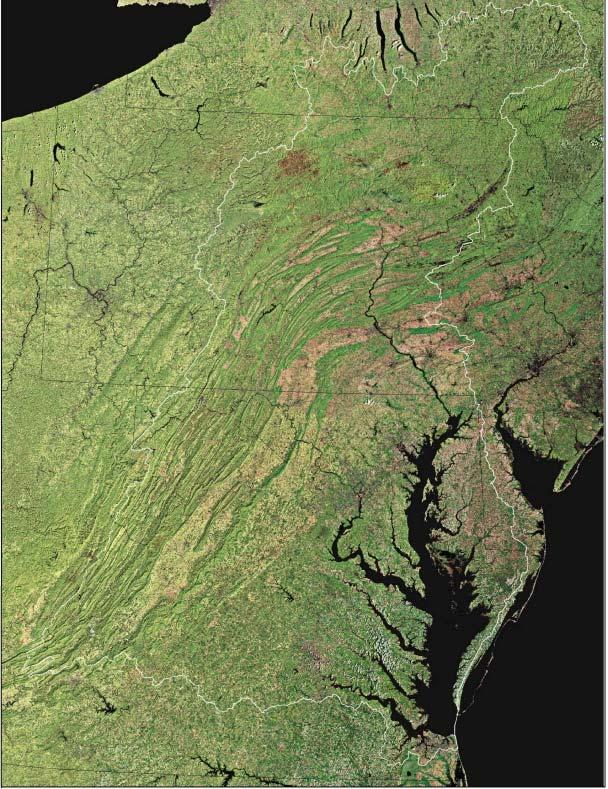
4 Over 90% of the Bay and its tidal rivers are impaired due to low dissolved oxygen levels and poor water clarity, all related to nutrient and sediment pollution. Without oxygen and grasses, the Bay s crabs, oysters, and fish cannot survive and thrive. Impaired Water Source: U.S. EPA 1998

5 Partners Commitment to Restored Bay Water Quality By 2010, correct the nutrient- and sediment-related problems in the Chesapeake Bay and its tidal tributaries... Step 1: What is the water quality of a restored Bay? Step 2: How much pollution do we need to reduce? Step 3: What actions do we need to take to reduce pollution? Source: Chesapeake Executive Council 2000

6 What Do We Want to Achieve? Water quality that supports abundant fish, crabs, oysters and underwater grasses in the Bay and its rivers. Source: Chesapeake Executive Council 2000


7 Water Quality in a Restored Bay Fewer algae blooms and better fish food. Clearer water and more underwater Bay grasses. More oxygen and improved habitat for more fish, crabs and oysters. Source: U.S. EPA 2003a

8 VA Current State MD WQ Standards Source:
9 We Now Have Bay habitat specific designated uses Bay specific water quality criteria Consistent state Bay water quality standards regulations across MD, VA, DE and DC N, P and sediment loading caps allocated by major tributary basin by jurisdiction Local-based tributary strategies describing actions need to meet loading caps Basinwide permitting strategy addressing 480+ significant municipal, federal and industrial facilities
10 And Just Around the Corner Spring 2008 release of the states impaired waters list for the Bay and tidal rivers - Will be the 303(d) list driving the list of tidal waters for which TMDLs must be established Next generation of linked Bay models - Airshed, watershed, Bay water quality/sediment transport, filter feeders models Bay watershed TMDLs due by 2010 (2011 at the latest) - Consent decrees in Virginia and the District and an MOU in Maryland w/epa along with the states (d) list for Bay tidal waters are the legal drivers
11 And Just Around the Corner Chesapeake Bay Program partner s Strategic Implementation Plan - Includes initial focus on inventorying federal actions, funds directed towards Bay and watershed restoration - Strategic actions to accelerate implementation actions focused on reducing N, P and sediment from agriculture, wastewater and developing lands - Strategies to address other keystone commitments under the Chesapeake 2000 agreement


12 Refined Designated Uses for the Bay and Tidal Tributary Waters Source: U.S. EPA 2003b A. Cross Section of Chesapeake Bay or Tidal Tributary Shallow-Water Bay Grass Use Deep-Water Seasonal Fish and Shellfish Use Deep-Channel Seasonal Refuge Use Open-Water Fish and Shellfish Use B. Oblique View of the Chesapeake Bay and its Tidal Tributaries Migratory Fish Spawning and Nursery Use Shallow-Water Bay Grass Use Deep-Water Seasonal Fish and Shellfish Use Open-Water Habitat Deep-Channel Seasonal Refuge Use
 during the respective growing season. Source: U.S. EPA 2003b Shallow Water Shallow water use")
13 Shallow-Water Bay Grass Use Supports underwater Bay grasses in shallow waters (0.5-2 m) during the respective growing season. Source: U.S. EPA 2003b Shallow Water Shallow water use

14 MD, VA, DE and DC have adopted the 185,000 acre Bay grasses restoration goal into their state water quality standard regulations Bay Grasses Restoration Goal Source: U.S. EPA 2003b
 Needed to Survive by Species 6 Striped Bass: 5-6")

15 Source: U.S. EPA 2003a Bay Dissolved Oxygen Criteria Migratory Fish Spawning & Nursery Areas Minimum Amount of Oxygen (mg/l) Needed to Survive by Species 6 Striped Bass: 5-6 Shallow and Open Water Areas Deep Water White Perch: 5 Hard Clams: 5 American Shad: 5 Yellow Perch: 5 Alewife: Crabs: 3 Bay Anchovy: 3 Deep Channel 1 Spot: 2 0 Worms: 1

16 Bay Criteria, Uses Adopted in State WQS Regulations DE (2004), MD (2005), VA (2005/2006), DC (2006) Standards adopted in terms of designated use by CBP segment WQ criteria, uses, attainment assessment methods essentially fully consistent across jurisdictions Source: U.S. EPA 2007
17 Chesapeake Bay Program Current Modeling Structure Airshed Model Watershed Model Estuary Model
18 Nutrient Loadings vs. Dissolved Oxygen Criteria Attainment Millions of pounds per year nitrogen phosphorus 100% 90% 80% 70% 60% 50% 40% 30% 20% 10% 0% % Dissolved Oxygen Criteria Attainment Source: U.S. EPA 2003c
19 Allocating Responsibility for Reducing Nutrients and Sediments By 9 major river basins...then by 20 major tributary basins by jurisdiction then by 44 statedefined tributary strategy subbasins Watershed Partners Responsibility Watershed States Responsibility Source: U.S. EPA 2003c
20 Nutrient and Sediment Cap Load Allocations Basin/Jurisdiction Nitrogen Allocation Phosphorus Allocation Upland Sediment Allocation (million pounds/year) (million pounds/year) (million tons/year) SUSQUEHANNA PA NY MD SUSQUEHANNA Total EASTERN SHORE - MD MD DE PA VA EASTERN SHORE - MD Total WESTERN SHORE MD PA WESTERN SHORE Total PATUXENT MD PATUXENT Total POTOMAC VA MD WV PA DC POTOMAC Total RAPPAHANNOCK VA RAPPAHANNOCK Total YORK VA YORK Total JAMES VA WV JAMES Total EASTERN SHORE - VA VA EASTERN SHORE - VA Total SUBTOTAL CLEAR SKIES REDUCTION -8 BASIN-WIDE TOTAL Science-based -Equitable - Based on pollution contribution to Bay/river water quality -Adopted by the Governors, the Mayor and EPA in 2003 Source: U.S. EPA 2003c
21 Cap Load Allocations by State Nitrogen Allocation (million pounds/year) Phosphorus Allocation (million pounds/year) PENNSYLVANIA MARYLAND VIRGINIA DISTRICT OF COLUMBIA NEW YORK DELAWARE WEST VIRGINIA SUBTOTAL CLEAR SKIES REDUCTION -8 BASIN-WIDE TOTAL Source: U.S. EPA 2003c

22 State Tributary Strategies River specific, local action driven nutrient/sediment pollution clean up plans Actions and schedules for reducing point sources, agricultural, stormwater, septic and air deposition loads to the Bay and tidal rivers. Key to accelerating implementation: funding strategies, policy changes, legislative actions.

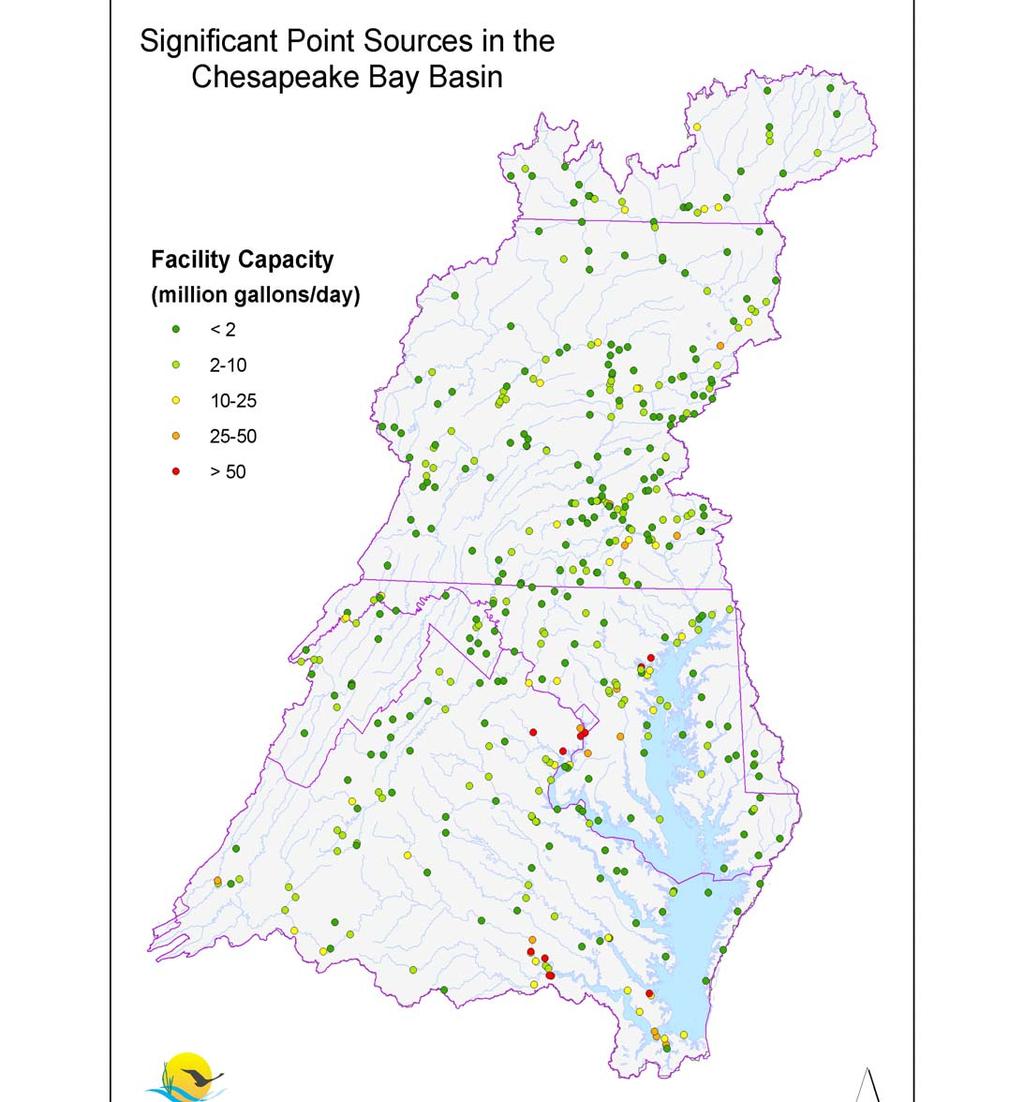
23 Basinwide Permitting Approach Unprecedented multi-state permitting agreement Annual load limits vs. monthly conc. limits Watershed-based permitting Addresses complex compliance schedule issues Addresses monitoring requirements and reporting schedules Source: U.S. EPA 2004
24 Significant WWTPs in the Chesapeake Bay Watershed (as of June 2007) JURISDICTION NUMBER OF FACILITIES Municipal/Federal Industrial/Federal TOTAL New York Pennsylvania 182/1 30/1 214 Delaware Maryland 69/ West Virginia 13 14/1 28 District of Columbia Virginia 98/ Total 392/10 79/2 483
25
26 Bay Watershed TMDLs Spring 2008 states 303(d) list as the driver - Fall 2007 drafts previewed by the states indicate over 95% of the Bay s tidal waters will continue to be listed as impaired Need to address consent decrees in VA, DC and MD-EPA MOU A TMDL covering six-states and 64,00 square mile watershed has never been done before - The TMDLs will be developed by the partnership and established by EPA
 Modeling System Phase 5 Watershed Model Year-to-year changes in land use and BMPs; 899 segments; 24 land uses; 296")
27 The Forthcoming Next Generation of Bay Models Nitrate and ammonia deposition from improved Daily Nitrate and Ammonium Concentration Models using 35 monitoring stations over 18 simulation years. Adjustments to deposition from Models-3/Community Multi-scale Air Quality (CMAQ) Modeling System Phase 5 Watershed Model Year-to-year changes in land use and BMPs; 899 segments; 24 land uses; 296 calibration stations; 21 simulation years; sophisticated calibration procedures; calibration demonstrably better in quality and scale Chesapeake Bay Estuary Model Detailed sediment input; Wave model for resuspension, Full sediment transport; Filter feeder simulation; Simulation of Potomac algal blooms; 54,000 model cells; 18 simulation years
28 Scale of Allocations The partners are exploring different scales for the required waste load and load allocations, including county/municipal level allocations for key sources of nutrient and sediment pollutants.
29 Rich Batiuk Associate Director for Science U.S. Environmental Protection Agency Chesapeake Bay Program Office