The Chesapeake Bay Program
|
|
|
- Linette Cooper
- 5 years ago
- Views:
Transcription

1 The Chesapeake Bay Program Partnership, Progress and the Path Forward to Restore the Bay University of Delaware Nutrient Management Symposium August 22, 2011 Jon M. Capacasa, P.E., Director Water Protection Division EPA Region III 1
2 Chesapeake Bay Watershed Largest U.S. estuary Six-states and DC drain a 64,000 square mile watershed Declared national treasure by President Obama Exec Order May ,000 miles of shoreline (longer than U.S. west coast) Over 3,600 species of plants, fish and other animals Average depth: 21 feet $750 million contribution annually to local economies Source: 2
3 Chesapeake Bay Watershed Land to Water ratio of 15:1 what happens on the land matters! Home to 17 million people (and counting) 77,000 principally family farms Animal Population

4 History of the Partnership Original Partners in the Chesapeake Bay Program: States of Maryland, Virginia, Pennsylvania, Washington D.C., the Chesapeake Bay Commission and the Federal Government (EPA rep) Chesapeake Bay Partnership Formed Chesapeake Bay Agreement Signed Chesapeake 2000 Agreement Headwater States Added Delaware, New York and West Virginia via MOU with a water quality focus CBP Vision: To lead and empower others to protect and restore the Chesapeake Bay ecosystem for future generations. Clean Water Act Section 117 is the authorization for the program FY 2011 budget of $54 million (EPA) + other federal agencies 4


5 A Broad Partnership at Work! Citizens Advisory Committee Local Government Advisory Committee Chesapeake Executive Council Chair Lisa Jackson, EPA Principals Staff Committee Chair Shawn Garvin, EPA Action Teams Independent Evaluator Scientific & Technical Advisory Committee Communications Workgroup Chair-- NOAA Vice-- VaDCR Management Board Independent Evaluator Chair MdDNR EC/FLC Alignment Chair EPA ChesapeakeStat/Adptv. Mgt. Co-Chair MdDNR Co-Chair USNA Chair ViceChair Cdtr Staff Sustainable Fisheries NOAA MdDNR NOAA CRC Protect & Restore Vital Habitats USFWS MdDNR USFWS CRC Goal Implementation Teams Protect & Restore Water Quality EPA UDel EPA CRC Maintain Healthy Watersheds NGO(TNC) MdDP EPA CRC Foster Chesapeake Stewardship NPS PaDCNR NPS CRC Enhance Partnering, Leadership & Management VaDCR EPA EPA CRC Science, Technical Analysis, and Reporting Umd USGS USGS CRC Implementation Workgroups Implementation Workgroups Implementation Workgroups Implementation Workgroups 5 Implementation Workgroups Implementation Workgroups
6 Key Commitment of the Chesapeake 2000 Agreement: June 28, 2000 By 2010, correct the nutrient- and sediment-related problems in the Chesapeake Bay and its tidal tributaries sufficiently to remove the Bay and the tidal portions of its tributaries from the list of impaired waters under the Clean Water Act.

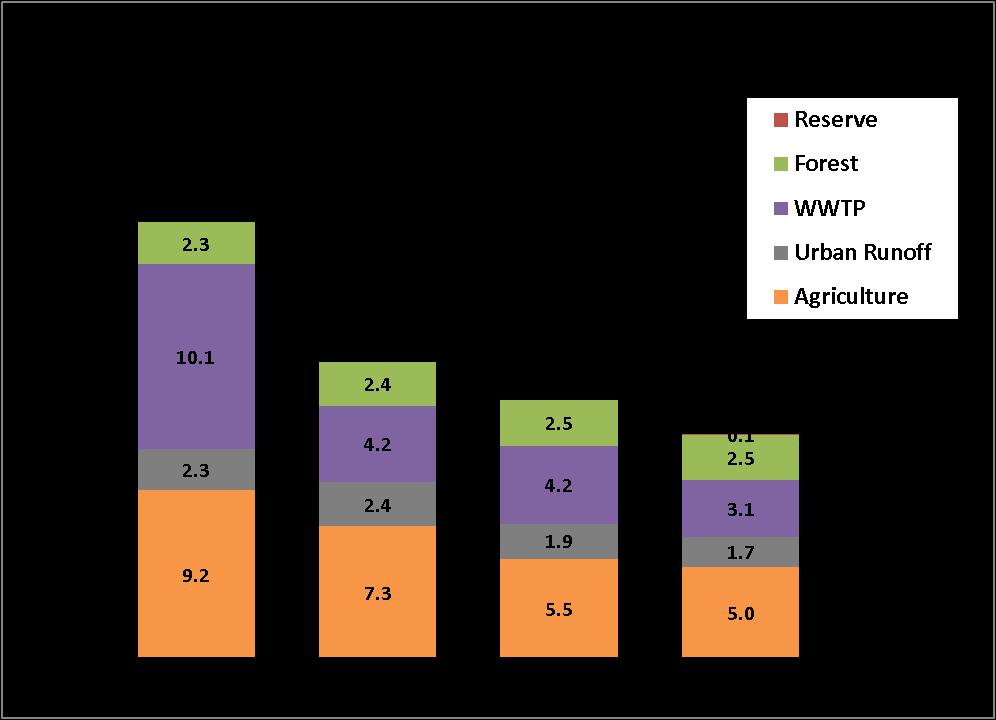
7 Sources of Pollution - How People Use the Land Agriculture animal manure, commercial fertilizer Air pollution tailpipes, power plants Urban/suburban runoff fertilizer, stream erosion Wastewater wastewater treatment plants 7

8 Pre-decisional not for release under FOIA
9 Progress and Path Forward Nitrogen Load Reductions 27.1 % progress since 1985 in the face of substantial watershed growth and development The Path Forward: 25% further reduction from 2009 levels over the next 15 years while holding the line Phosphorus Load Reductions 31.5% progress since 1985 in the face of substantial growth The Path Forward: 24% further reduction from 2009 levels over the next 15 years and holding the line i.e., Offsetting new and increased loadings in the interim Pre-decisional not for release under FOIA
10 10
11 Employing A Mix of Strategies Flexibility of State-Specific Plans COMMON FEATURES Regulatory controls and funding for wastewater treatment (nearly 500 significant facilities) Air Deposition regulatory controls (NOx, Ozone ) Source Controls Phosphate detergent bans Feed management for animal feeding operations Best Management Practices No till farming - better manure storage and transport Cover crops - regulatory AFO/CAFO permitting Riparian area buffers - enhanced nutrient management plans Federal and state cost sharing Pre-decisional not for release under FOIA
 in the nation Caps for nitrogen, phosphorus and sediment loading A comprehensive roadmap for restoration using Clean Water Act")
12 Our Path Forward A Pollution Budget for the Chesapeake Watershed A rigorous and historic pollution diet (The BAY TMDL) to restore clean water to Bay and the region s streams, creeks and rivers December 29, 2010 The largest such Total Maximum Daily Load (TMDL) in the nation Caps for nitrogen, phosphorus and sediment loading A comprehensive roadmap for restoration using Clean Water Act authority supplemented by State Strategies. Advantage: All sectors and major sources of pollution allocated responsibility using common methods and best science at the time. Why a Chesapeake Bay TMDL? Insufficient restoration progress through current voluntary and regulatory measures. Required under the Clean Water Act; also responds to court orders and legal settlements, cornerstone of Executive Order Strategy (2010). 12
13 Built Upon State-Specific Strategies The strength of the Bay TMDL (pollution budget) is drawn from its foundation Watershed Implementation Plans (WIPs) per State define the means by which the load reductions will be achieved within 15 years A new Accountability Framework to help ensure continued progress EPA has a key oversight responsibility WIPs per state updated in 3 Phases adaptive change 2-Year Milestones establish and report on progress Independent Evaluator process 13


14 Nitrogen Loads Delivered to Bay Overview of Accountability Process Federal Actions Watershed Implementation Plans identify nitrogen, phosphorus and sediment targets that meet water quality standards. Plans include: 1. Evaluation of Program Capacity necessary to fully restore water quality if insufficient Watershed Implementation Plans or 2-year milestones Chesapeake Bay TMDL: Set Pollution Reduction Goals for Point and Non-point Sources to Meet Bay Water Quality Standards Model and Monitor to assess progress 2-Year Milestones with program enhancements and nitrogen, phosphorus and sediment reduction commitments 2. Identification of Gaps between needed and existing program capacity 3. Schedule and Strategies Year to enhance programs and reduce nitrogen, phosphorus and sediment TOTAL Agriculture Developed Wastewater Onsite


15 QUESTIONS (215) (410) Agricultural Contact 15