Directed Manipulation of Crop Water Status Through Canopy Temperature-based Irrigation Management
|
|
|
- Hubert Wheeler
- 5 years ago
- Views:
Transcription
1 Directed Manipulation of Crop Water Status Through Canopy Temperature-based Irrigation Management James R. Mahan, Plant Physiologist, USDA/ARS, Lubbock, Texas, Andrew W. Young, Graduate Student, Department of Plant and Soil Science, Texas Tech University, Lubbock, Texas, Abstract. While the relationship between canopy temperature and plant water status is well established, canopy temperature as a means of controlling crop irrigation has been limited in production applications due to the cost and complexity of temperature monitoring. A new low-cost infrared thermometry system, coupled with the BIOTIC irrigation protocol of the USDA/ARS allows for a biologically-based, simple, reliable and affordable approach to crop irrigation that is well suited to production agriculture. Beyond meeting the crop s water needs, this system has shown promise for an ability to actively manipulate the water status of the crop to achieve desirable outcomes (e.g. product quality and water savings) that results in water-management derived improvements in the profitability of agricultural systems. Results from field level studies of full irrigation and managed deficits will be presented. Keywords. plant temperature, irrigation scheduling, BIOTIC, temperature signatures, water stress. Introduction Over the past decade there has been a growing awareness of the importance of water use by plants. This increased interest is, in part, a result of the realization that the world s water resources have been largely identified/exploited and that the prospect of additional freshwater becoming available is limited. While the idea of getting by with existing (and in some cases declining) water resources is indeed troubling, there is an element of hope in the fact that we have only begun to understand and research the responses of plants to limited water. Thus there is a great deal of opportunity to improve a number of aspects of plant water use. Since many of the wasteful uses of water that are common today are a result of a lack of alternative methods that are suitable for use in agricultural systems, the prospect of significant improvement is favorable. Major opportunities for improving irrigation management include; residential uses (lawn and garden), large scale turf (landscaping and golf courses), plant production (nurseries and turf farms), horticultural and, perhaps most substantially, farming. While the volumes of water involved, the scales and means of production and the economic return on water vary significantly among these water uses, the plant is a common element. While in all instances, irrigation water is used by the plant, the plant itself has often been relegated to an ancillary position when it comes to irrigation decisions. Adoption of 1
2 plant-centered irrigation management will hopefully improve the general reliability of irrigation management. At this point it might be useful to make a distinction between methods used to measure/monitor water use in research settings versus those that are used by endusers to manage irrigation. Researchers can often employ methods without regard to economic and engineering considerations that would render the methods unsuitable for use in production settings. Production settings in this instance will be considered broadly as those end uses in which factors other than the scientific soundness of an approach might render it less than suitable for widespread practical use. In subsequent references production settings will be used to describe non-research applications of water management. Since our primary interest is in cropping systems on a production scale, the remainder of this paper will focus on research and production settings. The basic insights however should be directly applicable to a variety of other plant/irrigation systems. Most methods for managing plant water use attempt to assess the water status of the plant by monitoring soil moisture or environmental demand. The reliance on such approaches reflects the fact that it has generally proved to be rather difficult to directly monitor the water status of the plant in an efficient and cost-effective manner. The theory and engineering used for monitoring soil moisture and environmental demand (evapotranspiration) are quite advanced particularly with respect to automated use, and have proven to be adequate for a number of applications (Jones, 2007; Kirkham, 2004; Mullins, 2001). In spite of the advanced state of these methods, they have not been as widely adopted by end-users. Irrigation management based on direct measurement of plant water status has been investigated (Jones 2004).There are theoretical advantages to the direct measurement of plant water status as a tool for the management of plant water use. In general, the more direct the link between the measured indicator and the object of manipulation, the more relevant and predictable the response will be. Plant transpiration can be measured by monitoring stem-flow or gas exchange (Lascano, et al., 1992; Trambouze and Voltz, 2001; Jones, 2004; Stockle and Dugas, 1992). These approaches can be automated and can provide continuous measurements over seasonal timescales however they are not always compatible with a wide range of plants and often are difficult to implement in production settings. Measurement of plant water content via relative water content or leaf water potential is relatively simple, though these methods have not proven to be amenable to automation or continuous measurement by end users. The relationship between plant water use and the temperature of the transpiring leaves is, in many aspects, well characterized and plant canopy temperature has been used to monitor plant water status for many years. One of the primary obstacles to the wide use of plant temperature to characterize plant water status has been the relative difficulty in measuring plant temperature in the field. The utility of infrared thermometers (IRTs) for the measurement of canopy temperature was recognized in the 1970 s and rapid advances in understanding the relationships between plant water status and canopy 2
3 temperature resulted (Wanjura and Mahan, 1994; Pinter et al., 2003; Peters and Evett, 2004). While IRTs have been shown to be useful in field scale studies, the relatively high cost and complexity of the early devices often limited the number that could be used in studies. In addition to the issues relating to the IRT hardware, the interpretation of the canopy temperature data is sometimes complex. Most efforts to utilize canopy temperature as an indicator of plant water status are based on assessing the plant temperature relative to a measured or modeled value of the temperature of a well-watered standard (Pinter et al., 2003). This approach results in estimates of water status based on comparison to a constantly variable temperature (air temperature or a calculated reference temperature). These temperature differences have been used to assess the water status of the crop. However, in spite of the proven utility of these approaches, they have not been widely adopted in production settings. Over the past 20 years researchers with the USDA/ARS have developed BIOTIC, a method for assessing the water status of the plant by comparing canopy temperature to an estimate of the plant s optimal temperature that is based on the measured thermal dependence of metabolic functions. In the BIOTIC method, the optimal temperature value, which is a fixed characteristic of the plant species, is termed the temperature threshold. The inclusion of an environmentally based time threshold accommodates irrigation intervals greater than one day. This method differs from previous approaches in that it uses optimal canopy temperature as an indicator of metabolic and water status optimality. The BIOTIC protocol has proven to be successful in both high-frequency high-efficiency (e.g. drip) and lower-frequency lower-efficiency (e.g. sprinkler) irrigation systems. The BIOTIC protocol has been used to schedule irrigation with irrigation intervals ranging from 15 minutes to 7 days. While the level of control and optimality of the irrigation is reduced as the time between irrigations increases, the method does produce results that are comparable with soil moisture and evaporation/transpiration based methods on similar irrigation systems (Wanjura and Mahan, 1994; Wanjura et al., 1995; Mahan et al., 2005). Though the theory of using canopy temperature as a tool for assessing plant water status is well developed, the measurement of canopy temperature under field conditions remained relatively expensive and time consuming. During the development of the BIOTIC protocol, the cost of IRT sensors declined significantly. In the initial phase, wired IRTs with a cost of ~$3,000/sensor were used. In the mid-1990 s these sensors were replaced with thermocouple IRTs with a cost of ~$400/sensor. The need for wiring to connect IRTs to data loggers remained a significant impediment to the use of the IRTs in production settings. Wires and instruments placed in a field proved to be a constant source of aggravation for end users. Since many decisions in production settings will be viewed in terms of cost/benefit ratios, whenever unnecessary complexity can be eliminated adoption of the technology becomes more favorable. It thus became evident that even the best theoretical approach would be of limited value unless the 3

4 theory was presented in a package of hardware and software that is compatible with the production setting in which it is to be implemented. Figure 1. Infrared thermometers for canopy temperature measurement. The challenges of continuous measurement of canopy temperature in research and production agriculture settings led us to develop a relatively low cost wireless infrared thermometry system. The system utilizes an infrared sensor that is approximately 1/10th the cost of infrared thermocouple sensors commonly used in agricultural settings (Figure 1). This low-cost sensor is capable of season-long measurements of canopy temperature that are comparable with those obtained with more expensive sensors (Mahan and Yeater, 2008). The low-cost IRT sensor has been incorporated into a remote sensor that monitors temperature on a short interval (60 seconds), collects the data for 15 minutes and then transmits the data (typically a 15 minute average) to a base station. The remote sensors are powered by a set of 4 AAA batteries that can power the units for approximately 90 days. The base stations used in this study are capable of monitoring up to 16 remote sensors. The remote sensor and the base station can effectively communicate at a range of 300m under most field conditions. Data collected by the base station can be manually downloaded to a computer or, more typically, a cell modem transfers the data at a set interval (typically 2 hours) to a website for archiving and graphical presentation. 4
5 Figure 2. Low-cost wireless infrared thermometry system for research/production use. The performance of the system has been recently reported (Mahan et al., 2010). The wireless IRT system has now been used to monitor canopy temperatures at dozens of field sites over the past 2 years involving more than 100 remote sensors and 10 base units. The data collected by the remote sensors is generally high quality with no significant drift over time. The IR sensors have been demonstrated to produce data of equal quality to more commonly used infrared thermometers that can be significantly more expensive (5X to 10X). This wireless IRT system (figure 2) is currently available commercially from Smartfield (Smartfield.com). The combination of the wireless data transmission and the reduced cost temperature sensor should allow researchers and producers to deploy a larger number of temperature measuring devices in a simpler installation and at a lower cost than has been previously possible. It is hoped that this technology will help to make seasonal measurement of canopy temperatures a more routine part of plant stress studies. At present, utility of the BIOTIC approach for full irrigation is well-documented (Wanjura and Mahan, 1994; Wanjura et al., 1995; Mahan et al., 2005) and the protocol has been 5
6 commercialized. While BIOTIC (and other irrigation approaches) are often capable of providing irrigation management particularly under conditions that require full irrigation, there is a growing need for irrigation management tools that are designed to provide for the imposition of controlled water deficits. The need to reduce water application can have many sources including; declining water resources, increasing water costs, governmental regulation and drought resistant germplasm. Regardless of the circumstance necessitating the reduction in irrigation, an ability to establish and maintain plant water status at desired levels offers the promise of a new approach to water management and plant production. Deficit irrigation has been a common practice in crop production for many years in many regions. Most often deficit irrigation is a strategy that is thrust upon producers as opposed to an approach that is voluntarily adopted for a specific purpose. Given that most irrigators are happy to accept additional water (as rain or irrigation) whenever it is available the idea of deliberate, managed deficit irrigation will be a hard sell. The largest advantage to full irrigation is that at the upper end of the irrigation regime (in terms of yield and applied water), yield becomes relatively less sensitive to variation in water application than it is on the lower end of the curve where yield and water application are almost linearly related. When a producer makes the decision (voluntarily or under duress) to move away from full irrigation to a managed deficit, the ability to control that deficit becomes critical. To move too far in the direction of deficits raises the risk of incurring a larger than anticipated yield reduction while the application of irrigation above that intended will result in no reduction in water use. While it is clearly possible, and in some cases no doubt advantageous, to reduce irrigation amounts in a controlled manner, many of the approaches that could be used to accomplish this are perhaps not fully compatible with crop production settings. We propose that canopy temperature will provide a useful and practical approach for establishing and controlling desired water deficits in production settings. The ability to modify the BIOTIC approach to deficit irrigation management is attractive from the point of view that the theory and instrumentation that has been previously developed should be adaptable to deficit irrigation. During the development of the BIOTIC concept, the sensitivity of the irrigation scheduling with respect to temperature and time thresholds was investigated over several years. These studies demonstrated that optimal water application and plant performance were associated with specific combinations of temperature and time thresholds. It was demonstrated that as the temperature threshold was altered to include values below and above the biologically-identified optimal value the amount of irrigation water applied declined with increasing temperature thresholds. The canopy temperature of the crop increased generally with declining water application and the period of time that canopy temperature was optimal. Similarly, increasing the time threshold for irrigation events resulted in increases in stressful canopy temperatures as well as declines in the amount of water applied. Thus it was established that certain combinations of temperature and time thresholds resulted in what was considered to be optimal water management and others resulted in less than optimal water with respect to yield. While the previous studies used non-optimal 6
7 threshold combinations to demonstrate the optimality of the correct settings, they also demonstrated the potential for the use of non-optimal threshold pairings to manipulate the water status of the crop outside the range of optimality. The goal of this study was to investigate the utility of a modified BIOTIC approach for the detection of differences in canopy temperature resulting from various deficit irrigation regimes in cotton and sorghum. Three questions were posed in this study. 1) Is the low cost wireless IRT system reliable and accurate enough to detect seasonal patterns of water deficit in terms of canopy temperature? 2) Can irrigation regimes be identified from seasonal canopy temperature patterns? 3) Do canopy temperature patterns differ between short interval drip and long interval pivot irrigation systems? Materials and Methods It should be noted that the objective of this study was to assess the use of the wireless IRT system to detect and assess canopy temperature differences. It was not a physiological study of plant water stress but rather an effort to identify and analyze the changes in seasonal canopy temperature that were associated with different irrigation approaches. Cotton and sorghum, two crops commonly grown in the southern high plains region of Texas, were chosen for this study. Both crops are responsive to irrigation over a relatively wide range and are particularly amenable to deficit irrigation approaches. Crops were grown on a production farm near Plainview, TX (2008 and 2009) and on a USDA/ARS research facility in Lubbock, TX. (2008). Cotton was grown at both the Lubbock and Plainview sites and sorghum was grown only at the Plainview site. At the Lubbock site, cotton was irrigated with a subsurface drip irrigation system. Irrigation was scheduled with a BIOTIC irrigation approach designed to apply a full irrigation regime. Under the full irrigation regime, 6mm of water was applied in response to each irrigation signal. Reduced irrigation treatments consisted of applications of 4mm and 2mm in response to each irrigation signal in the full irrigation treatment. A rainfed treatment that received only rainfall was included. Irrigation at the Plainview site was designed to provide irrigation amounts of 85%, 65%, and 50% of ET as estimated by the producer. The irrigation amounts were established by the producer in a production field to gauge the potential for water savings in the crops. It is important to note that these are the target amounts set by the producer based on his knowledge of the irrigation and cropping system and do not represent research-based values. The irrigation amounts were produced by installing specific sprinkler nozzles at various points along the pivot. The pivot was operated in a 5-day cycle. 7
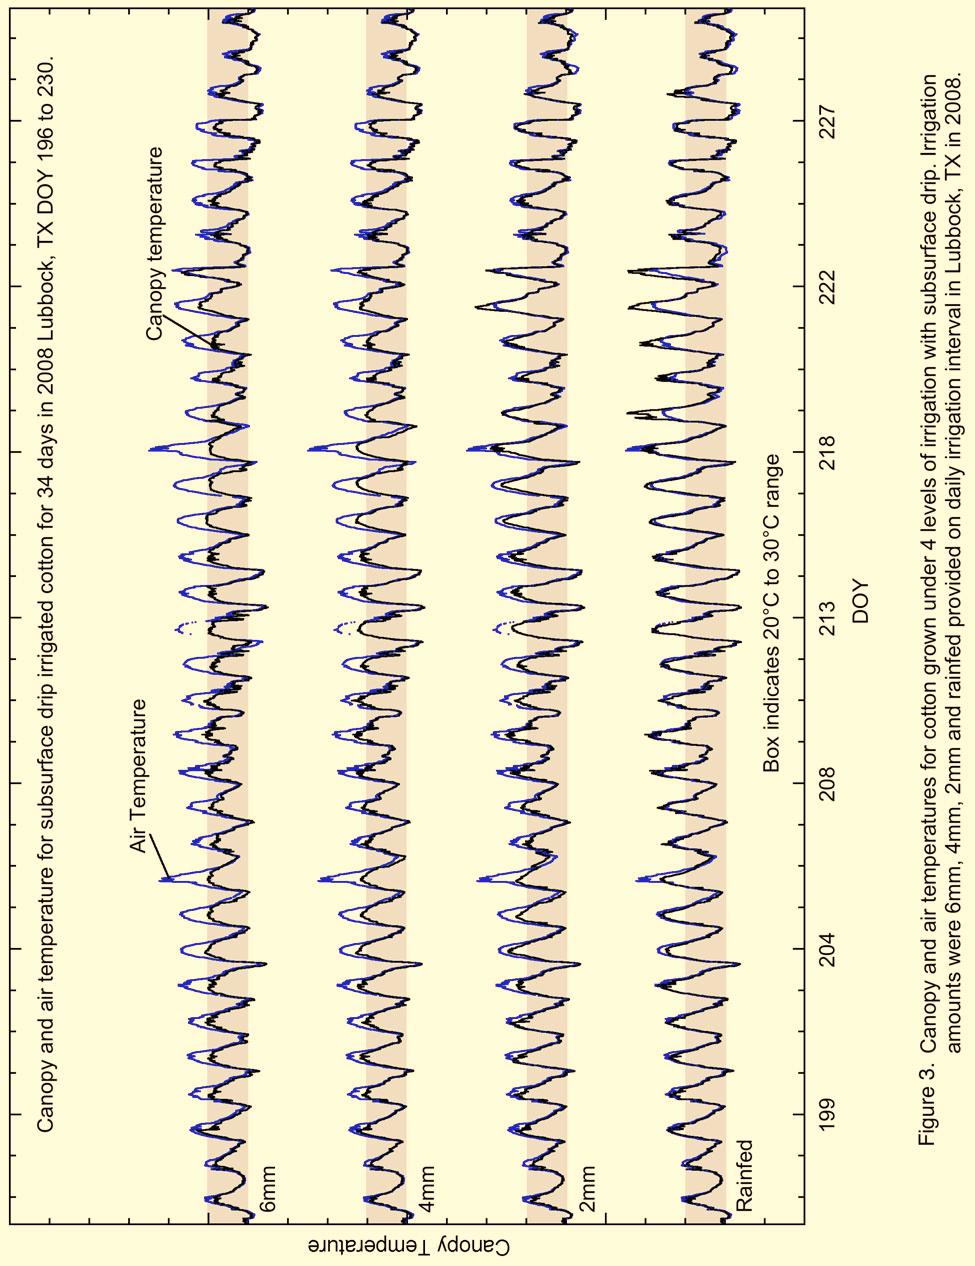
8 Canopy temperature was monitored in Lubbock cotton over a 34-day period from July 14 to August 17 (DOY 196 to DOY 230). During this interval the cotton canopy was uniform and background soil was not routinely observed. Canopy temperature of cotton in Plainview was monitored over a 93-day period from July 7 to October 18 (DOY 188 to DOY 281) in Canopy temperature of cotton and sorghum was monitored over a 78-day period from June 25 to September 11 (DOY 176 to DOY 254) in Some bare soil background was observed in the first 2 weeks of the monitoring interval in Temperature measurements were initiated when the seedlings had emerged and sufficient leaf area was present to fill the field of view with the remote sensors placed ~10 cm from the canopy. The height of the sensors was adjusted weekly to maintain a distance of 10 cm to 20 cm from the canopy. The field of view of the remote sensors is specified as 1:1 by the manufacturer and the diameter of the spot size of the measurement varied from 10 cm to 20 cm. Canopy temperature was monitored once per minute and 15 minute averages were collected. This provided 96 measurements per day for the duration of the study. Results and Discussion Low cost wireless infrared thermometry systems, such as the one previously described, have the potential to make it easier and cheaper to monitor canopy temperatures on seasonal scales in research and production settings. Season-long monitoring of canopy temperatures at 15-minute time intervals can provide relatively detailed information about the magnitude of thermal variation, the temporal pattern of variation and the spatial variation in temperature. The deployment of multiple sensors with fully automated data management allows for the collection of datasets with thousands of observations. Given the magnitude of the data that can be collected, a graphic visualization approach is perhaps the most useful means to initially explore the relationships between canopy temperature and the water and metabolic status of the crop. Perhaps the most common approach to visualization of canopy temperature involves graphical presentation of the canopy and air temperature as a function of time (figure 3). While such a graphic is easy to produce, its most dominant visual feature is the diurnal trend of temperature (reminiscent of a sine wave) that serves to mask water-related temperature variation. Thus the utility of such a presentation of the data for assessing crop water status is limited in two respects; 1) the diurnal variation becomes the dominant pattern even though, at least 50% of the data presented (night data) is not directly indicative of the water status of the crop and 2) there is no indication of the metabolic ramifications of specific temperatures. 8
9 9
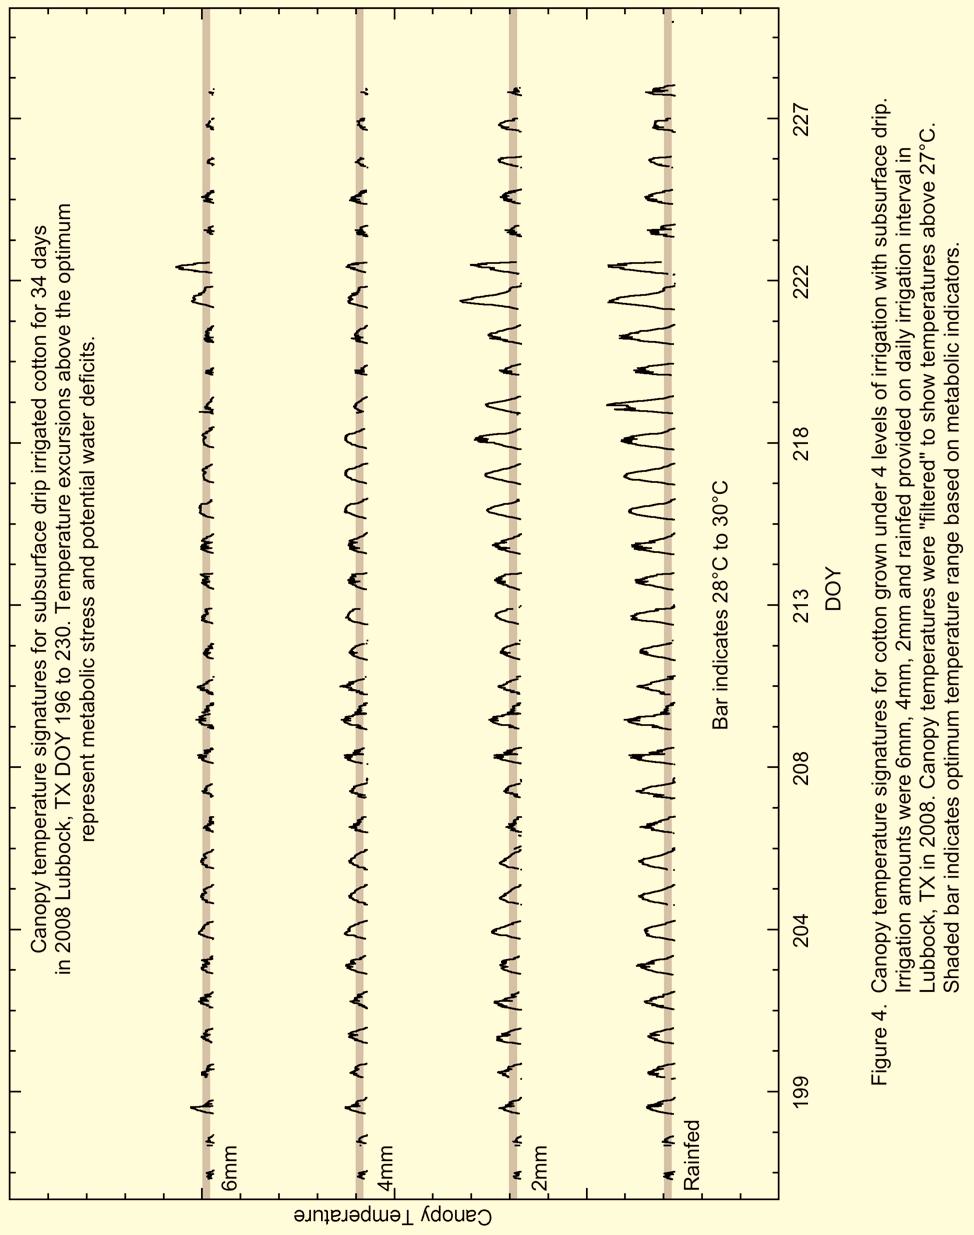
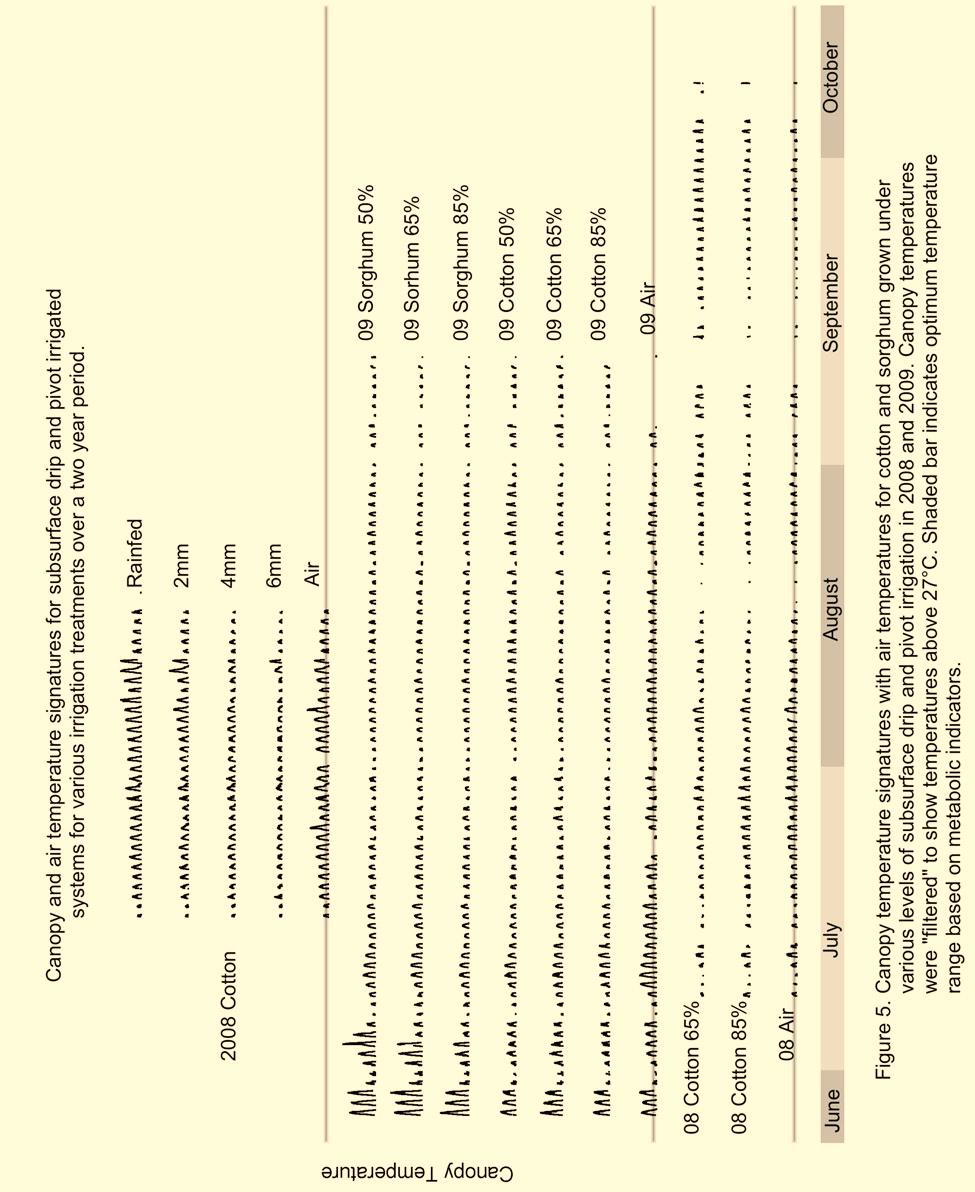
10 With respect to the diurnal temperature pattern that includes a large amount of data that is not directly indicative of water status, it is a simple matter to reduce the dataset by excluding night temperatures. The removal of night data serves to break the diurnal pattern making it easier to focus on the water-related temperature variation. While eliminating temperatures that do not relate to water status reduces the visual clutter on the graph, it does not convey information on the potential effect of specific temperatures on the metabolism of the plant. The metabolic ramifications of the thermal variation can be incorporated into the analysis by comparing the canopy temperatures to a base temperature that is based on a metabolic indicator. According to the BIOTIC protocol, canopy temperatures in excess of the biological optimum are a useful indicator of water deficits in crop plants. In figure 4, canopy temperatures have been filtered to remove values that are below 27 C which is 1 C less than the 28 C BIOTIC temperature optimal for cotton. Temperature scale is indicated by a shaded bar with a range from 28 C to 30 C and temperatures above the optimal temperature bar indicate potential metabolic stress. Applying these modifications to a graphic presentation of canopy temperatures reduces the amount of data that is displayed by ~50% which enhances the viewers ability to see the relationships between canopy temperatures and water deficits and metabolic stress. The numerical axes have been removed and replaced with a shaded bar that indicates both the temperature scale and optimal thermal range and the figure has been annotated to provide information that is needed for comparisons. When filtered with regard to optimal temperatures and those that could be associated with water deficits, the pattern of canopy temperature provides a view of the magnitude of stresses and the temporal pattern of the stresses. We refer to these filtered multi-day temperature patterns as temperature signatures for the periods of interest. Since a large number of temperature signatures can be arranged on a single page, the arrangement of small multiples allows rapid visual comparisons of relationships among crops, water treatments, irrigation systems and years. It is proposed that canopy temperature signatures provide a useful method for analyzing seasonal thermal patterns in terms of differences and similarities among environments and irrigation treatments. Figure 5 shows the canopy temperature signatures of this irrigation management study involving multiple irrigation treatments in drip and pivot irrigation systems on cotton and sorghum over 2 years at 2 locations. In addition to the canopy temperatures, the air temperature over the measurement period at each site is indicated. Each of the treatments in the study is discussed below using the canopy temperature signatures as a guide for inspection. 10
11 11
12 12
13 2008 Cotton (research drip) During the 34-day measurement interval the temperature signatures differed across all 4 irrigation treatments. There is an evident trend of increasing canopy temperature as irrigation amount declined from 6mm/day to rainfed Cotton (production pivot) During the 93-day measurement interval in 2008 the 85% and 65% canopy temperature signatures were generally similar with treatment differences apparent during only 3 periods. The first period occurred in late July canopy temperatures in the 85% treatment were elevated slightly compared to the 65% treatment. The second period included four days in the beginning of September and the third period was 23 days in late September and early October when the canopy temperatures in the 65% treatment were warmer than in the 85%. Yield differences between the treatments were negligible indicating that significant water deficits did not develop as evidenced by the canopy temperature signatures for the treatments Cotton (production pivot) During the 78-day measurement interval in 2009 the 85% and 65% canopy temperature signatures are generally similar. A pattern that is similar to that seen in a similar irrigation treatment in the 2008 season. The canopy temperature signature of the 50% treatment was similar to that of the 85% and 65% treatments with the exception of the elevated temperatures during the end of June and early July (possibly a soil background anomaly). While final yields are not yet available for the treatments, indications are that the 85% and 65% will be very similar with a slight reduction in the 50% Sorghum (production pivot) During the 78-day measurement interval in 2009 the 85% and 65% canopy temperature signatures are generally similar. (essentially the same result as seen in the 2009 Cotton treatments). The canopy temperature signature of the 50% treatment was warmer than the 85% and 65% treatments during a 12-day period in late August. Once again while final yield data is not yet available, the perception of the farmer is that the yield differences are minimal Subsurface drip and pivot irrigation systems were used in this study. The subsurface drip system applied 6mm or less of water on a daily interval while the pivot system applied approximately 25 mm of water on a 5-day interval. The subsurface drip treatments were applied in a research setting and were precisely measured. The pivot system was in a production field and the irrigation regime, while not quantitatively rigorous, represents the upper echelon of production pivot irrigation management in the southern high plains of Texas. In the subsurface drip treatments, the different irrigation regimes were readily apparent in the canopy temperature signatures with all 4 irrigation treatments evident in the canopy temperatures over the entire measurement period. Since daily irrigation amounts were similar to daily potential ET for the crop, the amount of water applied was sufficient only to meet the needs of the crop on a daily time scale. Thus canopy 13
14 temperature signatures would be expected to be sensitive to plant water status on the daily time scale. In the pivot irrigation system, the canopy temperature signatures were surprisingly similar across the irrigation treatments in the various years and crops. The lack of clear and systemic differences in canopy temperature signatures could be interpreted in two ways. Interpretation #1 is that the irrigation treatments imposed levels of water stress over the season that were in line with the intended water applications and that the canopy temperature measurements did not reflect the varying water status of the crop. Interpretation #2 is that, while the water applications did vary relative to one another, the PET estimates that were used to establish the treatment were incorrect and resulted in a range of irrigation amounts that did not represent significant deficits. For instance, if the 85% treatment was really closer to 100% then the 65% and 50% treatments may have actually applied 76% and 60% respectively. While interpretation #1 cannot be eliminated at this point in time, the pattern of canopy temperature signatures in the subsurface drip system suggests that water differences of the magnitude intended in the pivot studies could be detected with the IRT system used in the studies. Additionally, the absence of significant differences in yield and plant performance among pivot irrigation treatments suggests that water deficits under the pivot were not of the expected magnitude. If indeed interpretation #2 is correct, this would serve to underscore the difficulties inherent in deficit irrigation management in production systems and perhaps indicate the utility of canopy temperature signatures in the post-hoc interpretation of deficit irrigation results. Conclusions It is well established that measurement of canopy temperature is a potentially useful tool for the detection of water deficits in a wide variety of plants for a variety of end uses. Biologically-based estimates of optimal plant temperature may provide a useful approach to assessing the impact of temperature variation on a mechanistic level. Biologically-based temperature optima coupled with continuous measurements of canopy temperature provide a means of identifying and quantifying water-related elevations in canopy temperature. The recent development of a relatively low-cost wireless infrared thermometry system has greatly simplified the process of continuously monitoring plant canopy temperature on seasonal time scales in both research and production environments. It is hoped that such devices will serve to make canopy temperature measurement a routine undertaking in research and production settings. Canopy temperature signatures based on optimal temperature estimates provide a method for visualizing and inspecting seasonal patterns of canopy temperature. Initial 14
15 efforts indicate that canopy temperature signatures can be used to identify and quantify water deficits in subsurface drip and pivot irrigation systems. References Jones, H.G Irrigation scheduling: advantages and pitfalls of plant-based methods. J. Exp. Bot. 55(407): Lascano, R.J., R.L. Baumhardt, and W.N. Lipe Measurement of water flow in young grapevines using the stem heat balance method. Am. J. Enol Vitic. 43(2): Mahan, J.R., J.J. Burke, D.F. Wanjura, and D.R. Upchurch Determination of temperature and time thresholds for BIOTIC irrigation of peanut on the Southern High Plains of Texas. Irrig. Sci. 23(4): Mahan, J.R. and K.M. Yeater Agricultural applications of a low-cost infrared thermometer. Comput. Electron. Agric. 64(2): Mahan, J.R., W. Conaty, J. Neilsen P. Payton, and S.B. Cox Field performance in agricultural settings of a wireless temperature monitoring system based on a lowcost infrared sensor. Comput. Electron. Agric. (in press) Peters, R.T., and S.R. Evett Modeling diurnal canopy temperature dynamics using one-time-of-day measurements and a reference temperature curve. Agron. J. 96: Pinter, P.J., J.L. Hatfield, J.S. Schepers, E.M. Barnes, M.S. Moran, C.S.T. Daughtry, and D.R. Upchurch Remote sensing for crop management. Photogramm. Eng. Remote Sens. 69(6): W. Trambouze and M. Voltz Measurement and modelling of the transpiration of a Mediterranean vineyard. Agric. For. Meteorol. 107(2): Wanjura, D.F., and J.R. Mahan Thermal environment of cotton irrigated using canopy temperature. Irrig. Sci. 14: Wanjura, D.F., D.R. Upchurch, and J.R. Mahan Control of irrigation scheduling using temperature-time thresholds. Trans. ASAE 38: