May Sensitivity Analysis and Interpretation of Model Results
|
|
|
- Georgina Griffith
- 5 years ago
- Views:
Transcription
1 Joint ICTP- College on Identification and Assessment of Nationally Appropriate Mitigation Actions (NAMAs) in Energy System Development to Help Combat Climate Change 5-9 May 2014 Sensitivity Analysis and Interpretation of Model Results H-Holger Rogner International Institute for Applied Systems Analysis (IIASA) Royal Institute of Technology (KTH) Stockholm
2 Sensitivity Analysis and Interpretation of Model Results H-Holger Rogner International Institute for Applied Systems Analysis (IIASA) Royal Institute of Technology (KTH), Stockholm ICTP, 5 9 April 2014
 hydro thermal power oil nuclear generating photovoltaic wind station plant refinery station cell converter")

3 Architecture of the Energy System Sources Extraction Treatment coal oil natural gas sunlight uranium wind biomass coal hydro oil cleaning separation benefication liquef- gasifimine dam rig action cation What nature Provides Conversion Technologies Currencies (fuels) hydro thermal power oil nuclear generating photovoltaic wind station plant refinery station cell converter electricity gasoline methanol methane hydrogen heat Energy Sector Distribution electricity grid gas grid truck dewar railway district heat grid Service Technologies automobile light telephone furnace microwave bulb oven aircraft PC Efficiency & Infrastructure Services transportation communication keeping warm/cold food potable water health care security consumer goods What people want
4 Different levels in energy planning Technologies Electric System Energy Sector Energy System 3

5 Sensitivity analysis: How stable is your solution?
6 Why sensitivity analysis Uncertainty in inputs and assumptions due to Lack of information Unknown or rather unknowable future Previously plausible assumptions no longer hold Testing different boundaries or resolution of detail Dynamic vs linear behavior 5/13
7 Electricity demand load curve (2009) Actual Modeled MW
8 Why sensitivity analysis Explore what if questions Protect against surprise Detect methodological shortcomings Appreciate uncertainty and develop a better understanding for it
9 Modeling energy systems Model design Typical questions faced by energy analysts and planners: What is the cost-optimal energy mix that meets demand by 2030? What is the impact of escalating fossil fuel prices? What are the environmental impacts? How does the cost-optimal energy mix change with more stringent environmental regulation? What will be the consequence of market restructuring? What needs to be done to increase the share of cleaner technologies? What will be consequences of introducing or phasing out nuclear power?
10 Sensitivity Analysis Future demand for energy Investment costs of new power plants and other energy facilities Operation and maintenance costs Fuel cost Performance of technologies (efficiency, plant factor, availability factor, etc.) Limits on production and construction of plants Import/export quantities and prices Environmental protection limits and costs 9/13
11 Sensitivity analysis Parametric sensitivity analysis Assess robustness of a solution to changing assumptions (of parameters and constraints) Assess which parameters are most sensitive to even small variation Usually one parameter is varied everything else is kept constant
12 Scenario analysis Assess robustness of a solution to distinctly different sets of assumptions on parameters and constraints Note: Emphasis on internally consistency Assessment of different futures However the primary purpose of scenario formulation is to address What if type of policy question to assess implications of introducing policies by comparative assessment of scenarios
13 Scenario analysis Parametric sensitivity analysis Assess robustness of a solution to changing assumptions (of parameters and constraints) Assess which parameters are most sensitive to even small variation Usually one parameter is varied everything else is kept constant
14 Sensitivity analysis with MESSAGE min c * x Subject to A * x b u x l result x * range for c, b, l, u
15 Notes on the sensitivity screen Parameters change in the original problem while the optimal basis remains the same Objective coefficient Constraint bound Variable bound Basis remains the same means that no other element comes into the solution, i.e. no other variable or equation reaches its upper or lower limit Important! Variations assume that all other parameter remain fixed except the one in question 14/13
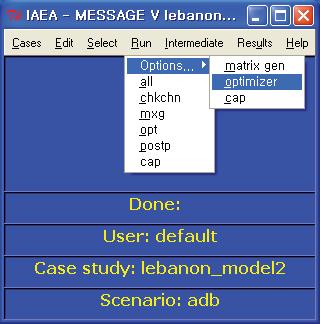
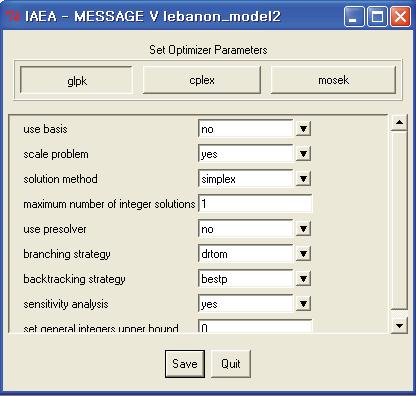
16 Sensitivity in MESSAGE Solver 1 2 3

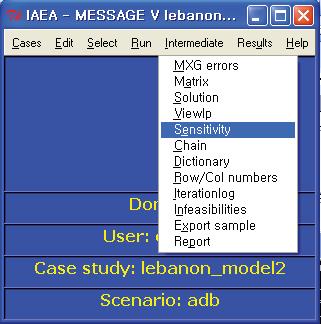
17 Sensitivity Output Screen
18 Shadow Prices Are important so see how expensive restrictions are At the upper limit: how much would the objective function value decrease if the limit would increased by one unit At the lower limit: how much would the objective function value decrease if the limit would decreased by one unit

19 Shadow prices in the solution In interactive results screen

20 Shadow Price for Electricity 19/13
21 Which studies to conduct? Number of sensitivity studies should be kept as reduced as possible Too many sensitivity studies reduce credibility of the study and confuses interpretation of results: negative perception by decision maker Too few sensitivity studies may lead to many questions left open to the decision maker (What if?) Studies should concentrate in a few important parameters to analyse range of validity of the optimal solution (How robust the solution is?)
22 Comparative assessment of options Investments Fuel costs Waste/ decom Reliability Secutiy Environment Material Acceptance Wind 1, low high very good very high high Coal (domestic fuel) 1, base load / intermediate very high low high low - high Nuclear 3, ,000 base load high very good high low Gas turbine (imp fuel) peak low medium low high Hydro 2, seasonal high good high medium End-use efficiency How to compare these alternatives? How to combine these criteria? How to interpret the results? very high excellent low mixed
23 Multi-criteria decision making Social Scenario results Criteria selection Multi scenario Tradeoff analysis Alternatives selection Economic Environmental Criteria weights Groupings C A D R E P F Scenario ranking 1 2. B Q Y Performance matrix Grouping C1 C2 C3 C4 C5 C6 C7 C8 A B C D E Z