Shaping Private Development/ Growth Management
|
|
|
- Homer Richards
- 5 years ago
- Views:
Transcription
1 Shaping Private Development/ Growth Management What are the social consequences of sprawl? Can private development be controlled to manage growth on the regional scale? What is gained by trying to manage design and development at the level of the region? What are the challenges?

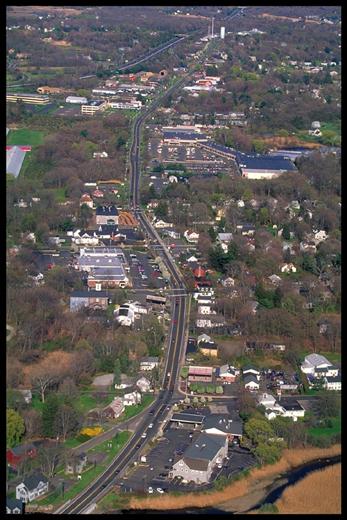
2 Low-density development on the edge of cities and towns, poorly planned, landconsumptive, autodependent, and designed without respect to its surroundings. What is Sprawl? Richard Moe, National Trust for Historic Preservation

3 Why Should We Care? The 1990 Census showed the 9 most rapidly growing places during the 1980s where suburbs (LA 5, Dallas/Ft Worth 2, San Diego 1, Phoenix 1) New England is not immune to growth and sprawl
4 Massachusetts Growing Pains Proportion of Massachusetts defined as developed in 1996: 25% Same figure projected for 2010: 33% From 1950 to 1990, population grew by 28% but developed land increased by 188% (suburban growth and sprawl) From metro Boston population grew 4.7% but developed land grew 23.1% - 3 times national average In S.E. Mass, developed land growing 4.1% year to support growing population of 1.6 % per year.
5 Massachusetts Growing Pains Average Greater Boston resident wastes 136 hours a year stuck in traffic jams principally in the suburbs. Nationally, from 1990 to 1996, the average time members of a family spent in a car grew 22%.» Boston Globe 1/31/99
6 New England Snapshot: Why Should We Care? In the Boston metro area: Mass. Dept. of Environmental Protection projects that NOx* levels will begin rising again over the next five years as a result of increasing vehicle miles traveled. 53% of rivers fail to meet state water quality standards. That number will rise during the next five years, according to DEP projections. More children and seniors suffer from environmentally linked diseases than 10 years ago Boston rental vacancy rate: 1% Change in number of homeless families, :+15% In 2001 in the communities of eastern Massachusetts home to nearly 2/3 of the state s residents a family earning the median income could not afford a house at the median price.
7 New England Snapshot: Why Should We Care? From 1950 to 1990: Change in employment around Route 128: +300% Change in older, core communities: -10% We have exported our economy to the suburbs: Boston share of Class A office space in 1980: greater than 60% Boston share of Class A office space in 2000: less than 40% We re paving over our heritage Increase in population, metro Boston, : +2% Increase in annual vehicle miles driven: +75% We re straining our social fabric In the Boston metro area: Proportion of poor children living in cities: 80+% Number of low-skill workers in the core in 2000 competing for 10,000 available jobs: 60,000
8 Smart Growth: What is intelligent land use? access to public transportation; use of existing infrastructure; conservation of resources; infill and brownfield development; pedestrian-friendly developments; and mixed, compact, and adaptive uses.» Urban Land Institute
9 How Growth is Controlled Set of Anti-Sprawl Planning Strategies that involve Zoning, Design, New Standards, Transportation, Infrastructure (SRPPs): Environmental Legislation Building/Annexation Limits Infrastructure/Capital Expenditures Budgeting and Phasing (transportation access, utility infrastructure (sewer/water))
10 How Growth is Controlled Some common SRPP s include: Transfer of Development Rights Conservation Easements Environmental Mitigation/Restoration Clustering at regional and parcel level (urban growth boundaries and PUDs) Density bonuses
11 Political Economy and its Effects on Growth Control Measures Industrial capitalism and inter-urban competition Privatism (SB Warner) quest for prosperity rather than the overall betterment of the community: Cities depend on private enterprise rather than community action for prosperity City form is product of economic goals of private speculators Local politics are a function of the interests of individuals Homes as financial investments Metropolitan fragmentation and weak or nonexistent regional government
12 Growth Management Principles Foster distinctive, attractive communities with a strong sense of place
13 Planning in Action: Concord, NH Vision 20/20 City intent on controlling growth and maintaining a high quality of life Easy part was reaching consensus on goals, hard part was reaching consensus on implementation where will the growth go? Red flag issues for City of Concord, NH: Residential densities higher than current 3 or 4 DU per acre Single to multi-family housing ration approach Outlying areas accommodate more affordable housing
14 Smart Growth Principles Create a range of housing opportunities and choices


15 resident housing choices (Oct workshop) 44% 29% 5% 10% 12%

16 A 2 0 / 2 0 V I s I o n f o r C o n c o r d What is a village? Defined Core Edges Community Walkability Civic-ness Public Spaces Mixed-uses
17 Smart Growth Principles Strengthen and Direct Development Towards Existing Communities Smart growth directs development towards existing communities already served by infrastructure, seeking to utilize resources that existing neighborhoods offer, and conserve open space and irreplaceable natural resources on the urban fringe.

18 Where is the village going? Civic-ness Religious Life Workplace Shopping Housing
19
20

21 A 2 0 / 2 0 V I s I o n f o r C o n c o r d A City of Villages
22 Smart Growth Principles Preserve Open Space, Farmland, Natural Beauty and Critical Environmental Areas Open space preservation supports smart growth goals by bolstering local economies, preserving critical environmental areas, improving our communities quality of life, and guiding new growth into existing communities.
23
24 Smart Growth Principles Make Development Decisions Predictable, Fair and Cost Effective For a community to be successful in implementing smart growth, it must be embraced by the private sector.
25 Smart Growth Principles Mix Land Uses Smart growth supports the integration of mixed land uses in communities as a critical component of achieving better places to live.
26 Smart Growth Principles Provide a Variety of Transportation Choices Providing people with more choices in housing, shopping, communities, and transportation is a key aim of smart growth.
27 What Does TOD Look Like? Bus Rapid Transit (BRT) Light-rail (trolley) Heavy-rail (subway) Mini-bus network
28 Why TOD? Poor air quality and increased traffic congestion Continued low-density sprawl Changing demographics Real estate values increase near transit stations Growing support for the Smart Growth movement
29 TOD Characteristics Higher density-compact dev t Mixed-Use Development Pedestrian Friendly Design Build-to lines versus Setbacks Less parking opportunities Access to Public Transportation Encourages social interaction Ride-share programs
30 Smart Growth Principles Create Walkable Neighborhoods. Walkable communities are desirable places to live, work, learn, worship and play.

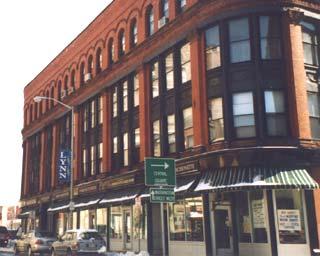
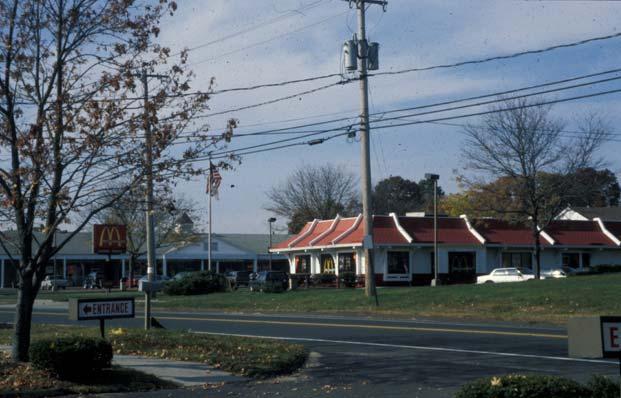
31 A 2 0 / 2 0 V I s I o n f o r C o n c o r d What kind of retail growth?

32 Smart Growth Principles

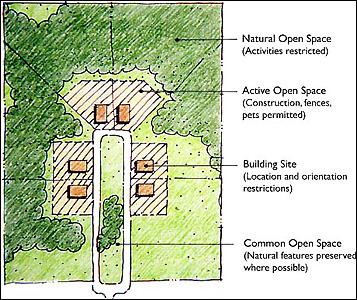
33 New Setback Standard
34 Smart Growth Principles Take Advantage of Compact Building Design Smart growth provides a means for communities to incorporate more compact building design as an alternative to conventional, land consumptive development.
35 Opponents of Growth Management Controlling people should be able to live where they want to live Taking of land down-zoning rural parcels makes them worthless Elitist the liberal few are telling everyone how to live Inflates housing prices less density (1 acre to a dwelling unit or more) translates to higher prices Exclusionary now that suburbs are developed, access will be limited for increased growth