Well Test Analysis and Estimation of Long Term Drawdown in Valley Fill Aquifer due to Pumping at the Recompleted Well NC-EWDP-4PD
|
|
|
- Eleanor Marsh
- 5 years ago
- Views:
Transcription

1 Well Test Analysis and Estimation of Long Term Drawdown in Valley Fill Aquifer due to Pumping at the Recompleted Well NC-EWDP-4PD Prepared for: Nye County Nuclear Waste Repository Project Office Prepared by: Norwest Corporation January 2012
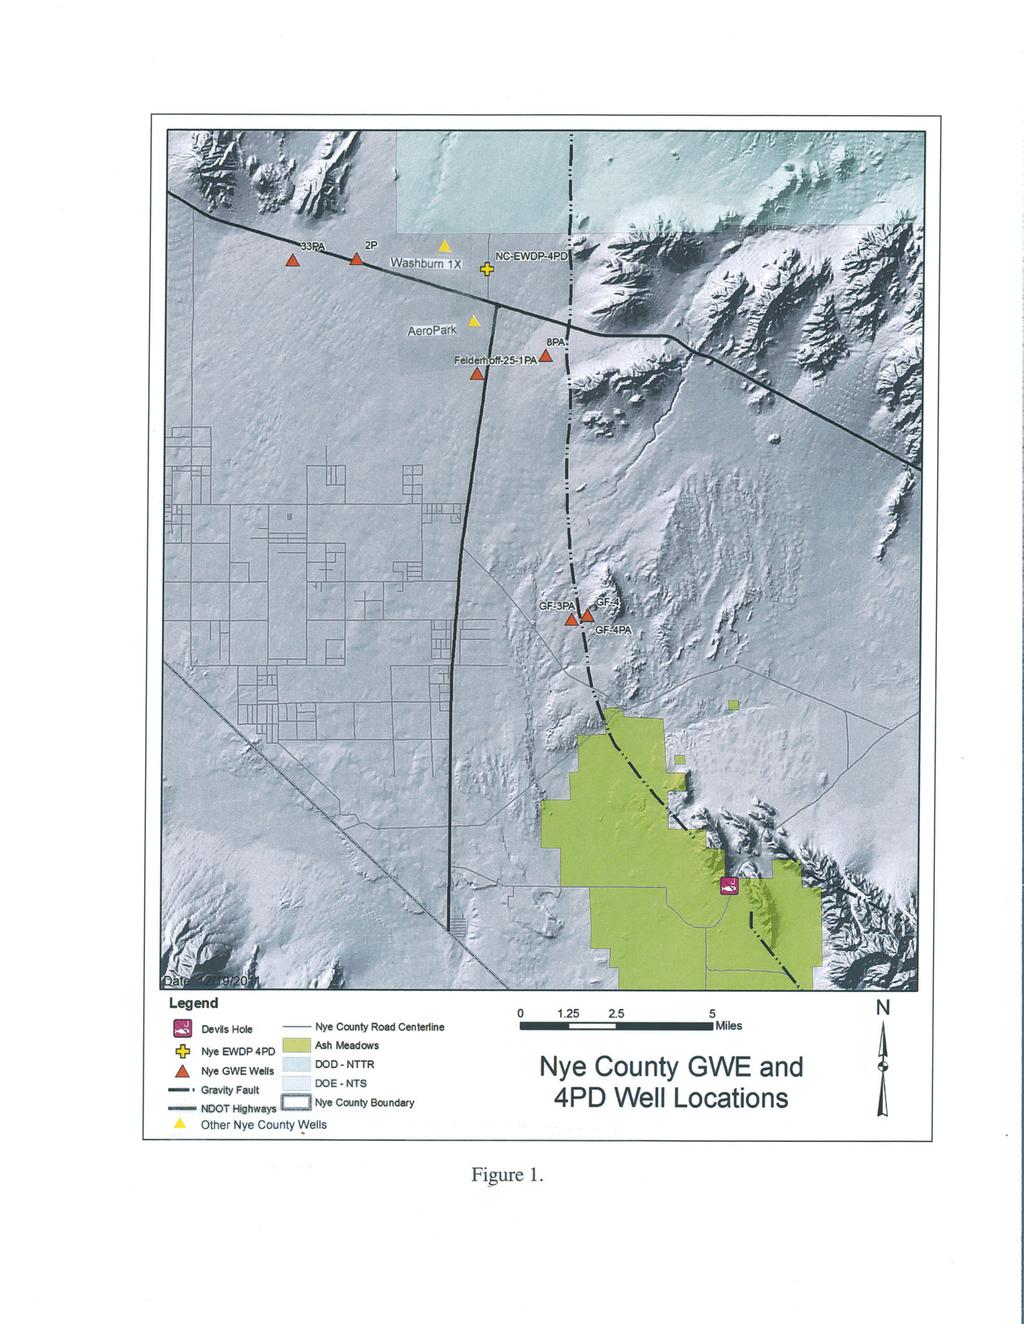
2 Introduction Nye County is proposing to use Valley Fill Aquifer (VFA) well NC-EWDP-4PD (4PD) to supply water for its Amargosa Valley Science and Technology Park (AVSTP), located at Lathrop Wells, Nevada. The County is currently changing the point of diversion for an 80 acre-feet/year water right from a converted monitoring well at the AVSTP to 4PD. Analyses of pumping test results and water level measurements taken from monitoring wells between 4PD and Devil s Hole during a recent well test were used to estimate potential drawdown in the VFA from pumping well 4PD. Well locations are shown on Figure 1. Background Nye County well NC-EWDP-4PD (4PD) was drilled during Phase IV of the Nye County Early Warning Drilling Program (EWDP) in July The well was completed as a multiple screen monitoring well. Short term packer testing of individual screened zones was conducted in 2009, and a long-term (4 weeks) pumping test was conducted in 2010 with a packer set to isolate the screens in Zones 1 and 2 from the lower screened zones in the well. Water was produced from Zones 1 and 2 during the long term pumping test. Well 4PD has since been recompleted by plugging back the lower screened intervals so that only the screens in Zones 1 and 2 are open for water production. A three day pumping test was conducted on the recompleted well in December Water levels were monitored in 4PD and in nearby Nye County VFA wells (4PA, 4PB, Washburn 1X, 5SB, STP-2 and AeroPark) during the recent test. Well completion information is shown in Table 1, and completion diagrams are contained in Appendix A. Table 1. Well Completion Information. Well Screened Interval (ft, BGS) Equivalent 4PD Zone 4PD ; Zone 1; Zone 2 4PA between Zone 1 and Zone 2 4PB Below Zone 2 Washburn 1X Deep between Zone 1 and Zone 2 5SB Zone 1 STP ; ; Zone 2 and below AeroPark Above Zone 1 to below Zone 2 Well Testing A long term pumping test was conducted starting August 30, 2010 and continuing through September 24, 2010 with a packer set in the well to isolate pumping from Zones 1 and 2. Datalogging pressure transducers were set in 4PD and nearby EWDP
3 monitoring wells 4PA and 4PB. Manual water level measurements were taken in EWDP well Washburn 1X during the long term test. Figure 2 shows water levels in 4PD, 4PA, and 4PB during the pumping and recovery periods. Figure 3 shows water levels in Washburn 1x compared with barometric pressure from the near by Desert Research Institute (DRI) Community Environmental Monitoring Program (CEMP) Amargosa Valley Station over the pumping and recovery period of the 4PD long term test. Well 4PD was subsequently recompleted by plugging back the lower intervals below Zone 2. A three day pumping test was conducted on the recompleted well during period from December 19 to December 22, Datalogging pressure transducers were set in 4PD, nearby EWDP monitoring well 4PB, and AeroPark during the entire pumping and recovery period. Manual water level measurements were taken in wells 4PA, Washburn 1X, STP-2 and 5SB during the three day test. In addition, continuous water level measurements were collected in Washburn 1X and AeroPark during the recovery period with datalogging pressure transducers. Figures 4 6 show drawdown and recovery in 4PD, 4PA, and 4PB. Figure 7 through 10 show water levels in Washburn 1X, AeroPark, 5SB, and STP-2 during the pumping and recovery periods compared with barometric pressure from the DRI CEMP Amargosa Valley Station. The water levels and barometric pressure data for Washburn 1X, the AeroPark, 5SB, and STP-2 well show that these wells were not affected by pumping well 4PD during the long term test and/or the December 2011 test. Although a study of the barometric efficiency of wells completed in the Valley Fill Aquifer is beyond the scope of this report, Figure 3 and Figures 7 through 10 indicate that the water level changes at Washburn 1X, AeroPark, 5SB, and STP-2 were likely due to changes in barometric pressure. Well Test Analysis The 4PD well tests were analyzed with the commercially available well test package AQTESOLV from Hydrosolve, Inc. The Dougherty-Babu (1984) solution for a pumping test in a confined aquifer for a finite-diameter well with wellbore storage and wellbore skin was used to analyze the well test results in terms of the hydraulic properties of the screened intervals. A gross transmissivity of Zones 1 and 2 of 1,100 ft 2 /day and a well skin of 2.25 were determined from analysis of the 4PD long term test drawdown and recovery data. Results of the 4PD long term test and short term tests of individual zones are presented in a previous Nye County 4PD Well Test Report. A gross transmissivity of recompleted well 4PD of 620 ft 2 /day and a well skin of were determined from the analysis of the December 2011 pumping test indicating some damage to the well during recompletion. Single well tests do not provide reliable estimates of aquifer storage properties. Since observation wells 4PA and 4PB are not completed over the same intervals as the screens in Zones 1 and 2 in well 4PD a value specific storage (2 x 10⁻⁶ /ft) determined from
4 multi-well pumping tests conducted by the USGS in the VFA at Frenchman Flat was used in the drawdown predictions discussed in the next section. The Dougherty-Babu type curve fits to the two 4PD well tests are found in Appendix B. Estimation of Potential Drawdown Transmissivity (620 ft 2 /d) determined from the long term pumping test at well 4PD and specific storage (2 x 10⁻⁶ /ft) determined from multi-well pumping tests conducted by the USGS in the alluvial aquifer at Frenchman Flat were entered into a simple analytical aquifer model to estimate potential drawdown due to pumping well 4PD continuously at a rate of 50 GPM (80 ac-ft/yr) which represents the entire amount of the 80 acre-ft/year water right for well 4PD. Drawdown over a period of 200 years was estimated at Nye County wells NC-GWE-8PA and NC-GWE-GF-3PA, and also, at a distance equal to the distance from well 4PD to Devil s Hole (Figure 9). The analysis predicts 100 year drawdowns of 7.9 feet, 5.0 feet, and 3.5 feet at 8PA, 3PA, and at the distance from 4PD to Devil s Hole, respectively. Note that for reasons discussed below these drawdowns are likely overestimates of the actual effects of use of well 4PD. The simple analytical model assumes an infinite homogeneous aquifer with no lateral changes in hydraulic properties and no vertical flow. Wells 4PD, 8PA, and GF-3PA are completed in the alluvial aquifer and Devils Hole is a carbonate aquifer feature; thus the model overestimates the effect at Devils Hole. There are also several geologic structures between well 4PD and Devils Hole which would inhibit drawdown due to pumping at well 4PD, most notably the Gravity Fault (Nye County will be conducting a study of the hydrogeology of the Gravity Fault in the vicinity of well GF-3PA during 2012.). These structures are not incorporated in the analytical model; therefore, the drawdowns shown in Figure 9 are highly conservative. Nye County wells 8PA and GF-3PA are located between well 4PD and Devils Hole (about 3 and 10 miles from 4PD, respectively). Nye County routinely monitors water levels in well 8PA and GF-3PA; it is expected that any pumping effects from well 4PD will be detected in these wells. In addition, the National Park Service also has wells in its monitoring network (GF-1 and GF-2) between the Nye County wells and Devils Hole. Well locations are shown in Figure 1.
5 Figures
6
7 Figure 2. Response of Site 4 wells during 4PD long term pumping test. 4PD Zone 2 Response 4PA Zone 2 Aquitard Response 4PB Upper Zone 3 Response 4PD Below Packer Pumping Rate Day Pumping Test Recovery Water Level (ft bgs) Pumping Rate (gpm) Pump off 5 times for generator sevicing Elapsed Time (days)
8 Figure 3. Water level measurements at well Washburn 1X during long term pumping test at well 4PD Washburn Depth to Water (ft) Barometric Pressure (ft) /20/2010 8/30/2010 9/9/2010 9/19/2010 9/29/ /9/ /19/201 0 Washburn 1x Baro Pumping Period
9 Figure 4. Drawdown in recompleted well 4PD. drawdown (ft) Elapsed time (days) drawdown rate
10 Figure 5. Drawdown in 4PA during test of recompleted well 4PD drawdown (psi) pumping rate (GPM) /19/ /19/ :00 12/20/ /20/ :00 12/21/ /21/ :00 12/22/ /22/ :00 12/23/2011
11 Figure 6. Drawdown in 4PB during test of recompleted well 4PD drawdown (psi) pumping rate (GPM) /19/ /19/ :00 12/20/ /20/ :00 12/21/ /21/ :00 12/22/ /22/ :00 12/23/2011
12 Figure 7. Washburn 1X Water Levels DTW (ft, BGS) barometric pressure (psi) /19/ /20/ /21/ /22/ /23/ /24/ /25/ /26/ /27/ /28/ /29/2011 Washburn 1X baro
13 Figure 8. AeroPark Well Water Levels DTW (ft, BGS) barometric pressure (psi) /15/ /17/ /19/ /21/ /23/ /25/ /27/ /29/ /31/2011 1/2/2012 Aeropark baro
14 Figure 9. Well 5SB Water Levels DTW (ft, BGS) barometric pressure (psi) /19/ /20/ /21/ /22/ /23/ /24/ /25/ /26/ /27/ /28/ /29/2011 5SB baro
15 Figure 10. Well STP-2 Water Levels DTW (ft, BGS) barometric pressure (psi) /19/ /20/ /21/ /22/ /23/ /24/ /25/ /26/ /27/ /28/ /29/2011 STP#2 baro
16 Figure 11. Estimated drawdown in an infinite homogeneous aquifer due to pumping recompleted Nye County Well 4PD at 50 GPM drawdown (ft) time (yr) Devil's Hole GF-3PA 8PA
17 Appendix A Well Completion Information
18
19
20
21
22
23
24
25 Appendix B Type Curve Fits to 4PD Well Tests
26 Displacement (ft) Time (day) 4PD ZONE 2_25-DAY WELL TEST ANALYSIS Data Set: S:\...\Well 4PD Zone 2 LT Test_Dougherty-Babu Confined.aqt Date: 01/30/12 Time: 23:42:35 Company: Norwest Corporation Client: Nye County, NV Project: Location: EWDP Test Well: NC-EWDP-4PD Test Date: 08/30/2010 PROJECT INFORMATION AQUIFER DATA Saturated Thickness: 215. ft Anisotropy Ratio (Kz/Kr): 1. Pumping Wells Well Name X (ft) Y (ft) 4PD ZONE Aquifer Model: Confined WELL DATA SOLUTION T = ft 2 /day S = 4.565E-7 Kz/Kr = 1. Sw = 2.25 r(w) = 0.34 ft r(c) = 0.34 ft Observation Wells Well Name X (ft) Y (ft) 4PD ZONE Solution Method: Dougherty-Babu
27 Displacement (ft) E+4 1.0E+5 Time (min) WELL TEST ANALYSIS Data Set: C:\...\4PD test recovery analysis D-B manual.aqt Date: 01/30/12 Time: 23:43:07 Company: Norwest Client: Nye County Project: 78 Location: 4PD Test Well: 4PD PROJECT INFORMATION AQUIFER DATA Saturated Thickness: 100. ft Anisotropy Ratio (Kz/Kr): 1. Pumping Wells Well Name X (ft) Y (ft) 4PD Aquifer Model: Confined WELL DATA SOLUTION T = ft 2 /day S = 4.561E-5 Kz/Kr = 1. Sw = r(w) = 0.34 ft r(c) = 0.34 ft Observation Wells Well Name X (ft) Y (ft) 4PD Solution Method: Dougherty-Babu