Global CO 2 Storage Portfolio
|
|
|
- Trevor Clark
- 5 years ago
- Views:
Transcription


1 1 Global CO 2 Storage Portfolio Christopher Consoli Japan CCS Forum 16 June 2016 Tokyo, Japan Overlooking the Quest Capture facility located at Shell - Scotford, near Fort Saskatchewan, Alberta. Image provided by Shell.
 A transformation in how we generate and use energy is")
2 Gt CO 2 emissions 2 CCS is a vital element of a low-carbon energy future 6DS 2DS Source: IEA Energy Technology Perspectives (2015) A transformation in how we generate and use energy is needed
3 3 A significant task within one generation Global Status of CCS 4,000 Mtpa of CO 2 captured by CCS by 2040 (IEA 450 Scenario)** 40 large-scale CCS projects - combined capture capacity of approximately 71 Mtpa*: 22 projects in operation or construction (40 Mtpa) 6 projects in advanced planning (6 Mtpa) 12 projects in earlier stages of planning (25 Mtpa) 40 Mtpa *Mtpa = million tonnes per annum Non-OECD OECD **Source: IEA, Energy Technology Perspectives (2015).

4 Global Storage Portfolio:
5 5 Portfolio outline Summarises the results from all known publically available, Englishlanguage (for now) storage resource assessments worldwide Asia-Pacific: 14 countries Americas: 5 countries Middle East: 3 countries EU and Russia: 31 countries Africa: 4 four countries Five key sections 1. Scale of assessment 2. Level of detail 3. Prospective basins 4. Projects 5. CCS Indicators Countries assessed


6 Storage Resource Pyramid 6 Scale and detail of assessment
7 Storage Resource Pyramid 7 Scale and detail of assessment Global Storage Portfolio
8 8 Scale and detail of assessment definitions Full Comprehensive assessments (including published Atlases) that cover most or all potential storage basins with accompanying effective resource calculations. Moderate National studies/atlases without widespread effective resource calculations; or, partial coverage by state/province/basin scale atlases or detailed assessments. Limited More restricted studies, consisting of relevant research into selected basins or sites. Very limited Minimal or no published research relating to storage potential.
9 9 Status of global storage resource assessment Scale and detail of assessment
10 10 Storage resources: 2015 CAN NOR 85 CHN UK USA EU 70 KOR JPN 140 MEX 100 IND SE ASIA 100 BRA 2000 SAF 160 AUS Approximate storage resource (Gt) Values from various public sources of information, including national to basin-scale studies to assessments of depleted oil and gas fields only. SE Asia only includes Indonesia (South Sumatra), Philippines, Thailand, Viet Nam.


11 11 Prospective basins Basins identified as prospective have: o Previous CO 2 storage potential identified; o Proven oil and gas basin; and/or o Favourable geology. Country-specific o Relative to other basins

12 12 Prospective basins: Japan Tempoku Niigata Ishikari Hidaka Joban Numerous studies Detailed site identification and prioritisation Offshore/Onshore Pilot and R&D Tsushima Kanto Report data available exclusive to members. For more information please contact


13 13 Prospective basins: China and Australia Songliao Tarim Ordos Report data available exclusive to members. For more information please contact Bohai Numerous studies Onshore Extensive oil and gas Extensive data CO 2 -EOR Commercial, pilot and R&D Bonaparte Carnarvon Surat Report data available exclusive to members. For more information please contact info@globalccsinstitute.com Gippsland Numerous studies Offshore/Onshore Extensive oil and gas Commercial, pilot and R&D

14 14 Prospective basins: Indian Sub-Continent Single continent-scale study Mainly offshore Limited data Limited oil and gas Limited R&D Mumbai Bengal Krishna Report data available exclusive to members. For more information please contact


")
15 15 Prospective basins: Indonesia and Malaysia Sumatra Report data available exclusive to members. For more information please contact Java Malay Sarawak Report data available exclusive to members. For more information please contact Regional studies variable assessment Mainly offshore basins Extensive data Extensive oil and gas (high CO 2 fields)


16 16 Prospective basins: South Africa and Morocco Mozambique Report data available exclusive to members. For more information please contact Orange Outeniqua Each country has a single national study Mainly offshore Limited data Minor R&D Essaouira Report data available exclusive to members. For more information please contact info@globalccsinstitute.com


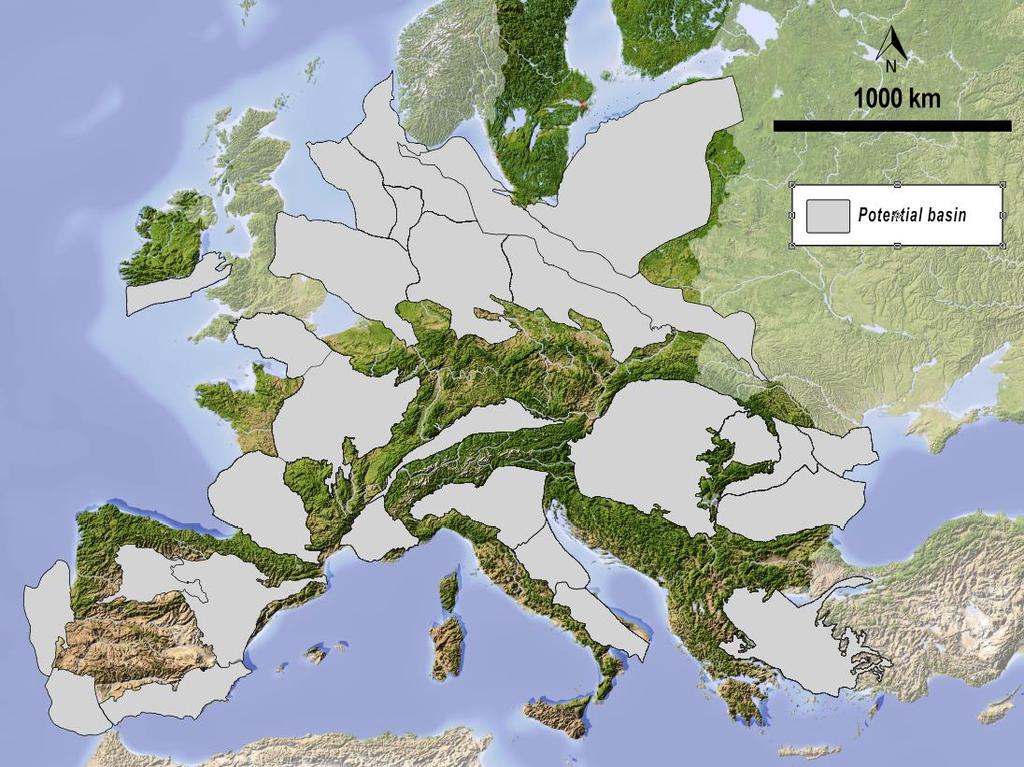
17 17 Prospective basins: Europe, UK, Russia North Sea Baltic North German Report data available exclusive to members. For more information please contact Balkan Multiple, multi-scale assessments North Sea largest potential Extensive R&D Timan-Pechora Volga-Urals Report data available exclusive to members. For more information please contact No national studies Extensive oil and gas, CO 2 -EOR Very limited R&D


18 18 Prospective basins: Saudi Arabia and UAE Report data available exclusive to members. For more information please contact No national studies Extensive oil and gas, CO 2 -EOR Very limited R&D Commercial project Report data available exclusive to members. For more information please contact info@globalccsinstitute.com


19 19 Prospective basins: Brazil and Mexico Report data available exclusive to members. For more information please contact Campos Santos National and detailed studies Offshore/Onshore Oil, gas, CO 2 -EOR Variable studies Increasing R&D Gulf of Mexico Report data available exclusive to members. For more information please contact info@globalccsinstitute.com


20 20 Prospective basins: USA and Canada Williston Illinois Report data available exclusive to members. For more information please contact Anadarko Permian Gulf of Mexico National and detailed studies Site-scale analysis Onshore Oil, gas, CO 2 -EOR Extensive pilot, commercial and R&D Williston/Alberta Report data available exclusive to members. For more information please contact info@globalccsinstitute.com
21 21 CO 2 injection projects Operational Under construction Small Scale or Pilot Under Construction, Operational, Completed (After: Cook et al. (2014); Global CCS Institute (2015) Technical, legal and regulatory barriers overcome Scientist, engineers, technicians, suppliers, regulators work together CCS can happen here
22 22 CCS Indicators Summarises the results of the three 2015 indicators Storage Policy Legal and Regulatory Detailed quantitative / qualitative assessments Drawing from the extensive Institute database and publically available data Can be used to gauge the CCS Readiness or the ability to deploy a CCS project today
23 23 CCS Indicators Geological Storage Readiness Prepared Well Advanced Making Progress Just Starting
24 24 CCS Indicators Policy Upper Tier Upper-Mid Tier Lower-Mid Tier Lower Tier
25 25 CCS Indicators Legal and Regulatory Band A Band B Band C
26 26 Conclusions Substantial storage resources are present in most key regions of the world. o Most of the largest emitters have vast quantities of available pore space o Need more exploration for suitable sites, securing depleted fields and infrastructure Reliable methodologies to determine and classify regional storage resources are available. o But need an international standard, agreed terms. The level of resource assessment undertaken and the availability of characterisation data is highly variable across regions. o Cannot get a global assessment and cannot be compared

27 27 Global CCS Institute publications (1) Storage Portfolio is a Member-only exclusive: Living document Key database Full report is available online at the Institute s Members Portal CCS Indicator documents Storage, Policy and Legal/Regulatory available as public documents. All publications here:


28 28 Global CCS Institute publications (2) Storage Portfolio is a Memberonly exclusive Living document Key database Full report is available online at the Institute s Members Portal CCS Indicator documents Storage, Policy and Legal/Regulatory available as public documents All publications here:

29 Chris Consoli Senior Adviser, Global CCS Institute 29