2017 Midpoint Assessment: Year of Decision. October 19, 2017 PA Phase III WIP Steering Committee Meeting
|
|
|
- Myra Briggs
- 5 years ago
- Views:
Transcription

1 2017 Midpoint Assessment: Year of Decision October 19, 2017 PA Phase III WIP Steering Committee Meeting
2 Today s Objectives Highlight of key midpoint assessment policy decisions to be considered by the Chesapeake Bay Program s Principals Staff Committee on December 19-20, 2017 Overall Midpoint Assessment schedule revisions Not seeking a decision on these policy issues and priorities today 2
3 What is the Midpoint Assessment? Review of progress towards meeting the % interim target and the 2025 Chesapeake Bay TMDL goal Optimize implementation of the Bay jurisdictions WIPs and ensure we re on track for development of Phase III WIPs Gather, review, and incorporate new data and science into the Partnership s decision support tools
4 Who s Involved in the Midpoint Assessment? Citizens Advisory Committee Chesapeake Executive Council Principals Staff Committee Independent Evaluator Local Government Advisory Committee Scientific & Technical Advisory Committee Communications Workgroup & Office Management Board CBP Director Action Teams Sustainable Fisheries Protect & Restore Vital Habitats Goal Implementation Teams Protect & Restore Water Quality Maintain Healthy Watersheds Foster Chesapeake Stewardship Enhance Partnering, Leadership & Management Science, Technical Analysis, and Reporting Implementation Workgroups Implementation Workgroups Implementation Workgroups Implementation Workgroups Implementation Workgroups Implementation Workgroups
5 Draft Phase III WIP Planning Targets, Final Phase 6 Modeling Tools, and Final Policy Decisions Will Not Be Ready Until December


6 Planning Targets by Jurisdiction and Major River Basin
7 Guidelines for Allocations / Planning Targets Allocated N and P loads must result in attainment of water quality standards. Areas that contribute the most to the problem must do the most to resolve the problem. All tracked and reported reductions in nutrient loads are credited toward achieving final assigned loads. 7
8 Partnership Decisions to Date on Planning Targets In December 2016, PSC approved the use of the same methodology to establish the Phase III WIP planning targets that was used to establish the 2010 Bay TMDL allocations. The WQGIT and Source Sector Workgroups developed new definitions of No Action and E3, as part of the planning targets methodology. The WQGIT approved using the year 2010 as the baseline for establishing the Phase III WIP planning targets, which is consistent with the Bay TMDL. 8

9 Why are Planning Targets Changing? Refinements to Modeling Tools Number and Effectiveness of BMPs High resolution and local land use Additional monitoring stations Geographic Isolation Runs Addressing Changed Conditions Conowingo Climate Change Growth 9
10 10
11 11
12 12
13 13

14 Assimilative Capacity Planning Targets TMDL Allocations Affect of Key Decisions Conowingo + Growth + Current Estimated Load Total load reductions needed by
15 Chesapeake Bay TMDL and the Conowingo Dam The 2010 Chesapeake Bay TMDL said EPA s intention is to assume the current trapping capacity will continue through the planning horizon for the TMDL (through 2025). The Conowingo Reservoir is anticipated to reach a steady state in years, depending on future loading rates, scour events and trapping efficiency. Under these assumptions, the waste load allocations (WLA) and load allocations (LA) would be based on the current conditions at the dam. Source: Appendix T. Sediments behind the Susquehanna Dams Technical Documentation: Assessment of the Susquehanna River Reservoir Trapping Capacity and the Potential Effect on the Chesapeake Bay (U.S. EPA 2010) 15
 CBP Scientific and Technical Advisory Committee (2014, 2016) Enhanced Monitoring and Modeling funded by Exelon and conducted by Gomez and Sullivan, University of Maryland and USGS")
16 Significant New Monitoring And Research Since 2011 Indicate Conditions have Changed U.S. Geological Survey (USGS) (2012, 2014, 2015) U.S. Army Corps of Engineers (2015) Johns Hopkins University (2013, 2015, 2016) CBP Scientific and Technical Advisory Committee (2014, 2016) Enhanced Monitoring and Modeling funded by Exelon and conducted by Gomez and Sullivan, University of Maryland and USGS ( ) 16
17 History of the Lower Susquehanna River Reservoirs: Holtwood Dam constructed Holtwood Dam reaches equilibrium 1928 Conowingo Dam constructed 1931 Safe Harbor Dam constructed 1950 Safe Harbor Dam reaches equilibrium s Historical lowest flows in Susquehanna 1972 Tropical Storm Agnes Systematic water quality monitoring begins on the Susquehanna River at Conowingo Dam 1996 Big Melt flood event SRBC convenes Susquehanna Sediment Task Force Symposium; publishes report 2010 Chesapeake Bay TMDL established 2012 Hirsch 2012 scientific paper publishes clear evidence for Conowingo Reservoir at or near dynamic equilibrium 2015 Lower Susquehanna River Watershed Assessment 2017 Bay TMDL Midpoint Assessment Source: Langland, USGS, Personal Communication
18 Phosphorus Loads Into, Trapped Within and Exiting the Reservoir System: 1990s-2010s Early 1990 s, about 50% of P trapped ~10 ~5 ~5 Loads Into Reservoir System Long term improving trend Early 2000 s, about 40% of P trapped ~11 ~5 ~6 Early 2010 s, Approaching no net trapping Loads Out of Reservoir System - Conowingo Long term degrading trend ~8 ~0 ~8 Source: Data from USGS (2016), loads are approximate and in units of million lbs/year using estimates for 1992, 2002, and
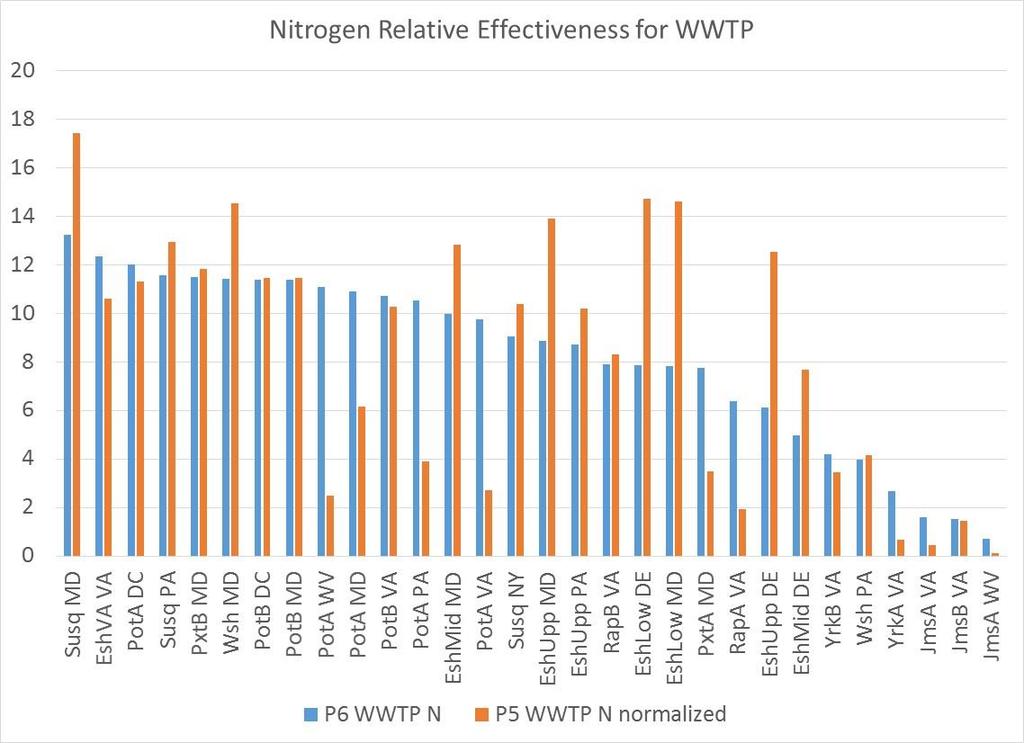
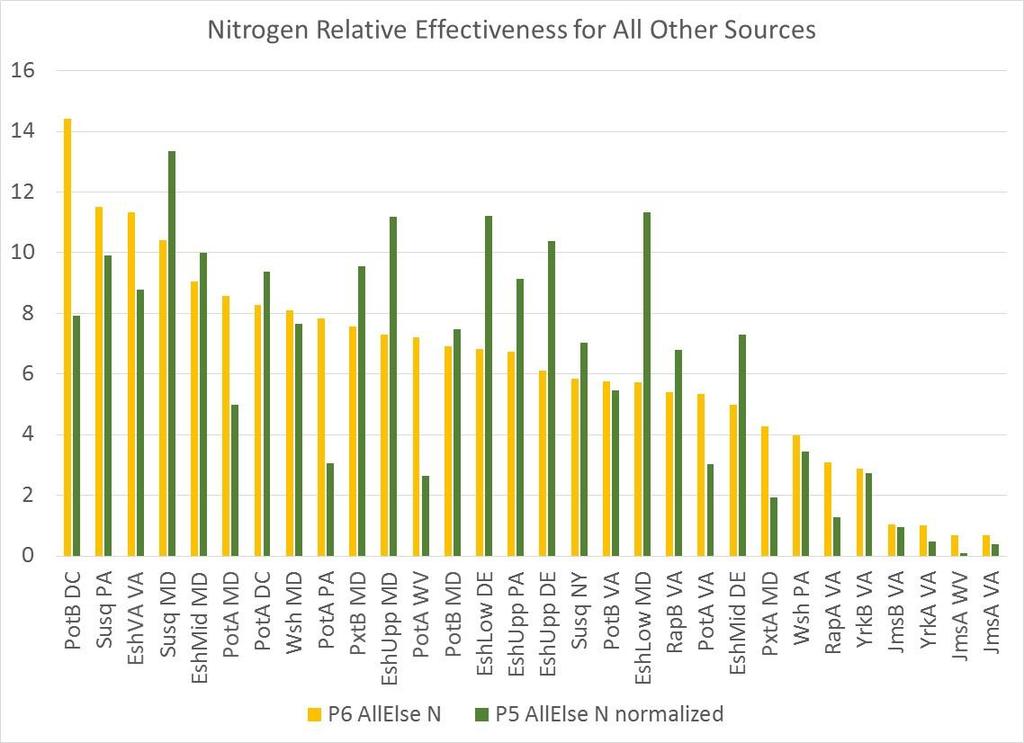
19 Nitrogen Relative Effectiveness P5 P6 19

20 Phosphorus Relative Effectiveness P5 P6 20
21 Conowingo Dam Infill Policy Decisions Who? How? Allocation equity rules used in the Bay TMDL Most cost effective practices and locations When? By 2025 Beyond 2025 Post 2025

22 Conowingo Dam Infill October 3, 2017 PSC Decisions PSC agreed to add the Susquehanna + most effective basins option for final PSC decision. 22
23 Conowingo Dam Infill October 3, 2017 PSC Decisions PSC agreed to draft a letter on expectations for the role in Exelon in addressing increased loads associated with Conowingo infill, as part of the Clean Water Act 401 certification. The letter will likely be addressed to Exelon. PSC will review a draft of the letter at one of their upcoming meetings. 23

24 Climate Influence on the Bay Watershed 24

25 Keeping Score for
26 DRAFT Model Results: Nitrogen to Rivers and the Bay 26
27 DRAFT Model Results: Phosphorus to Rivers and the Bay 27
28 DRAFT Model Results: Sediment to Rivers and the Bay 28

 and other commitments through the Phase III WIPs and")
29 Climate Change Recap of Policy Decisions The Partnership will decide how to address climate change considerations in the Phase III WIPs: Quantitatively accounting for additional loads due to climate change impacts projected through 2025 in the Phase III WIPs AND/OR Qualitatively adaptively manage climate change considerations through the implementation of BMPs (with climate resilient characteristics) and other commitments through the Phase III WIPs and 2-year milestones
30 Pounds Delivered N Accounting for Growth Recap of Policy Decision: Should 2025 Future Projections be Used to Account for Growth in the Phase III WIPs? 120,000, ,000, ,000, ,000, ,000,000 95,000,000 90,000,000 85,000,000 80,000,000 75,000,000 70,000, Year 2025 growth projection Load reductions necessary to meet the 2025 Phase III WIP Planning Target (lock box) 30
31 2025 Growth Scenarios Historical Trends : previous patterns of growth replicated into the future. Current Zoning : growth focused towards local areas zoned to accommodate it. Current Zoning Plus : Current Policy combined with growth focused in areas with planned infrastructure (e.g., roads, sewer, and water) Conservation Plus : Current Policy Plus combined with aggressive land conservation, accelerated infill/redevelopment, and upzoning urban and downzoning rural areas 31

32 Accounting for Growth Pennsylvania in 2025 Demand 236,750 new housing units 345,246 new jobs 25% infill/ redevelopment (weighted average) Impact 181,180 acres of greenfield development: 34,041 acres impervious 86,275 acres turf grass 13,829 acres trees over turf 2,782 acres mixed open 44,253 acres forest 49% of development on farmland 62% of growth on sewer 32
33 Accounting for Growth WQGIT Recommendations to the PSC Use 2025 growth projections as base conditions for the Phase III WIPs. This approach explicitly accounts for growth in the Phase III WIPs growth will be forecasted using zoning information from local governments. Update the growth projections every 2 years with the best available data to inform the development of the two-year milestones. Allows for adaptive management to changing growth patterns and trends as we approach Allows state and local jurisdictions to report new data based on updated policies, ordinances, etc. that will change growth patterns. 33
34 Next Steps for Final Phase 6 Calibration and Partnership Decisions Between Now and December 19-20, 2017 Complete final calibration of the Phase 6 Watershed Model and the Phase 6 Water Quality Sediment Transport Model to determine the new assimilative capacity of the Chesapeake Bay. Need to see what changes there are to the assimilative capacity due to the (1) effects of Conowingo; (2) climate change; and (3) other refinements incorporated into the modeling tools. Once calibration is complete, develop the draft Phase III WIP planning targets Based on new geographic isolation scenarios. Understand how and why levels of effort would change for various decision options. 34
35 Revised Midpoint Assessment Schedule First week of December 2017 Modeling Workgroup and WQGIT recommendations on (1) how to address Conowingo; (2) climate change in the Phase III WIPs; (3) Phase 6 suite of modeling tools; and (4) draft Phase III WIP planning targets. December 19-20, 2017 PSC meeting to make final decisions on how to address Conowingo Dam and climate change in the Phase III WIPs; approval of the Phase 6 suite of modeling tools; and release of the draft Phase III WIP planning targets for 4-month Partnership review. December 22, 2017 April 20, 2018 Partnership review of the draft Phase III WIP planning targets. May 7, 2018 Release of the final Phase III WIP planning targets. February 8, 2019 Draft Phase III WIPs posted on jurisdictions websites for partner and public stakeholder review. June 7, 2019 Final Phase III WIPs posted on jurisdictions websites 35
36 Upcoming 2017 PSC Decisions Decisions and Presentations for December 19-20, 2017 PSC Meeting Presentation of modeling results of Conowingo scenario options using final calibrated Phase 6 modeling tools, with a comparison of scenario options to the jurisdictions draft Phase III WIP planning targets. Decision Requested: (1) Who should be responsible for addressing the additional load due to Conowingo; (2) how should it be allocated; and (3) by when should this additional load be addressed? Presentation of modeling results of climate change impacts (precipitation change, temperature increase, and sea level rise) using final calibrated Phase 6 modeling tools, with a comparison of scenario results to the draft Phase III WIP planning targets to show any changes to levels of effort. Decision Requested: (1) how should climate change considerations and impacts be factored into the Phase III WIPs and (2) by when? 36
37 Upcoming 2017 PSC Decisions Decisions and Presentations for December 19-20, 2017 PSC Meeting A presentation of each jurisdiction s 2025 growth projection will be provided. Decision Requested: Does the PSC concur with the WQGIT recommendations to (1) use 2025 growth projections as base conditions for the Phase III WIPs and (2) update these projections every two years? Decision Requested: Approval of the final calibrated Phase 6 suite of modeling tools. Decision Requested: Approval and release of the draft Phase III WIP planning targets for Partnership review. 37