Global ELT Management A global state of knowledge on collection rates, recovery
|
|
|
- Jonathan Wells
- 5 years ago
- Views:
Transcription


1 Global ELT Management A global state of knowledge on collection rates, recovery routes, and management methods January 2018 Global ELT Management A global state of knowledge on collection rates, recovery routes, and management methods, January Published June 2018.
2 Global ELT Management A global state of knowledge on collection rates, recovery routes, and management methods, January Published June 2018.

3 Contents Executive summary 2 Glossary of terms used 4 Introduction 6 Context and objectives of the ELT project... 6 Objectives of this study... 6 Methodological approach... 7 State of Knowledge on targeted Regions/Countries 9 Methodology on data collection, consolidation and limitations... 9 Summary and cross-analysis of the ELT markets Regulation or intervention of public authorities Summary for each region/country Argentina 22 Australia 23 Brazil 23 Canada 24 China 24 Europe (ETRMA scope) 25 India 25 Indonesia 26 Japan 26 Malaysia 27 Mexico 27 Morocco 28 New Zealand 28 Russia 29 Saudi Arabia 29 South Africa 30 South Korea 30 Thailand 31 Ukraine 31 United States 32 State of Knowledge on Recovery Routes 33 Summary and cross-analysis of Recovery Routes Focus on some Recovery Routes Analysis of Recovery Routes by country/region Conclusion of the SOK phase 36 01
4 Executive summary Deloitte was commissioned by the World Business Council for Sustainable Development (WBCSD) in the context of the Tire Industry Project to conduct this study and prepared the present report. This report has been submitted and published by WBCSD. The purpose of this State of Knowledge (SOK) phase is to get an overview of the current ELT management systems for a selection of 51 countries: Argentina, Australia, Brazil, Canada, China, Europe (countries covered by ETRMA scope - European Tyre & Rubber Manufacturers' Association) 1, India, Indonesia, Japan, Malaysia, Mexico, Morroco, New Zealand, Russia, Saudi Arabia, South Africa, South Korea, Thailand, Ukraine and USA which cover 89% of vehicles in the world (Source: OICA, [Organisation Internationale des Constructeurs d'automobiles], 2015 data). The results of the study presented in this report are based on information collected via literature review and interviews with TIP members as well as a variety of different external stakeholders. The quantitative data on ELT management presented in this study needs to be interpreted in relation with the methodological assumptions and limitations. The main ways in which to recover ELTs have been grouped into the following categories: material recovery, energy recovery, civil engineering and backfilling. The total amount of ELT recovered in the 19 countries and the region of Europe (ETRMA scope) is estimated to be more than 17,000 kilotons per year, while the amount of ELT generated is estimated to be more than 25,000 kilotons. The countries and regions that recover the largest quantities of ELTs are China, United States and Europe (ETRMA scope), while Canada has the highest recovery rate (111% 2 ), followed by India (98%) and South Korea (95%). Different ELT management systems exist: Extended Producer Responsibility (EPR) system or take-back obligation system, government responsibility financed through a tax, and free-market system. In practice, hybrid systems can be implemented and other variants of these systems also exist, such as the Product Stewardship Scheme in Canada. However, a minimum level of intervention from the government is usually necessary in order to properly develop the ELT recycling industry. Energy recovery can be a particularly efficient way to deal with high volumes of ELTs and eliminate long-standing stock piles, because it is generally technically straightforward to implement and can be deployed on a large scale to achieve relatively quick pay-back for the initial investment. The use of ELT as an alternative fuel is also encouraged to reduce CO 2 emissions. Nevertheless, as a general trend, once a country has established a more mature approach to ELT management, material recovery is often supported through policy-making. Although the production of rubber granulates and powder requires higher process costs as well as demanding efforts to 1 AUSTRIA; BELGIUM; DENMARK; FINLAND; FRANCE; GERMANY; GREECE; IRELAND; ITALY; LUXEMBOURG; NETHERLANDS; NORWAY; PORTUGAL; SPAIN; SWEDEN; SWITZERLAND; UNITED KINGDOM; BULGARIA; CROATIA; CYPRUS; CZECH REPUBLIC; ESTONIA; HUNGARY; LATVIA; LITHUANIA; MALTA; POLAND; ROMANIA; SERBIA; SLOVAKIA; SLOVENIA; TURKEY. 2 According to CATRA, all ELTs are recovered. Annual recovery rates exceed 100% when there is a delay in treatment from one year to another. The rate in 2014 was below 100%, which explains a rate greater than 100% in Global ELT Management A global state of knowledge on collection rates, recovery routes, and management methods, January Published June 2018.
5 ELT management A global state of knowledge on collection rates, recovery routes, and management methods create new partnerships with other secondary end-user industries, it also generates products with greater added-value and has better environmental performance in terms of resource saving and emissions reduction. Overall, 86% of the ELT recovered (in tons) by the countries/regions included in our study are concentrated in two Recovery Route sub-categories: production of tire-derived material (TDM) with 33%, tire-derived fuel (TDF) with 31%, in addition to one specific Recovery Route: reclaim rubber (22%). It must be noted that ELT tirederived fuel (TDF) recovery by cement kilns (with 2,796 kilotons) accounts for 16% of the overall recovery. Although the two Recovery Route sub-categories (TDF and TDM) are rather well spread at the global level and used as one of the main Recovery Routes in a large number of countries, the production of reclaim rubber is mainly developed in Asian countries: China, Japan and Thailand. It s the main Recovery Route in China (34% of the total domestic recovery market) that represents about 20% of the total ELT recovered (including civil engineering and backfilling) for the selected scope. The remaining 14% of the market is mainly shared between pyrolysis & gasification and civil engineering & backfilling. Pyrolysis is one of the most important Recovery Routes in the following countries: China, Thailand, Indonesia and Mexico, while it remains very marginal in other countries. The market for civil engineering & backfilling is concentrated in certain countries and regions: Australia, USA, Brazil and a few countries in Europe. In particular, it represents 35% of the domestic market in Australia and 8% of the domestic market in USA, which makes cost structure and business profitability significantly vary from one Recovery Route to another and from one region / country to another for a specific Recovery Route. Transportation generally represents an important cost factor that can constitute a barrier for recycling in some countries that have a free market system. Therefore, in countries where an eco-fee is collected, a significant part of it is usually allocated to cover the transportation fees. In addition, business profitability depends on the price of the TDF or TDM. The competitiveness of the TDF or TDM is directly affected by the prices of competing products and materials. By making certain ELT recycling markets more competitive, a subsidized system can then encourage the development of these markets. Another key function of a subsidized system is to provide a certain level of economic security and stability to allow for initial business development, as the prices of alternative materials may significantly vary in the short and medium terms under unstable economic contexts. However, the overall trend in the long term is to reduce the eco-fees as the ELT recycling business becomes more competitive, encouraging self-sufficiency. 03
6 Glossary of terms used Civil engineering and backfilling: Recovery Route where ELTs are recovered through civil engineering applications (water retention and infiltration basins, supporting walls, etc.) and through landfilling of mining activities (tires that are shredded and mixed in with other geological materials to reclaim sites that have been mined out for example). End of Life Tire (ELT): A tire that can no longer serve its original purpose on a vehicle. This excludes used tires that are retreaded, reused, or exported in used cars. End of Life Vehicle (ELV): A vehicle that can no longer serve its original purpose. Energy Recovery: Recovery Route category where ELTs are recovered as tire-derived fuel (TDF). For the purpose of this study, it was considered that 75% of ELT used in cement kilns are recovered as energy. For ELT that are recovered through unknown Recovery Routes, a 50/50 split has been made between energy recovery and material recovery. Material Recovery: Recovery Route category where ELTs are recovered as a new material. It can be used to produce tire-derived material (TDM) for instance. For the purpose of this study, it was considered that 25% of ELT used in cement kilns are recovered as material. For ELT that are recovered through unknown Recovery Routes, a 50/50 split has been made between energy recovery and material recovery. Off The-Road tires (OTR tires): Tires used on large vehicles that are capable of driving on unpaved roads or rough terrain. Vehicles include tractors, forklifts, cranes, bulldozers, earthmoving equipment, etc. Recovery Route (RR): A way of recycling ELTs either through material and/or energy recovery. In other words, the end market or destinations of ELTs when recycled. For the purpose of this study, retreaded, reused, landfilled or stock-piled tires are not considered as recycled. Regrooving: Consists of cutting a pattern into the tire's base rubber. Retreading: Also known as recapping or remoulding. Process of renewal of used tires for reuse in the domestic market or for export by replacing the worn-out rubber belts/ treads with new ones. State of knowledge (SOK): A review and analysis of the current information available on a topic. In this context the aim is to provide an overview of the ELT management systems in place including the ELT collection rates, recovery routes, and management methods. Tire-derived material (TDM): Recovery Route subcategory. TDM is a product made from the recycled material of ELT. Tire Industry Project (TIP) members: Bridgestone Corporation, Continental AG, Cooper Tire & Rubber Company, The Goodyear Tire & Rubber Company, Hankook Tire Co., Ltd., Kumho Tire Company Inc., Compagnie Générale des Établissements Michelin, Pirelli & C.S.p.A., Sumitomo Rubber Industries, Ltd., Toyo Tire & Rubber Co., Ltd., and The Yokohama Rubber Co., Ltd. Tire-derived fuel (TDF): Recovery Route sub-category. TDF is ELT used as an alternative fuel to produce energy through combustion (Energy Recovery). TDF also refers to the fuels produced by a specific treatment of ELT (such as pyrolysis). Although the cement Recovery Route is considered both energy and material recovery, it is included in TDF for the purpose of the report. TOTAL ELT Generated (from available sources): Amount of ELT generated (in tons) according to the most reliable and comprehensive source available. TOTAL Recovered (excluding civil engineering and backfilling): Amount of ELT recovered (in tons), through material and energy recovery. This does not include any tires that are recovered for civil engineering and backfilling, abandoned, landfilled or stockpiled. TOTAL Recovered (including civil engineering and backfilling): Amount of ELT recovered (in tons), through material, energy recovery and civil engineering & backfilling. This does not include any tires that are abandoned, landfilled or stockpiled. Types of vehicles: - Passenger cars: road vehicles excluding motorcycles with a capacity of below nine people in total (i.e. nine seats or less - inspired by the OICA definition). - Commercial vehicles: light duty commercial vehicles, coaches, buses, heavy duty vehicles such as trucks (inspired by the OICA definition). These will also include the OTR vehicles. 04
7 - Motorcycles: Two and three-wheeled motorized vehicles including mopeds, scooters and motorcycles. Used Tire (UT): This broader definition includes ELTs as well as retreadable tires, second-hand tires and tires exported with used cars. Vehicles in use: all registered vehicles on the road during a given period specific date (inspired by the OICA - International Organization of Motor Vehicle Manufacturers - definition). 05
8 Introduction Formed in 2005, the Tire Industry Project (TIP) serves as a global, voluntary, CEO-led initiative, undertaken by 11 leading tire companies with an aim to anticipate, identify, analyze and address the potential human health and environmental impacts associated with tire development, use and management through end of life. TIP is a proactive organization that operates under the umbrella of the World Business Council for Sustainable Development (WBCSD) and is designed to advance sustainability throughout the industry. Together, TIP member companies work to anticipate, identify, analyze and collaborate on sustainability challenges facing the industry, improve understanding of and educate about these challenges, and develop potential solutions for a more sustainable future. Context and objectives of the ELT project The tire industry recognizes that there are both opportunities and challenges associated with tire manufacturing and sustainable development. By taking an early look at industry issues, TIP works to more fully understand environmental and health challenges pertinent to the tire industry and formulate an approach for making the industry more sustainable. TIP has an objective to advance ELT Management globally by engaging stakeholders in a process of identifying, sharing and implementing best practices. Objectives of this study This study has been conducted with the support of Deloitte to collect and summarize current information on ELT management practices and data for a selection of 51 countries. There is fairly good knowledge of ELT management and practices in Europe and countries such as USA, Japan, and South Korea where the existence of regulatory authorities and a trade association allows the collection and consolidation of rather comprehensive data that can be easily accessed, although there is still a diversity of methods used to obtain the data, with different vocabularies and different scopes covered (in terms of types of tires). Those countries and regions are also the ones with relatively mature ELT management systems and best practices to share. On the other hand, much less information is publicly available in other key countries such as China and India, in spite of their tire markets impressive growth. The lack of data availability can be explained by the lack of maturity of the existing ELT management systems and the absence of actors at the national level in charge of collecting and consolidating the data. However, the opportunities for the future of ELT management at the global level are tremendous in these countries. Poor knowledge of statistics and ELT practices can be an impediment to improving the local and global ELT management. In addition, very heterogeneous practices can be observed in terms of ELT management from one country to another in terms of legislative framework, network organization and present and future markets for Recovery Routes. A better knowledge of these practices will allow for the identification of good practices and opportunities for future collaboration with local stakeholders. Therefore, the purpose of this SOK is to provide an overview of the current ELT management systems for a selection of 51 countries: Argentina, Australia, Brazil, Canada, China, Europe (countries covered by ETRMA scope - European Tyre & Rubber Manufacturers' Association), India, Indonesia, Japan, Malaysia, Mexico, Morroco, New Zealand, Russia, Saudi Arabia, South Africa, South Korea, Thailand, 06
9 Ukraine and USA which cover 89% of vehicles in the world (source: OICA, 2015 data) 3. The main criterion used for the selection is the number of vehicles in use. We ensured that the selection includes the countries with the most important car markets, representative of different geographical zones. We also verified that the selection includes the most important countries and regions for other criteria such as GDP and population. Methodological approach It s important to note that retreading and reusing tires before they are disposed of as ELT is the best way to reduce the environmental impacts and promote circular economy. In some countries, retreaded and reused tires are included in the official recovery rates. However, quantifying the amount of these tires reinjected in the market is not always possible and the reliability of the data can be questionable because assumptions are often used regarding the number of times a tire can be retreaded/reused. For this reason, the data presented in this study focuses only on ELT. The results of the study presented in this report are based on information collected via: literature review and interviews with TIP members and external stakeholders. A stakeholder mapping has been performed with TIP members in order to include key stakeholders in our data collection and consultation process. More than 70 stakeholders have been interviewed from 13 different categories shown on Figure 1. During the interview process, stakeholders were asked to provide insight and quantitative information regarding ELT generation and recovery in the different countries/regions of our scope. The findings presented in this report are solely based on the data sources presented above. The purpose of the study is to capture the best knowledge possible with the means and timeline defined for the project. Efforts have been made in order to avoid introducing biased opinions in the data collected through the interviewees, by presenting the most factual information possible and being transparent about the sources of information. It s important to note that the intention of the study is not to audit nor validate the data collected from different sources. The quality of quantitative data collected on ELT management varies from one country to another: Countries where there isn t any formal organization in charge of the ELT management at the national level generally suffer from a lack of reliable consolidated data. Inconsistent data from different sources can be observed in these cases. Even in countries where official data is published by a formal, well recognized organization, they still need to be interpreted with caution. For instance, ELTs generated by ELV are not always included in the consolidated data (see details in Table 1. Level of confidence on the data used by country/region). Another limitation is related to the share of ELTs from illegal import, treated by illegal operators or never declared by legal operators, which can constitute quite a significant volume, even in countries with a mature ELT system. The share is not included in the official consolidated data where the volume of total ELTs generated is underestimated and the recovery rate can be overestimated. In addition, it s not unusual to obtain a recovery rate higher than 100%, due to methodological limitations, uncertainties and the effects of stock piles (see Canada). Therefore, the data presented in this study needs to be interpreted carefully. For more information regarding the limitations, assumptions and scopes of the data collected and consolidated in the study and the assessment of the data reliability, please refer to the chapter State of Knowledge on targeted Regions/Countries. We would like to thank all of those who kindly participated in the study, through interviews or by other means, supporting the completion of this project. 3 Vehicles in use data obtaind from (2015) data published by OICA (International Organization of Motor Vegicle Manufacturers). 07
10 End users (customer associations, automobile club, logistic companies) Tire and Rubber Trade Associations and other relevant organisation or representative of the tire industry TIP members (tire industry) Tire distributors (garages, warehouse shops, etc.) Supplier association for the tire industry NGOs and other associations Car manufacturers More than 70 interviews Public authorities (regulators, governments, etc.) Companies/associations that use the TDF/TDM (cement industry, steel industry, civil engineering, power plants, etc.) Tire recycling associations Academics, researchers, environmental experts Producer Responsibility organization ELT treatment facilities (granulators) Figure 1. Stakeholder interviewed 08
11 State of Knowledge on targeted Regions/Countries The purpose of this State of Knowledge (SOK) is to get an overview of the current ELT management systems for a selection of countries: Argentina, Australia, Brazil, Canada, China, Europe (countries covered by ETRMA scope - European Tyre & Rubber Manufacturers' Association), India, Indonesia, Japan, Malaysia, Mexico, Morroco, New Zealand, Russia, Saudi Arabia, South Africa, South Korea, Thailand, Ukraine and USA. This chapter will summarize this SOK based on the twenty individual reports. Methodology on data collection, consolidation and limitations As stated in the Introduction, the information presented in this chapter has been collected through two main approaches: 1. Literature review such as public studies, public databases and statistics, academic studies, existing and emerging regulations, etc. 2. Stakeholder consultation process based on interviews. In some cases, mainly for language barriers, the information was collected via written feedback after an interview guide was sent to the interviewee. In order to obtain the most reliable data possible, the different sources of information (if applicable) have been compared and the principal interviewees were requested to validate key findings. Recovery Routes communicated in the study may vary from the source data. - When possible, the most recent source of data (mostly 2015) has been used. However, it s important to note that not all of the countries have data corresponding to the same year. No extrapolations have been made for alignment to a given base year. - When available, the unit used to measure ELT management indicators is metric tons. Conversions between short tons (USA) to metric tons or from number of units to tons have been made where necessary. Data regarding ELT generation in Mexico and India are available in number of tires and not in tons. An estimation of 10kg/tire has been used for Mexico and an average of 8kg/tire in the case of India. For the purpose of comparing the different countries performances in terms of ELT management, a set of definitions and scopes have been defined. For this reason, the data available in the different sources has been adjusted when necessary in order to align the definitions and scopes with those used in this study. The definitions (such as what is excluded/included in ELT) is explained in the chapter Glossary of terms used of this document. Nevertheless, the following elements must be taken into account when analyzing the data included in this study: - The following is NOT considered as ELT and will therefore be excluded from data: retreadable tires, second-hand tires and tires exported with used cars. This change in scope is the main reason why some of the - The ideal target scope for this study includes all types of tires: passenger car, truck, and airplane, agricultural, two and three-wheel as well as off-the-road (OTR) tires. Nevertheless, the data presented hereafter is limited to the scope of each source of data found. Passenger cars, bus tires and truck tires are included in all of the country/region data (these are the most significant quantities in terms of units of ELT generated). OTR tires (an important category because of the significant weight per tire) and the other categories are not always included in the source data. The completeness of data with regards to our target scope is evaluated in each country/region report. Where possible, the missing ELT categories are specified. See Table 1 for details. Global ELT Management A global state of knowledge on collection rates, recovery routes, and management methods, January Published June 2018.
12 - In order to help the reader assess the degree of reliability of the data, a level of confidence on data is expressed by a color code ( ) depending on its reliability. Please refer to Table 1 for more details. A cross analysis of data consistency between different sources has been performed to conclude the data reliability. Regarding the quantity of ELT generated, the data collected at the local level has been compared with the data estimated based on the number of vehicles in use published by OICA (2015 data). In case of significant inconsistency and where the level of credibility is deemed equal, the data which gives the lower recovery rate is used as a precaution to avoid overestimation. - In order to further analyze the consolidated data, the different Recovery Routes have been grouped within the following three categories: material recovery (excluding civil engineering & backfilling), energy recovery and civil engineering & backfilling. Although for some Recovery Routes, the split between material and energy recovery is debatable, we have calculated the tons of ELTs recovered based on the following assumptions: Tons of ELTs used in cement kilns: 75% energy recovery and 25% material recovery 4; Steel production (except when ELT is burnt as a TDF): 100% material recovery; Pyrolysis: 100% material recovery; When recovered through an unknown Recovery Route, or when data available regarding exportation of shredded tires: 50% energy recovery and 50% material recovery. 4 Based on ETRMA, End-of-life Tire Report
13 Table 1. Level of confidence on the data used by country/region Country Australia Canada Europe Japan South Korea USA Argentina Brazil China Mexico Level of confidence in data Data from recognized source with a robust consolidation methodology Data from recognized source with a robust consolidation methodology Data from recognized source with a robust consolidation methodology Data from recognized source with a robust consolidation methodology Data from recognized source with a robust consolidation methodology Data from recognized source with a robust consolidation methodology Data from different well recognized sources based on estimations, but remain consistent Data from different well recognized sources based on estimations, but remain consistent Data from a recognized source based on estimations Data from different well recognized sources based on estimations, but remain consistent ELT categories missing or exluded from sources The source does not mention if the ELV tires are included. Exported for reuse and retreading was exluded Data does not include OTR tires and exports (retreading was excluded) Data does not include the ELV tires Data does not include imports of ELT. Retreaded tires were exlcluded No apparent gap Data does not include OTR, agriculture tires, aircraft tires and bicycle tires Imported vehicles, OTR, agriculture tires, aircraft tires and bicycle tires The source does not presice if the ELV tires are included Passenger cars, trucks and light vehicles included (retreading excluded) Data does not take into account the illegal importation of ELT Morocco Data from a well recognized source based on estimations No scope detailed in source New Zealand Russia South Africa Thailand India Indonesia Malaysia Saudi Arabia Data from a well recognized source based on estimations but consistent with other sources. Data from different well recognized sources based on estimations, but remain consistent Data from a well recognized source based on estimations Data from a well recognized source based on estimations Data estimated by interviewees during the interview process. This is considered the best available data. Data estimated by interviewees during the interview process. This is considered the best available data. Data based on estimations and inconsistent with other sources. This is considered the best available data. Data estimated by interviewees during the interview process. This is considered the best available data. No apparent gap Data does not include the ELV tires Data does not include OTR tires and exports Imported vehicles, OTR, agriculture, aircraft and bicycle tires. Export and import of retreaded tires were excluded. No apparent gap Data does not include the ELV tires No scope detailed in source No scope detailed in source Ukraine Data based on estimations and inconsistent with other sources. This is considered the best available data. No scope detailed in source 11
14 Countries ordered firstly by color coded level of confidence in data and then alphabetically within each of the three levels 12
 civil engineering as water retention basins, tire derived aggregates for road construction, etc.")
15 Summary and cross-analysis of the ELT markets There are many different ways to recover ELT that can be grouped into the following three categories: Material recovery Energy Recovery Civil engineering and backfilling: tires can also be used in 1) civil engineering as water retention basins, tire derived aggregates for road construction, etc., and 2) as backfilling (land rehabilitation or backfilling in mining sites). This distinct category is made because it is debatable whether these two ELT end-sources should be considered as a means to recycle tires (especially when referring to backfilling in mining sites). According to the data collected during this study, the total amount of ELTs recovered in the 19 countries and the European (ETRMA scope) region amounts to approximately 17,158 kilotons per year and 17,712 kilotons per year if we consider civil engineering and backfilling as a Recovery Route. The overall amount of ELT generated in these countries is estimated to be 25,676 kilotons. The countries that recover the most ELTs in volumes are China, India, United States and Europe as illustrated in Figure 2. However, the number of ELTs recovered per year in a given country needs to be put into perspective with the amount of ELTs generated. The recovery rate (Total tons of ELT recovered / Total tons of ELT generated) seems to be the best indicator to analyze the performance of the ELT market in a given region. For this study, two different recovery rates are calculated depending on whether civil engineering and backfilling is considered as a Recovery Route. In the recovery rate where it is not considered as such, the amount would be considered as non-recovered or equivalent to landfill disposal. The distinction is made since considering these two ELT end-markets as a means of material recovery is debatable (especially when referring to backfilling in mining sites). As can be seen in Figure 3, in Australia, where nearly 126 kilotons of ELTs are backfilled in mining sites each year, the recovery rate drops from 65% to 31% when taking the most conservative approach. According to the collected information, Canada has the highest recovery rate (111% in 2015) since according to CATRA (the Canadian Association of Tire Recycling Agencies), all ELT are recovered. Annual recovery rates exceed 100% when there is a delay in treatment. The rate in 2014 was below 100%. India has the second highest recovery rate (98% in 2015) with around 60% of the recovery done on informal secondary markets such as artisanal products, use on fishing boats, roofs-tops or swings. According to ATMA (Automotive Tyre Manufacturers Association), ELT are seen as a valuable material in India. In the future, in the context of a growing middle class, this Recovery Rate might decline. South Korea s recovery rate was 95% in 2015 with 157 kilotons of energy recovery and 94 kilotons of material recovery. Europe s recovery rate (ETRMA scope) was 91% in with 1,670 kilotons in material recovery, kilotons in energy recovery and 122 kilotons in civil engineering, public works and backfilling. Figure 2. Total ELT recovered in the scope and distribution by country/region. ELT recycling markets worldwide are mainly driven by the regulatory context in each country. Government regulations are enacted to address environmental issues related to illegal dumping or importation of ELT as well as historical stock piles leading to public health and sanitary issues (e.g. fire hazards, breeding ground for 5 Unlike ETRMA statistics for overall recovery rates, this study focuses on End of Life Tires rather than Used Tires. Consequently quantities processed through retread, reuse and export are not included in the scope for this study, effectively reducing the recovery rate. Global ELT Management A global state of knowledge on collection rates, recovery routes, and management methods, January Published June 2018.
16 mosquitoes and vermin, and the current issue of the Zika virus etc.). In some countries, the role of the government is limited to the organization of the ELT stakeholders, or can be more interventionist regarding financial and technological development of the sector. Globally speaking, the development of ELT recycling markets is still quite recent. Although some Recovery Routes are more profitable than others and examples of success stories exist in some regions (i.e. in the state of California), taken as a whole, the ELT market has been struggling to be profitable and self-sufficient. Financial support with a formalized ELT management system is very often an important factor to increase the competitiveness of the industry and achieve high recovery rates. Different ELT management systems exist at the national level. Within the scope of our study, three main systems have been identified: Extended Producer Responsibility (EPR) system or take-back obligation system: In this system the responsibility for collecting and ensuring treatment of ELT is imposed on the actors that put new tires onto the market (tire manufacturers and importers) through an eco-fee. This is a very common configuration in European countries, and is also used by Brazil, South Africa and South Korea and recently by Russia as well as Ukraine (where the implementation are still ongoing). The system usually involves these actors setting up a non-profit organization (or Producer Responsibility Organization) that manages the collection and recovery of the end of life product. The extra cost is generally passed onto the consumers, with an environmental fee (eco-fee) added to the product price. Government responsibility financed through a tax: In this system, the responsibility lies with the state and collection and recovery are financed by a tax on production which is passed on to the consumer. The few countries that run such a system include, Denmark, Slovakia and Croatia (in the Europe ETRMA region). Figure 3. Recovery rates by country/region Regulation or intervention of public authorities A minimum level of intervention from the government is very often necessary in order to properly develop the ELT recycling industry. Free market system: In this system, the state or federal legislation may set action plans (qualitative objectives) or obligations to have an ELT Management Plan (e.g. Mexico), however responsibility (eco-tax or eco-fee) is not imposed upon particular actors. The countries with this system are Argentina, China, India, Indonesia, Japan, Malaysia, Mexico, New Zealand, Saudi Arabia, Thailand and the United States. A comparative table of the different ELT management systems/schemes is shown in Table 2. 14
17 Table 2. Comparative table of ELT management systems/schemes Responsible actor(s) Governance Funding Key features 01 Free market system Under a free market system, the legislator enacts objectives to be met, however there are no responsible parties directly designed. Usually no dedicated organization, ELT issues are covered by more general waste-related regulation and governance system. However, the existence of an industry association in charge of promoting responsible ELT management is common practice No regulated eco-fee collected for ELT management; free market - Minimum State intervention - Less Producer involvement - Market forces being the main driver for ELT management, i.e. the most mature and costeffective Recovery Routes representing the biggest share of the market; - Cooperation of companies on a voluntary basis to promote best practices - More difficult for more environmentallyfriendly Recovery Routes to develop, if not economically interesting at the beginning 02 Tax system Under a tax system, the State is responsible for ELT recovery. The State is responsible overall for the organization of ELT management and remunerates the operators in the recovery chain. ELT management financed through a tax levied on tire manufacturers and importers and paid to the State, and subsequently passed on to consumers. - The State guarantees a level playing field by enforcing the same product standards on all tire producers; - Taxes may have the effect of favoring more environmentally-friendly Recovery Routes (e.g. Global ELT Management A global state of knowledge on collection rates, recovery routes, and management methods, January Published June 2018.
18 material recovery over energy recovery) and prohibiting landfill. 03 Extended Producer Responsibility (EPR) system The producer of tires (manufacturer or importer) is held responsible by law to organize the ELT management, with targeted volumes defined based on the quantities of tires put onto market Producers can either set up their individual management system or gather to set up a Producer Responsibility Organization (the latter representing the majority of cases). The Organization is in charge of managing the collection and recovery of a volume of ELT defined by regulation. ELT management financed through an eco-fee on manufactured and imported tires, paid by Producers, usually passed on to consumers The amount of the eco-fee depends on the cost related to ELT management and the secondary markets. It usually decreases over time, as the ELT management gets more and more mature and economically efficient. - Cost optimization enabled by the creation of Producer Responsibility Organizations - Better data traceability through reporting obligations - Better transparency on how the eco-fee is used - Producer Responsibility Organization having the flexibility to determine the most costeffective solutions to recover ELT or to favor the most sustainable options - Lack of competition in some countries for the ELT market with the creation of Producer Responsibility Organizations In practice, hybrid systems can be implemented. For instance, the United States operates generally under a free market system, however some States can spontaneously influence markets with grants, taxes and subsidies. In addition, other variants of these systems also exist. For example, in Canada, a Product Stewardship Scheme has been implemented. Under this scheme, an eco-fee is paid by the Producers (passed on to consumers), however they are not directly in charge of the ELT management. A governance structure with a stakeholder advisory board constituted of various stakeholders representing the tire industry and municipal interests, environmental interests, professional engineers, etc. They are in charge of allocating the funds to support the development of the most promising Recovery Routes. A strong focus has been put on material recovery options. The free market system presented above refers to countries where a legal structure has been defined for ELT management. In countries with weak regulation or non-existing regulation related to ELT management, the recycling market may still be freely developed with an important proportion of informal sectors on a small scale when ELT represents a source of value, leading to illegal operations with sanitation, environment, fire and safety risks. 16
.")
19 Whenever an EPR system or Product Stewardship program exists, there is usually an organization at national/state/province level in charge of the ELT coordination. Similar organizations exist in a free market system when legal regulation requires coordination between actors (such as the Mexican Management Plans for example). Usually, these organizations are created by the tire manufacturers. The eco-fees or taxes, paid by manufacturers or consumers, are therefore used by the dedicated organization to finance the following activities: cut or Collection, transportation, shredding/granulation, gate fee for granulators; Development grants and loans, R&D and partnerships to develop new markets for recycling; Subventions to encourage certain Recovery Routes that would not be profitable otherwise; The construction of treatment plants that in turn are sold on at a low price in order to increase recycling capacity and decrease the initial investment costs for recyclers (e.g. South Africa); Public awareness raising; Stockpile abatement (e.g. New Jersey, New York, USA) and illegal dump site cleanup (e.g. in the USA); ELT program management (licensing, enforcement, inspections), administration of ELT collection (e.g. in the USA); Tire fire cleanup (e.g. in Arizona, USA); Mosquito control (e.g. in Florida, USA); Air pollution control (e.g. in California, USA). Of course, how the fees are used can vary from one system to another. In free markets, there is a greater focus on raising public awareness in order to respect the competitiveness of the market. In more interventionist systems, regulations will favor some Recovery Routes over others (for example, material recovery over energy recovery for Russia, the EU, Canada, South Korea, and California in the USA). There can be issues related to competitiveness when different systems are set up in broader regions. For instance, French granulators benefit from the financial support with the eco-fee paid by tire manufacturers (collection fee, gate fee), while the ELTs are managed under a free market principle in Germany. In case of a free market, energy recovery can be a very efficient way to deal with high volumes of ELT since it helps to get rid of long-standing stockpiles easily and requires relatively low investment. This is because whole, shredded tires can be directly used as an alternative fuel. Figure 4. Lansink s Waste Hierarchy Ladder Nevertheless, as a general trend, once a country has established a more mature approach to ELT management, material recovery is often supported through policy-making. This evolution is in line with the waste hierarchy ladder (see Figure 4) and Circular Economy principles. This option is considered preferable in terms of environmental impact assessment and resource efficiency. Although material recovery might require more initial investments, R&D efforts or partnerships with actors from new industries, it also generates products with higher added-values. The ideal long-term vision for the ELT industry would be to find new or existing markets for ELT recycling that could help prioritize high-value products in order to generate enough revenue for the industry to be selfsufficient. Some countries have very low awareness of the environmental and public health risks related to ELTs, including the public authorities themselves. An important volume of tires is therefore simply dumped on the side of the road or abandoned in fields. There is also a considerable but unquantifiable amount of ELTs burnt or commercialized in black markets. This results in squandering of resources and a catastrophic impact on environment and public health through mosquito transmitted-diseases, fire hazards, or lack of pollution abatement system, etc. In these countries, the government has a crucial role to play. A push from public policy makers is needed in order to educate the general public and public officers and set up a system to deal with ELTs properly. Likewise, it is key to enforce sanctions of illegal activities and provide adequate investment for the resources needed to carry out inspections and enforce regulations. Global ELT Management A global state of knowledge on collection rates, recovery routes, and management methods, January Published June 2018.
20 Developing countries often lack high technology recycling factories, expertise, technical know-how and facilities to handle ELTs. These countries could use the support from more experienced actors in developed countries in order to leapfrog to a successful ELT market. Figure 5 and Figure 6 show the tons of ELTs generated by country/region and the way that these ELT have been recovered according to the three main categories: material recovery, energy recovery and civil engineering & backfilling. 18
21 6 Figure This information 5. ELT Generation has been and recovery modified by for country/region some countries (map) in 6 order to align definitions and units. Please refer to the limitations of this chapter. Global ELT Management A global state of knowledge on collection rates, recovery routes, and management methods, January Published June 2018.

")


22 Canada 0.4 Mexico 0.3 United States 3.5 Morocco 0.1 Europe 3.2 Ukraine 0.2 Saudi Arabia 0.3 Russia 0.7 India Thailand China 10.3 South Korea 0.3 Japan Malaysia 0.3 Indonesia Brazil Regions Coverage by region: vehicles in use (in thousand units), Source: OICA Total Vehicles in use Vehicles in use for countries covered Coverage Europe 387, ,178 98% NAFTA (Canada, Mexico, US) 324, , % Central & Latin America 88,962 56,480 63% Asia/ Oceania/ Middle East 436, ,919 85% Africa 44,803 13,170 29% World 1,282,270 1,143,510 89% Argentina 0.1 ELT categories South Africa 0.2 Civil Engineering and backfilling Energy recovery Material Recovery Other (not recovered - landfilled, stockpiled or unknown) Units: Million tons (metric) 31% TOTAL 2% 20% % Australia 0.4 New Zealand
23 Figure 6. ELT Generation and recovery by country/region (graph) 6 21
24 Summary for each region/country A brief summary of the current state and local context surrounding ELT management in each country/region is given below. The countries are listed in alphabetical order. Argentina Global ELT Management A global state of knowledge on collection rates, recovery routes, and management methods, January Published June 2018.

25 Australia Brazil 23


26 Canada China 24
 India")
27 Europe (ETRMA scope) India 25

28 Indonesia Japan 26
29 Malaysia Mexico 27
30 Morocco New Zealand 28

31 Russia Saudi Arabia 29

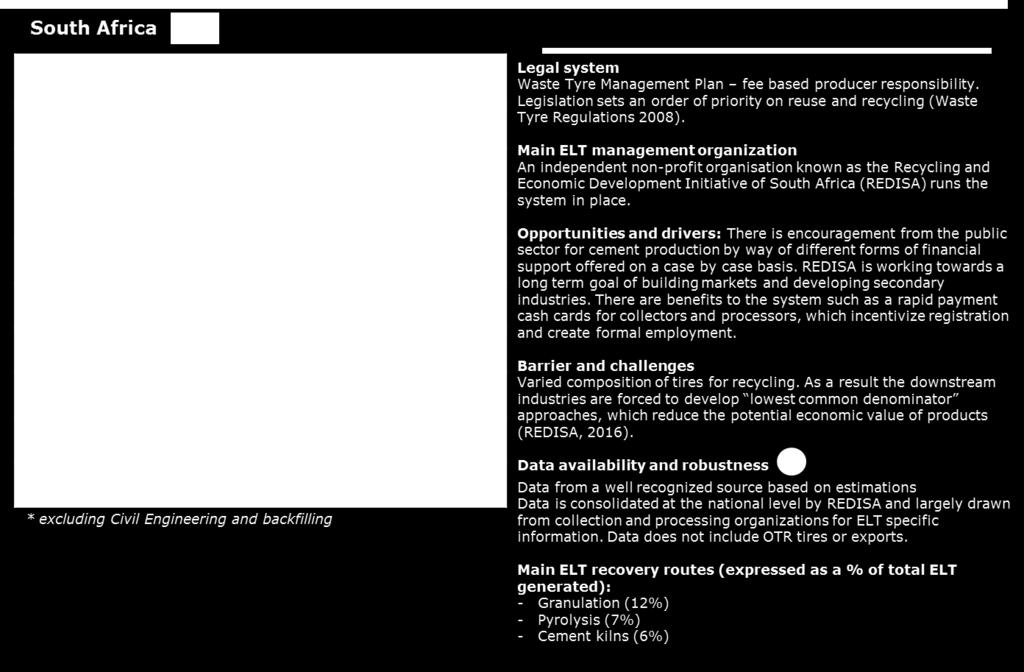

32 South Africa South Korea 30
33 Thailand Ukraine 31

34 United States 32
35 State of Knowledge on Recovery Routes The purpose of this chapter is to present an overview of the State of Knowledge (SOK) on the main Recovery Routes that exist worldwide for ELT which have been divided into six different categories according to the end markets: Tire Derived Fuels (TDF), including ELT used in cement kilns, pulp and paper mills, and ELT burnt as fuel for energy generation, pyrolysis & gasification, civil engineering & backfilling, steel production, reclaim rubber, Tire Derived Materials (TDM), such as ELT in the form of granulate and powder used for the production of new tires, playground mulch, sports surfaces, molded objects, shoes, etc. Summary and cross-analysis of Recovery Routes A brief summary of the current state of knowledge is given below. Overall, 86% of the ELT recovered (in tons) by the countries/regions included in our study are concentrated in three main categories of Recovery Routes: production of TDM with 33%, TDF (31%), and reclaim rubber (22%). It must be noted that cement recovery (with 2,796 kilotons) accounts for 16% of the overall recovery (or 51% of TDF). Although the two first categories (TDF and TDM) are rather well spread at the global level and used as one of the main Recovery Routes in a large number of countries, the production of reclaim rubber is mainly developed in Asian countries: especially China, and in other countries such as India, Japan and Thailand. it s the main Recovery Route in China (34% of the total domestic recovery market) that represents about 88% of the total reclaimed rubber in the scope of the study and 20% of the total ELT recovered (including civil engineering and backfilling). The remaining 14% of the ELT recovered (in tons) by the countries/regions included in our study is mainly shared between pyrolysis & gasification and civil engineering & backfilling. Pyrolysis is one of the most important Recovery Routes in the following countries: China, Indonesia, Mexico and Thailand, while it remains very marginal in other countries. The market for civil engineering & backfilling is concentrated in certain countries and regions: Australia, Brazil, the USA and a few countries in Europe. In particular, it represents 35% of the domestic market in Australia and 8% of the domestic market in USA, which makes up an important volume at the global level. Currently, the use of ELT in steelworks represents less than 1% of the overall market for the studied scope. It remains a marginal Recovery Route for all countries reviewed. Focus on some Recovery Routes Cement recovery is very successful because of: 1) the capability of cement plants to integrate important volumes of tires in the process either whole, cut or shredded; 2) the fact that the cement companies often have a grid of production sites distributed around countries (which reduces the cost of transportation) and 3) the fact that it is an economically viable market with a sufficient degree of technological development. Therefore, cement plant operators can switch from traditional fuels to TDF depending on: 1) availability of supply and feasibility of logistics, 2) public authorization, 3) amount of investment required. Regarding material recovery, overall, the main products and applications are granulates used for artificial turf infill, playgrounds, and athletics tracks. Some of the other material Recovery Routes such as rubber modified asphalt (e.g. Brazil, ) and molded rubber products (e.g.brazil, Canada, India, USA) are becoming increasingly significant; however, the development and importance of these applications varies across the globe. China is mainly using rubber powder for asphalt applications, and the government has introduced a 50% VAT reimbursement on the collection of ELT and on 33
 a financial incentive to improve the environmental footprint of ELT recycling (CTRA, 2016).")

36 retreaded tires and powdered rubber products matching technical and quality criteria such as the use of certain raw materials or ISO accreditations (ISO 9000 for quality and ISO for environment) a financial incentive to improve the environmental footprint of ELT recycling (CTRA, 2016). One of the main difficulties in the promotion of new Recovery Routes is convincing companies to use new materials other than those they are familiar with. The rubber modified asphalt appears to be an appealing option with interesting mechanical and physical properties. There is however a certain level of reluctance from more traditional actors in the road industry in some countries to adopt the technical process required. The principal obstacle is deemed to be the relatively higher short-term cost and a lack of attention to the long-term benefits of durability in particular. Life cycle analysis should be conducted to analyze the full long-term costs of the different options. Figure 7. Distribution of all energy recovery by country/region For instance, in Australia, many tenders in the construction industry specify products rather than outcomes, which is an additional impediment to expanding ELT in civil applications. Therefore, efforts are required to find the right partners and support them in change management. Another difficulty is guaranteeing the quality of the TDM. The lack of standardization in terms of quality requirements can be an additional challenge to entering new markets and convincing new actors. For instance, the lack of product homogeneity and standardization for reclaim rubber is one of the reasons why this option is not well developed at the global level. Steel and fiber can be generated as standalone byproducts during the ELT granulation or other preparation phases. The recycling of these by-products is not always properly handled today, while there is an important potential to be explored to get more profit from these byproducts, especially for steel that can be sold for a high price. Figure 8. Distribution of all material recovery by country/region Analysis of Recovery Routes by country/region The distribution of all energy, material and civil engineering & backfilling by country/region is shown in Figure 7, Figure 8 and Figure 9 respectfully. Please note that the following Recovery Routes are considered as material recovery in the followings figures: pyrolysis and gasification, Steel production, reclaim rubber, granulate and powder (TDM). 34

37 Figure 9. Distribution of all Recovery through civil engineering and backfilling by country/region Out of the countries studied, the most significant quantities of ELT processed through material recovery in descending order are China (5,480 kilotons), India (2,095 kilotons), Europe (1,670 kilotons) and the USA (1,215 kilotons) (Figure 8). For energy recovery the largest quantities are processed in the USA (1,616 kilotons), Europe (1,097 kilotons), India (600 kilotons), Japan (579 kilotons), Indonesia (345 kilotons). On a global scale, the market for civil engineering & backfilling is concentrated in few countries and regions: USA (297 kilotons), Australia (129 kilotons), and Europe (122 kilotons). 35