Developments in Renewable Energy Sector: Current Trends & Future Prospects. IIT Kanpur 2nd May, 2018
|
|
|
- Mark Thompson
- 5 years ago
- Views:
Transcription
1 Developments in Renewable Energy Sector: Current Trends & Future Prospects IIT Kanpur 2nd May, 2018


2 India s per capita energy consumption is 1/3rd of the World s average India Brazil World China South UK EU Japan France Germany OECD Sweden Russia US TOE/Capita Mwh/Capita IEA Report
3 World Bank Report
4
5

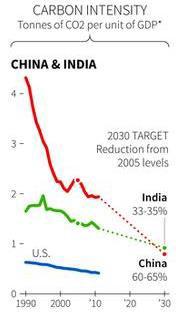
6 Climate Action Tracker


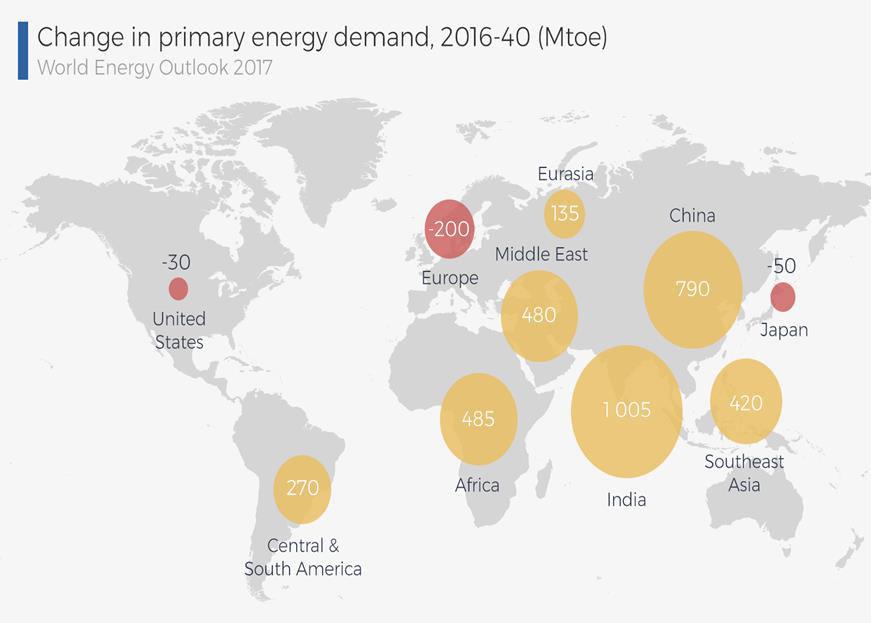
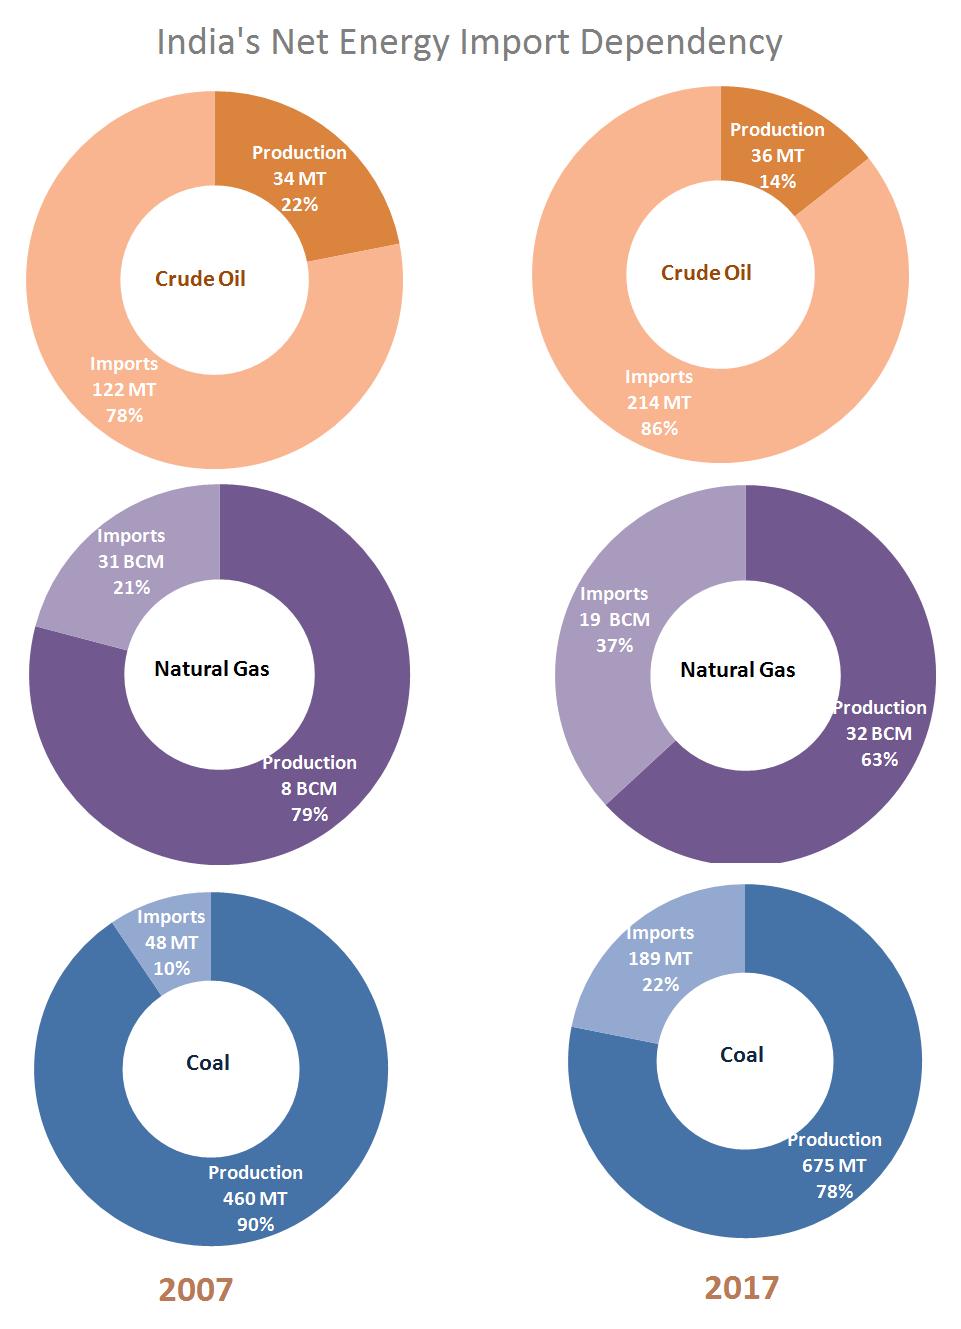
7 Energy Security High oil imports more than 80% during Climate Change concerns Growing Energy Needs Coal imports 225%; Gas imports 37% Energy sector accounts Economic growth, Rise in Population, Urbanization Energy sector accounts for more than 60% of total GHG emissions By 2030 Energy Demand would have doubled & Electricity demand would have tripled Fossil fuel constitutes around 90% of the primary energy supply Energy Access & Electrification 300 million people with limited or no access to electricity 50% of people still use biomass for fulfilling their energy needs Per capita income low compared to developed economies Major goals Increasing enphasis on Renewable Energy 175 GW by % share by 2030 Universal electrification & 24 x 7 power supply; Clean cooking for all Raising the sharing of manufacturing in GDP to 25% Reduction of oil imports by 10% NDCs target at reduction of emission intensity by 33-35% in 2030 Draft Energy Policy, 2017

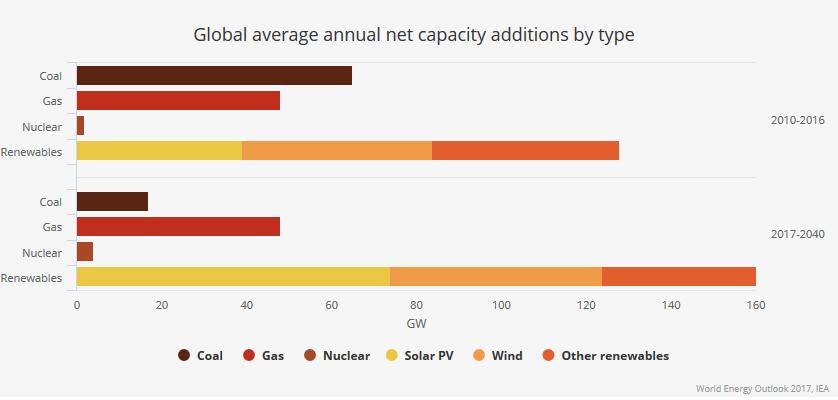
8 Energy Mix Ambitious Energy Path Emphasis on addition of Renewables & Energy Efficiency Generation Mix 2012 IESS, Niti Aayog 2040
9


10 Source-wise RE Capacity Addition as Mar, 2018 Break-up of Renewable Energy as Mar, th Largest wind power capacity in the world 6th largest solar power capacity in the world

11 Tamilnadu, Karnataka and Maharashtra are
12


13 All the regions receive 4-7 kwh of solar radiation per sq mtrs with about 2,300 3,200 sunshine hours/year 5000 TWH/Year Unlimited scope for solar electricity to replace all fossil fuel energy requirements
14 Increased Competition Feed-in-Tariff vs. Reverse Auction Lower EPC Cost Reducing per watt cost of Solar PV modules Improved Payment Security Mechanism Payment security with NTPC & SECI as offtakers 3 month payment guarantee in case of delays Entry of large financially-strong conglomerates Strong Balance Sheets & International experience closer tie up with module supplier Access to cheaper funds Interest rates have come down recently across the globe Govt. Subsidies & Support Land acquisition, Inter-state transmission charges & losses, Generation based Incentive, Solar Park Plug & Play etc.
15
16

17 Solar Park Concentrated zone of development of solar power generation projects capacity of above 500 MW Land required for development of Solar Power Projects be identified and acquired Various infrastructure like transmission system, water, road connectivity and communication network etc. shall be developed Solar Energy Corporation of India (SECI) shall develop these solar parks will be developed in collaboration with the State Governments.


18 Merit of REC Mechanism RE Infirm in nature scheduling challenges Uneven resource distribution - Surplus States & Deficit States Difficulty in arriving at Preferential Tariff
19 Issues with REC Market Huge inventory of Solar & NonSolar Supply has been more than supply trading usually happens at floor price Recent reduction of floor price by CERC appealed in Supreme Court/APTEL
20 Volume of non-solar REC trading has gone up in recent months
21 Non-compliance of Discoms in meeting RPO obligations


22 Variability & Uncertainty in the Supply Side disrupts the conventional method of planning the daily operations of the Grid

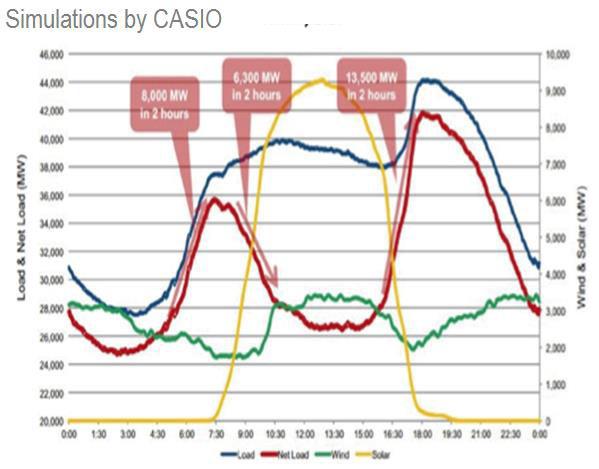
23 Duck Belly Syndrome


24 Steep ramping and may create imbalances in the system New considerations Balancing requires more flexibility More reserves More transmission better planning More Grid maintenance at additional cost Existing generators would run less affecting the cost recovery Higher the RE penetration higher the flexibility required
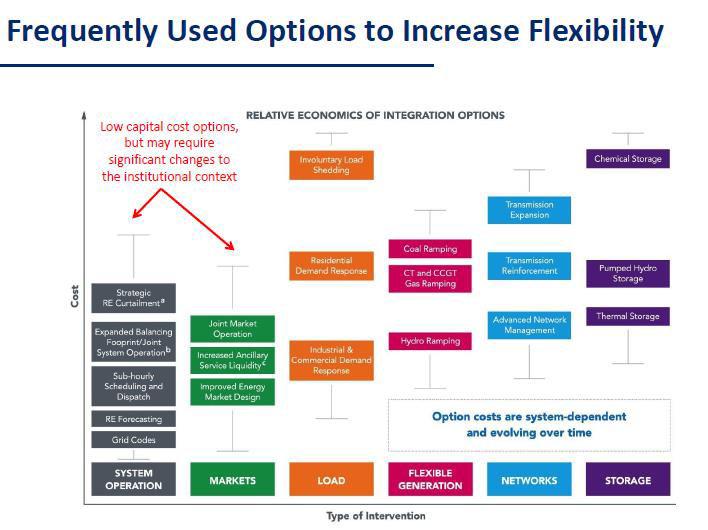
25 Better forecasting & prediction Law of Large Numbers Renewable energy shall becomes more predictable with the increase in number due the effect of geographic diversity Use of advanced technology/data analytics/ai for making accurate forecasting Interconnected Network Mix of sources Mix of sources complementing with each other e.g. continental wind energy tends to peak at night whereas solar will peak during day time Interconnect geographically dispersed technologically diverse renewable generation to smooth out the fluctuations Demand Response Market Design Market should provide the signal that would incentivize the electricity generation at the right time & space Demand side management to shift flexible loads to a time when more energy is available Storage Solution Storage solution viz. pumped hydro, electrochemical batteries, hydrogen, compressed air etc. during surplus time and use it during deficits
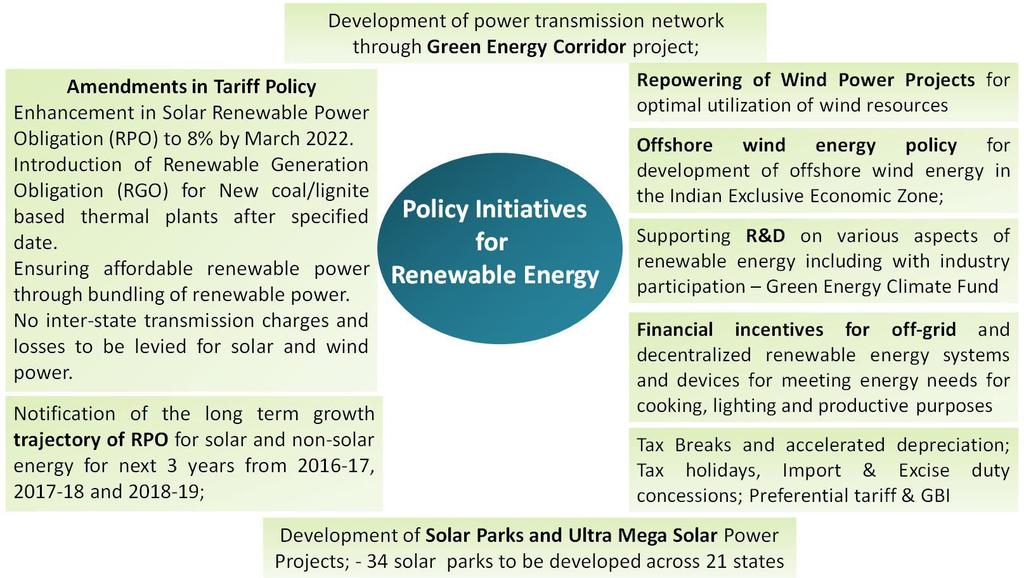
26 Initiatives Green Energy Corridors Wide Area Measurement Integration of renewable resources through Strong Grid connections, enlarging balancing areas etc. Enhanced situational awareness, Better visualisation of grid parameters, Stable operation of Grid Renewable Energy Renewable forecasting, SCADA for RE generation, Scheduling of Management Centres RE Battery Energy Storage Systems Testing of different battery technology
27 Enabling Framework for Renewable Integration Renewable Purchase Obligation and Renewable Energy Certificates Implementation for frequency response Regulation Regulatory framework for Forecasting, Scheduling and Deviation Settlement of Renewable generation Regulatory framework for Reserves Regulatory framework for Ancillary services operations
28


29 Roof Top Solar Plant India has set a path to achieve 100 GW power capacity through grid-connected solar energy, out of which 40 GW is targeted to come through rooftop solar installations by 2022 Benefits - for a developer - reduced land and interconnection costs, higher tariffs due to increasing commercial and industrial tariffs, and increased profitability. Roof top vs. Ground mounted Benefits Discoms - reducing the peak demand during daytime and decreases transmission and distribution (T&D) losses as the power is consumed at the point of generation According to PwC analysis, more than 10,000 MU of electricity will be saved as avoidance of T&D losses alone in year 2022 alone if 40 GW rooftop PV is achieved. Limited success in India around 3 GW capacity till March, 2018
30 Global Scenario - Key Initiatives to Promote Rooftop Solar Countries/Particulars Germany Japan Incentive Structure Feed In periodically) Long Term Project Visibility Long Term FIT Guarantee Streamline Interconnection & approval processes Public Participation to enhance financing Tariff (updated Capital Subsidy Renewable Obligations USA (California) Purchase Soft Financing Streamline Interconnection & approval processes Capital Subsidy Tax Credits/Rebate Third Party Service Providers; Assume risk and performance of systems Metering Arrangement Gross Metering initially Shifting to Net Metering Net Metering Net Metering Implementation Models Income from preferential tariff Savings in electricity bill Savings in elec. Bill for rooftop owners Tax benefits to project developers Reasons for Program Structure Higher retail tariff & promotion of captive consumption were key factors for net-metering Net Metering facilitated development of decentralized solar systems with limited co-operation from utilities 30 FITs to encourage solar project development independent of captive load of consumer
31 Major Bottlenecks Lack Of Cheap Finance Weak Credit profile of consumers, non-ability to provide collateral Weak Infrastructure of DISCOMs Infra not geared for absorbing energy from rooftop Low voltage lines extended over large distances Mitigated through entry of Multi Lateral Agencies World Bank $500MN to PNB & $625MN to SBI Voltage Issues; Poor Quality Power Transformer Capacity limiting implementing of netmetering. 100 KVA transformer req. Rs lakh Poor Financials limiting expansion plans Delay in Receiving Subsidies Lack of incentive for DISCOMs MNRE has entrusted SECI with implementation of large scale grid connected rooftop systems Industrial/commercial segments are major sources of revenue for DISCOMs Subsidy from National Clean Energy Fund Delay of six months in receiving same Tariffs ~20-50% higher than avg. cost of supply and almost twice than of agri/residential customers Bureaucratic hassles Loss of rev. for DISCOMs if large commercial est. uses electricity generated from Solar Rooftop
32 Major Bottlenecks Grid Availability Grid variability with rising RE penetration Mitigated through battery back-up Steep declining battery prices Enforeceability of Contractual Obligations Restricts development in residential complex Issues in enforcement of lease agreements & PPA Mitigated through granting access rights to sight, amending building byelaws etc. Open Access Issues Imposition of cross subsidy surcharge/wheeling charges etc. for open access to RE generators State DISCOMs do not allow reduction in contract demand to the extant of renewable capa. Penalize customers for utilization below 70% of max. demand Inability to ensure rooftop rights for long period Lack of Consumer Education Consumers not aware of govt. incentives for implementing rooftop solar Loan up to Rs. 10 lakh Tax Benefits Benefits due to net-metering
33 Policy initiatives Capital Subsidies: Capital subsidy of 30% is applicable to residential, institutional and social sector rooftop solar power plants for General Category States/UTs and Upto 70% of the benchmark cost for Special Category States i.e. North Eastern States including Sikkim, Uttarakhand, Himachal Pradesh, Jammu & Kashmir and Lakshadweep, Andaman & Nicobar Island. Tax Benefits: Direct and indirect tax benefits such as sales tax, excise duty exemptions and custom duty exceptions have been given. Project developers were exempted from income tax on all earnings from a project in its first 10 years of opera-tion and accelerated depreciation (AD) for solar energy producers to claim 40% of the costs in the first year itself. Renewable Energy Certificates (RECs): RECs are tradable certificates that provide an incentive to those who generate green power by providing financial incentives for every unit of power they generate. The solar PV rooftop is eligible for issuance of renewable energy certificate (RECs) as specified under Central Electricity Regulatory Commission. Assured Power Purchase Agreement (PPA): The electricity generated from solar PV rooftop could be entirely fed into the grid at regulated feed-in-tariffs (FiT). State utilities guarantee the purchase of solar power through a PPA which offers a high price equal to that of the peaking power on demand for the solar power which is secondary power or negative load and an intermittent energy source on daily basis. Net Metering Incentives: The electricity generated could also be used for self-consumption with the net metering approach. A net metering mechanism allows for a two-way flow of electricity wherein the consumer is billed only for the et electricity supplied by the DISCOM.
34 Rooftop Operational Model CAPEX Model Suitable for: Consumers having adequate manpower Expertise in O&M Rooftop access concerns Availability of Funds upfront Can take advantage of net metering in case of excess generation RESCO Model Suitable for: Lacking expertise in O&M No rooftop security concerns Prefer to pay on monthly basis rather than upfront As on Dec 31, 2016: CAPEX 84%; RESCO 16% RESCO gaining ground quickly 34

35 Rooftop Operational Model - CAPEX 35

36 Rooftop Operational Model RESCO (Ren. Energy Service Co) 36
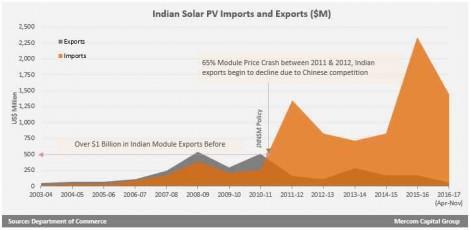

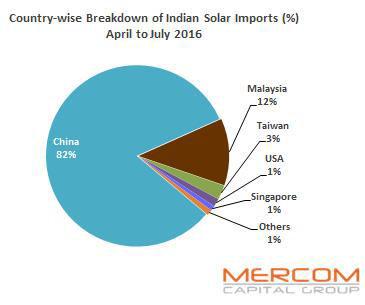
37 Solar PV Manufacturing

38 I dia s present module manufacturing capacity is around 5.7GW; however, cell manufacturing is still lagging behind with only 1.4GW of manufacturing capacity. Market not manufacturers available for domestic current price of an Indian cell is R17-19/Wp, which is 10-15% more than an imported one. unavailability of upstream supply chain (polysilicon/ingot/wafer) facilities in India. The technical know-how to set-up such facilities in India are lacking Reasons behind the slow growth trend of cell manufacturing capacity additions are unavailability of raw materials, lack of technology know-how, lack of large-scale demand for domestically manufactured cells, and unskilled technical workforce.
 in imported PV module prices, if sustained, could have an")
39 Manufacturing of Solar PV The recent increase by about 15% (i.e. 6-7 cents/watt) in imported PV module prices, if sustained, could have an adverse impact on the viability of solar power projects with tariffs lower than 3.5 per unit,
40 Govt. Initiatives Concept not - di ect fi a cial suppo t of Rs, crore a d a technology upgradation fund the Mi ist y also p oposes to e i e the do estic co te t e ui e e t DCR sche e, hich ese ed a slice of the a ket fo locally ade cells a d modules Ministry of New and Renewable Energy aims to provide a 30 percent subsidy for setting up new plants and expanding the existing ones, according to a concept note on its website An integrated policy for manufacturing of solar equipment is required Introducing favourable policies for domestic solar manufacturing, driving innovation through R&D support in the sector, focusing on skill development-

41 Other initiatives National Open Access Registry automate the open access approval process transparency & efficiency market will get strengthened

42 Other initiatives Cross Border Regulation integration with South East & East Asia diversity in generation import of renewables grid integration will provide additional security/inertia to the grid

43 Other initiatives Introduction of Electricity Derivatives Market Faster scheduling reducing the market window for reduction in reserves requirement Strengthening the intra-day market to suit the requirement of renewable energy
44 Thank You