Waste Composition: Sorting Out Program Impacts. Recycling Council of BC, June 2017
|
|
|
- Lucinda Parker
- 5 years ago
- Views:
Transcription


1 Waste Composition: Sorting Out Program Impacts Recycling Council of BC, June 2017


2 Agenda Organics and Food Waste Measurement Standards Measuring Methods Waste Composition Methodology Provincial Waste Composition Waste Stream Analysis Results Analysis Sources: Tetra Tech, 2014, 2016


3 Retail Distribution Processing Generators Education Source Reduction Onsite Processing Depackaging MRF Production Climate Change Adaptation Renewable Energy Improve Soil Health Offset Chemical Fertilizers Organics Circular Economy Processors Regulatory Requirements Managing Impacts New Technologies Applications Creating Markets Public Sector Procurement Updating Specifications End Products Ed Products


4 Organics Food Scraps Diversion 4
5 Organics Food Scraps Diversion Portland - garbage down 38% Surrey - garbage down by 35% Nanaimo - garbage down by half (food only) Port Coquitlam - garbage down 35% from 2009 to 2010 Calgary - garbage down by 42% in 7500 pilot homes Vancouver - garbage reduced by 40% during pilot and the roll out had a 40% reduction across the City Victoria - garbage down 37% after the first three months of the kitchen scraps collection program

6 Organics program examples
7 Global Food Waste by Weight 1.3 billion tonnes of food is wasted annually Approximately one third of the food produced for human consumption The United Nation s Food and Agriculture Organization (FAO) uses commodity production volumes reported by country to generate these estimates Fish and seafood, 2% Meat, 4% Dairy, 8% Oilseeds and pulses, 3% Cereals, 19% Roots and tubers, 20% Fruits and vegetables, 44% Source: Gustavsson et al., 2011 for FAO 7


 By 2030, halve per")


8 Organics Food Waste Prevention United Nations Sustainable Development Goal (Target 12.3) By 2030, halve per capita global FLW at the retail and consumer levels and reduce food losses along production and supply chains US Environmental Protection Agency and US Dept of Agriculture Call for halving of food waste by 2030 Other organizational support and key initiatives 8


9 Measurement Standards Measuring Methods Waste Composition Methodology 9
10 Measurement Standard Measurement Methods Food Loss and Waste Standard Category Measurement or Approximation Requires direct access to FLW Inference By Calculation Method Direct Weighing Counting Assessing Volume Waste Composition Analysis Records Diaries Surveys Mass Balance Modeling Proxy Data 10

11 Measurement Standard 11

12 Provincial Results 12
 program added to BC Recycling Regulation Additional EPR")

13 Region Overview Collection System Changes since 2010 Packaging and printed paper (PPP) program added to BC Recycling Regulation Additional EPR programs for electronics Food scraps collection programs with 2015 organics or kitchen scraps disposal ban Service change to every-other-week garbage collection
14 Disposal (kg/capita) Disposal (kg/capita) Waste Steam Change (Residential and Commercial, no Construction) Fines Bulky Objects Household Hygiene Household Hazardous Electronic Waste Building Material Glass Metals Non-Compostable Organics Compostable Organics #REF! Plastics Paper Year Year Region 1 Region 2 14
15 Region Changes Since 2010 Collection System Changes since 2010 Packaging and printed paper (PPP) Paper down by 12 kg/capita and 13 kg/capita Additional EPR programs for electronics Electronics down by 3 kg/capita and 4 kg/capita 2015 organics or kitchen scraps disposal ban Organics down by 53 kg/capita and 66 kg/capita Every-other-week garbage collection Residential waste down by 53 kg/capita and 47 kg/capita
16 Disposal (kg/capita) Disposal (kg/capita) Waste Steam Change (Residential Only) Fines Bulky Objects Household Hygiene Household Hazardous Electronic Waste Building Material Glass Metals Non-Compostable Organics Compostable Organics Plastics Paper Year Year Region 1 Region 2 16
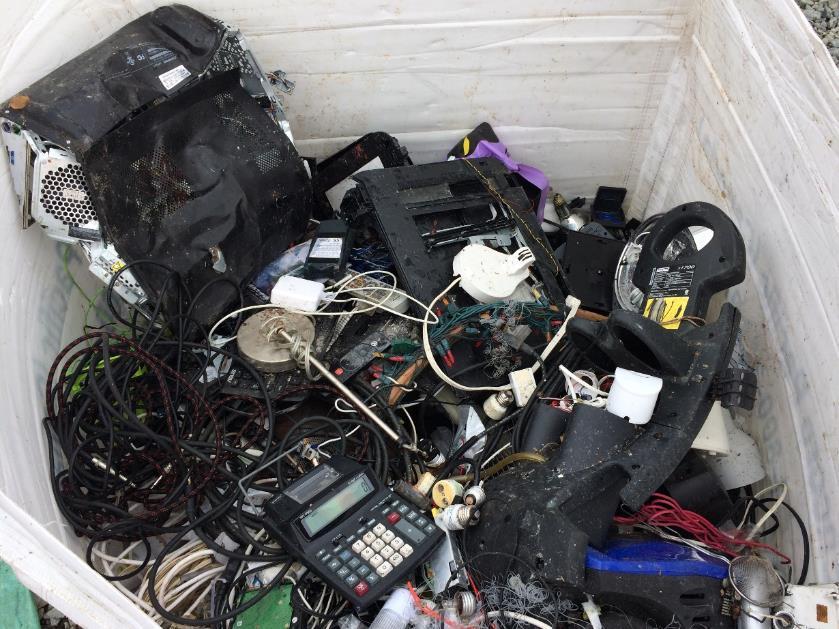

17 Electronics
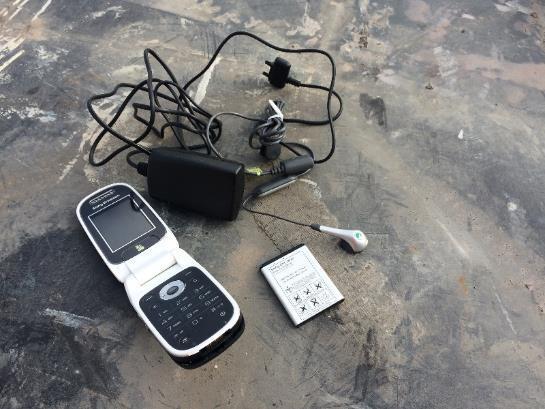

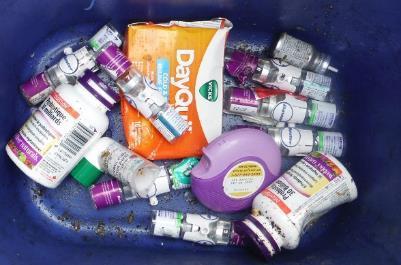

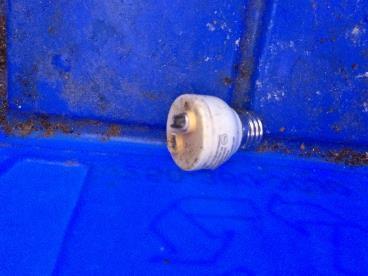
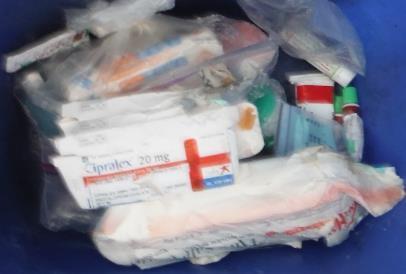
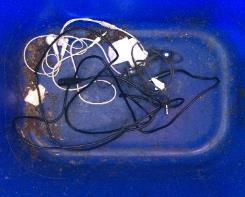
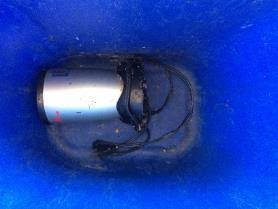
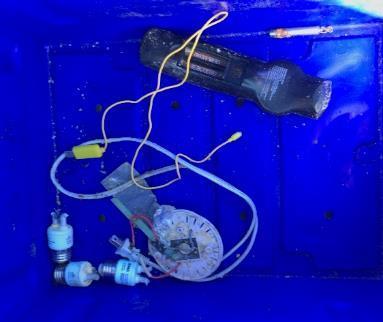
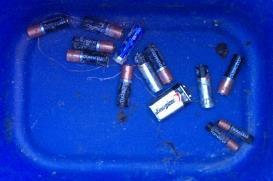
18 Phone, Medication, Lights

19 Useful Item Collection
20 Disposal (kg/employee) Waste Steam Change Industrial, Commercial and Institutional Only Fines Bulky Objects Household Hygiene Household Hazardous Electronic Waste Building Material Glass Metals Non-Compostable Organics Compostable Organics Compostable Plastic Plastics Paper Year 20
21 Disposal (kg/capita) Waste Stream Change Multi-family 250 Fines 200 Bulky Objects Household Hygiene Household Hazardous 150 Electronic Waste Building Material Glass 100 Metals Non-Compostable Organics Compostable Organics Compostable Plastic 50 Plastics Paper Year 21
22 Disposal (kg/employee) Waste Steam Change Drop-off or Self-Haul Fines Bulky Objects Household Hygiene Household Hazardous Electronic Waste Building Material Glass Metals Non-Compostable Organics Compostable Organics Compostable Plastic Plastics Paper Year 22
23 Disposal (kg/capita) Disposal (kg/capita) Waste Steam Change (Residential and Commercial, no Construction) Fines Bulky Objects Household Hygiene Household Hazardous Electronic Waste Building Material Glass Metals Non-Compostable Organics Compostable Organics #REF! Plastics Paper Year Year Region 1 Region 2 23

24 Food Waste Comparison 24
25 Categories and Training # Categories Definition Example Items 1 Inedible 2 Edible - Meat & Fish Edible - 3 Dairy & Eggs 4 5 Edible - Vegetables/ Fruits Edible - Baked Goods Not meant for humans to eat Uncooked or cooked meat Solid dairy products and eggs Solid uncooked or cooked vegetables and fruits Baked goods and bread-like products. Inedible Peels (banana, citrus, melon, winter squash), apple cores, Pits, Shells, Bones, Husks, Animal Fat and Tendons Beef, Pork, Poultry, Fish, Seafood. Includes organs and Processed Meats. Cheese, Yogurt, Butter, Eggs, Sour Cream Fruits, Vegetables, Soy and Meat-Like Products, Salads/Greens, Canned Beans, Herbs. Includes edible peels (e.g. apple, carrot, potato) and stems/leaves (e.g. broccoli, cauliflower, carrot, beet, pea) Bread, Tortillas, Naan, Pastry, Muffins, Cakes and Baked Desserts. From the bakery (either home-made or shop bought). No chips or other processed snacks. 25

26 Categories and Training 26

27 Unidentifiable? 27


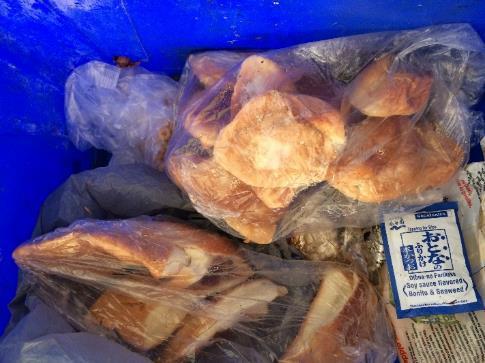
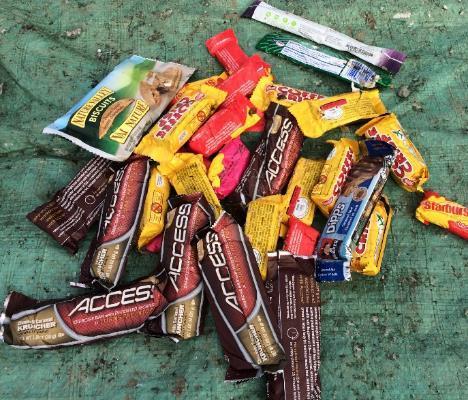
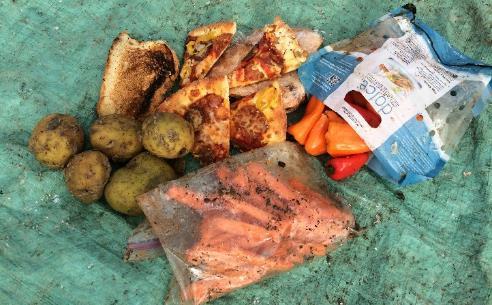
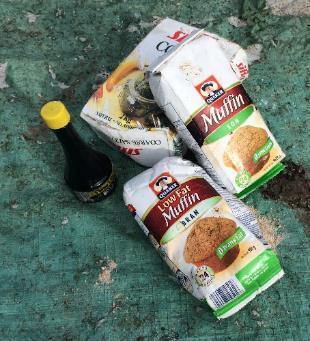
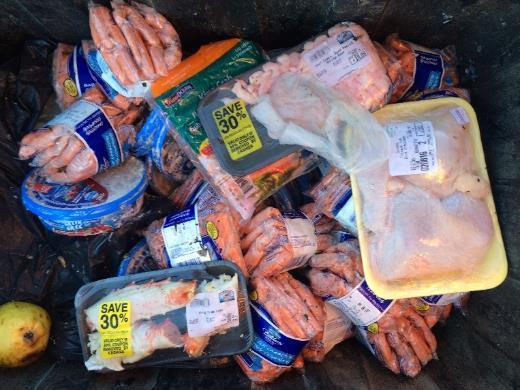
28 Avoidable and Donatable Food Scraps
29 How Much Preventable Food Waste Occurs? Trash and Organics Curbside Collection 12% of the garbage bin was avoidable food waste over 50% organics bin was avoidable food waste. In total 29% of the material set out at the curbside was avoidable food waste Trash Composition Organics Bin Composition 12% 5% Avoidable Food Waste 18% 83% Unavoidable Food Waste 29% 53% Other 29

30 As We Continue to Sort it Out Set vision, policy and regulatory tools Establish targets and use the pollution prevention hierarchy Measure and monitor to determine program needs and evaluate progress Focus in on specific material streams and products Work by sector and region to customize infrastructure, services and behavior change programs 30

31 Thank you Questions? Tamara Shulman, Planning Lead Avery Gottfried, Project Engineer Solid Waste Management Practice Source: Tetra Tech,