Performance Goal Review
|
|
|
- Naomi Bradford
- 5 years ago
- Views:
Transcription
1 MIDS Work Group Meeting February 18, 2010 Performance Goal Review p-gen3-12t
2 Our GOAL Today Identify additional info needed to make a performance goal decision March 18 Provide big picture review of work to date Show some real-world examples Discuss outstanding critical issues

3 Volume Control Conclusions All performance goals come close to matching native runoff volume conditions on an average annual basis
4 Comparison of Volume Controls: Stormwater Runoff Volume Leaving 10-Acre Site with B Soils Average Annual Runoff (inches/acre) Native 95% Forest Meadow 20% Impervious 50% Impervious 80% Impervious
 Additional rate control is required to get to natural")
5 Rate Control Conclusions All performance goals are effective at reducing volume Reducing volume reduces rate for small storms (1-yr storm and less) Additional rate control is required to get to natural hydrology

6 Water Quality Conclusions Not specified in legislation Reducing volume improves water quality All performance goals are effective and almost equal at improving water quality No need to prove that over and over (every project)
7 Phosphorus Loading Reduction from Volume Control BMPs Average Annual Total Phosphorus Loading from 10-acre Site (pounds) Without BMP With Volume Control BMP* 20% Impervious 50% Impervious 80% Impervious * Based on average loading from the four performance goal scenarios
8 Performance Goal Comparison Conclusions 95% 1. All provide similar VOLUME reduction 2. All reduce RATE for small storms 3. All improve water quality results are practically the same
9 Performance Goal Volume - Not all the same but close (Metro Area values) 95% 1. RUNOFF of 1.0 inch no abstractions = 1.0 inch 2. RAINFALL of 1.4 inches less abstractions for impervious and pervious = about 1.2 inches 3. RAINFALL of 2.4 inches less native runoff & less abstractions for imperv. & pervious, including infiltration during 24hr storm = about 1.2 inches
10 Performance Goal Volume - All can be adjusted to mimic (Metro Area values) 1. Change # to 1.2 inch from 1.0 inch 95% 2. Change rainfall to 1.3 inches from 1.4 inches (94% storm) 3. Change rainfall to 2.6 inches from 2.4 inches (1.5 year 24 hr storm) All volumes become essentially equal
11 All Approaches Can Mimic Natural Hydrology Preliminary Modeling Results from Walker, MN Method Value Range Needed to Match Forest and Meadow Annual Average Runoff Volume 0.8 inches 1.0 inches % 87.5% - 95% (0.9 inches 1.2 inches) Not determined Maybe 0.8-year to 3-year 24-hour event Range is based on Impervious % and soils
12 Issue Performance Goal Comparison Approach 1 : X Inches off Impervious Surface Approach 2: Retain Y% Storm Approach 3: Match Z-Year 24- Hour Volume Treatment volume calculation Very Simple Simple Moderately Simple % Incentive to reduce impervious surfaces? Yes Yes, less for sites with nonporous soils Yes, less for sites with non-porous soils Incentive to preserve natural areas with high infiltration rates No (compensate with credits) Yes Yes Applicable state wide? Yes Yes Yes Mimics native hydrology? Yes Yes Yes Provides consistent treatment among various impervious surfaces percentages? (as seen in height difference of bars in charts) Appears to be the most consistent Appears to be very similar to Approach 3 Appears to be very similar to Approach 2
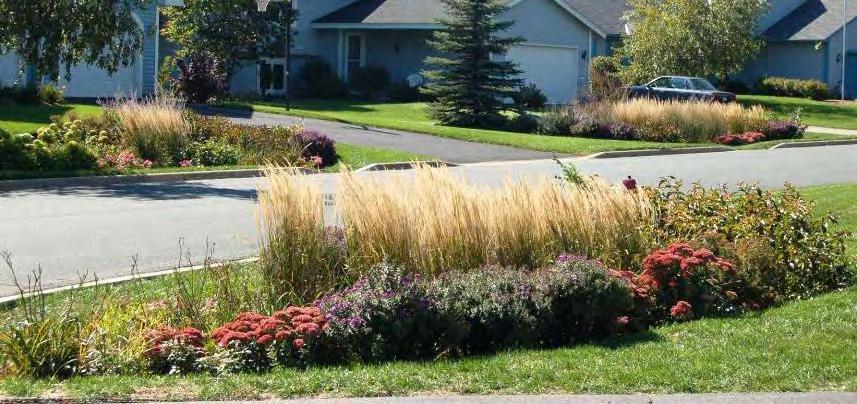
13 Example of Method Rushmore RWGs, Burnsville 17 Rainwater Gardens Sized to capture 1.0 inch from tributary impervious Actual volume was 0.9 inches due to ROW limitations Monitoring completed before and after construction

14 Example Example of Method Rushmore RWGs, Burnsville Burnsville Retrofit Project
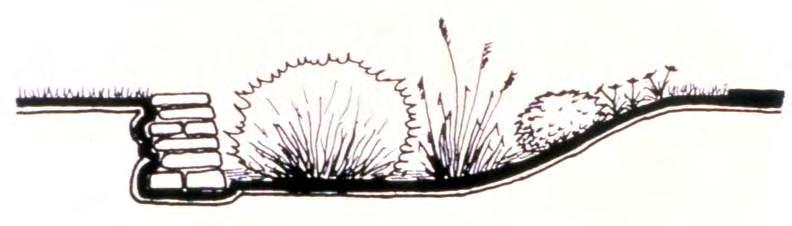
15 storage

16 Total Area = 16,000 sf Imperv Area = 4,000 sf Storage Volume = 4,000 sf. X 0.9 inch/12 = 300 cubic feet
17 Monitoring Results Reduced Flow and Volume, 0.75 Control - Volume ( cf) Study - Volume ( cf) 0.9 cfs Rainfall (1.44 in) 14,400 cf cfs 0.50 in Tue Jun PM 0.1 cfs 1,200 cf 9PM 9 Wed 3AM 6AM 9AM 12P 6/8/2004 4:00:00 PM - 6/9/ :00:00 PM
18 Results - Burnsville Storage volume = 0.9 inches from tributary impervious (30%) Annual measured volume reduction about 90% compared to developed w/no BMPs Measured Runoff = 0.4 inches during nonfrozen period Native RO, modeled, A soils =0.2 inches

19 Example of Method Lockheed Martin, Eagan 1.2 acre site sized for 1.0 Parking lot, 70% impervious Infiltration basin and porous bituminous

20 Infiltration Basin

21 145 Car Parking Lot


 0 Max Flow Rate Monitored: 0.")

22 3.5 3 Lockheed Martin 2010 Flow Data - Monitor 9 April 13-15, 2010 Modeled Pre-Phase A Flow Modeled Volume 1.21 Acres, 71% Impervious 5,067 cubic feet Flow Rate (cfs) Monitored Flow Total Observed Volume 91 cubic feet Reduction: 4,976 cubic feet 98.2% 0.5 Hourly Rainfall (in) 0 Max Flow Rate Monitored: 0.03 cfs 4/13 0:00 4/13 12:00 4/14 0:00 4/14 12:00 4/15 0:00 4/15 12: Total Rainfall 1.78 inches 4/13 0:00 4/13 12:00 4/14 0:00 4/14 12:00 4/15 0:00 4/15 12:00
23 Results Lockheed Martin Measured Runoff = 2.2 inches during nonfrozen period Native RO, modeled, B soils = 0.9 inch Very wet period rain gage = 30.2 inches 3 large storms (1.8, 2.7, 3.6 ) accounted for 1.5 inches of the 2.2 inches
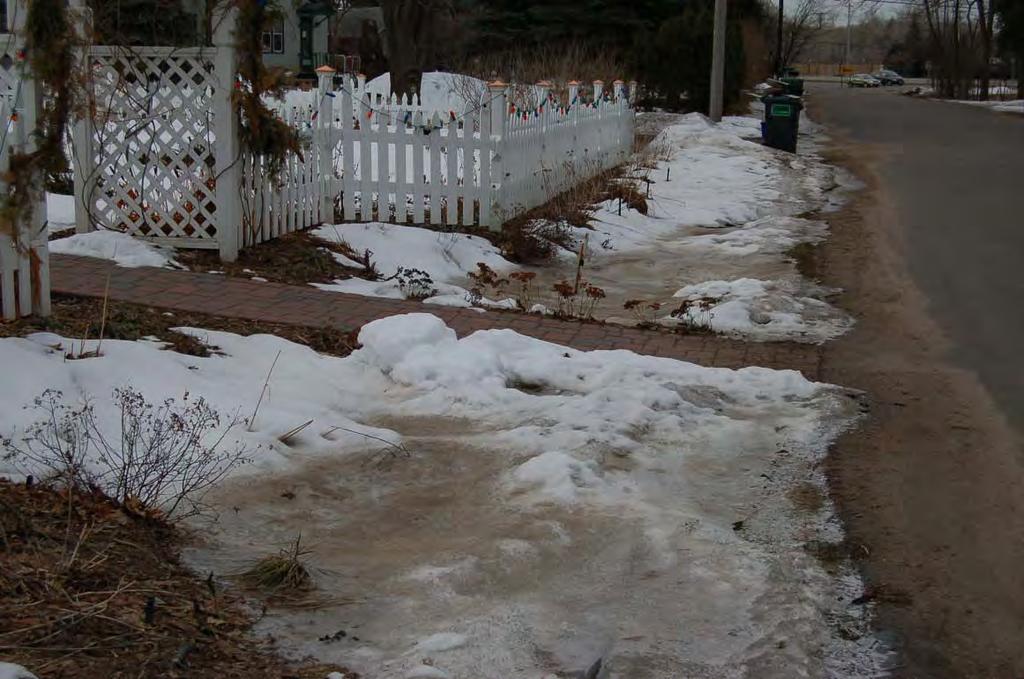
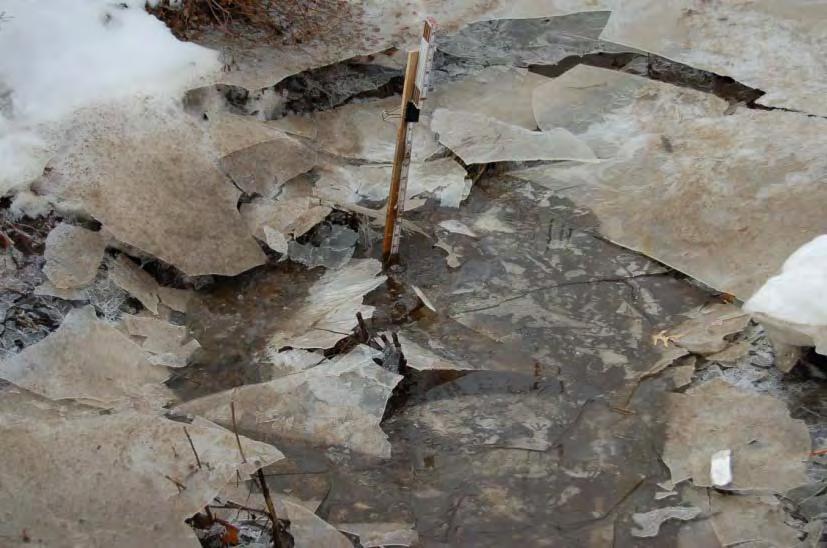
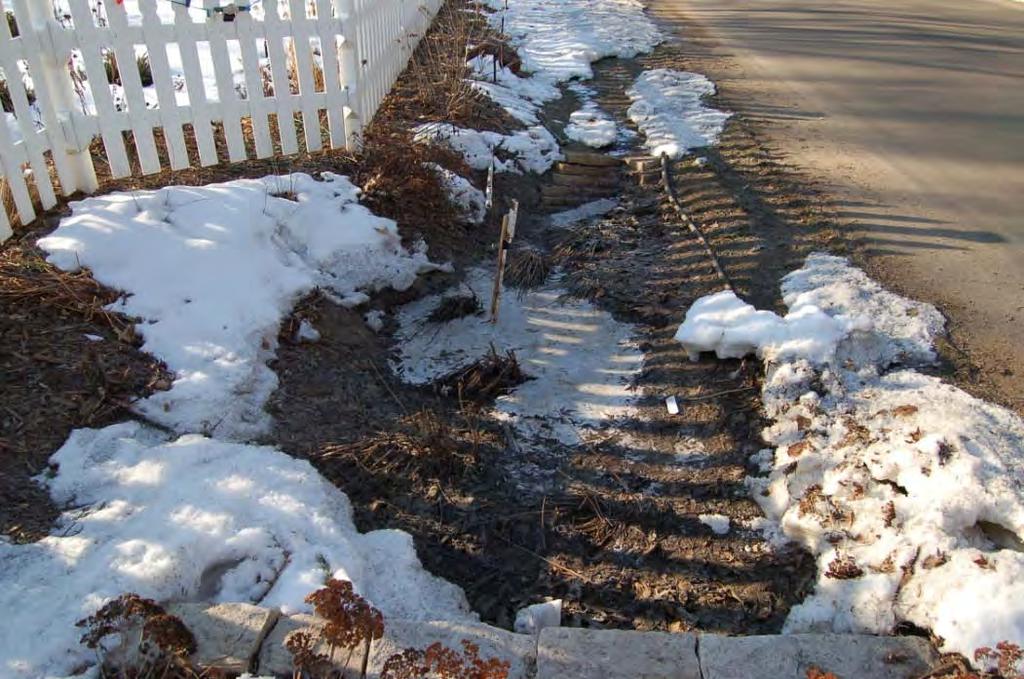
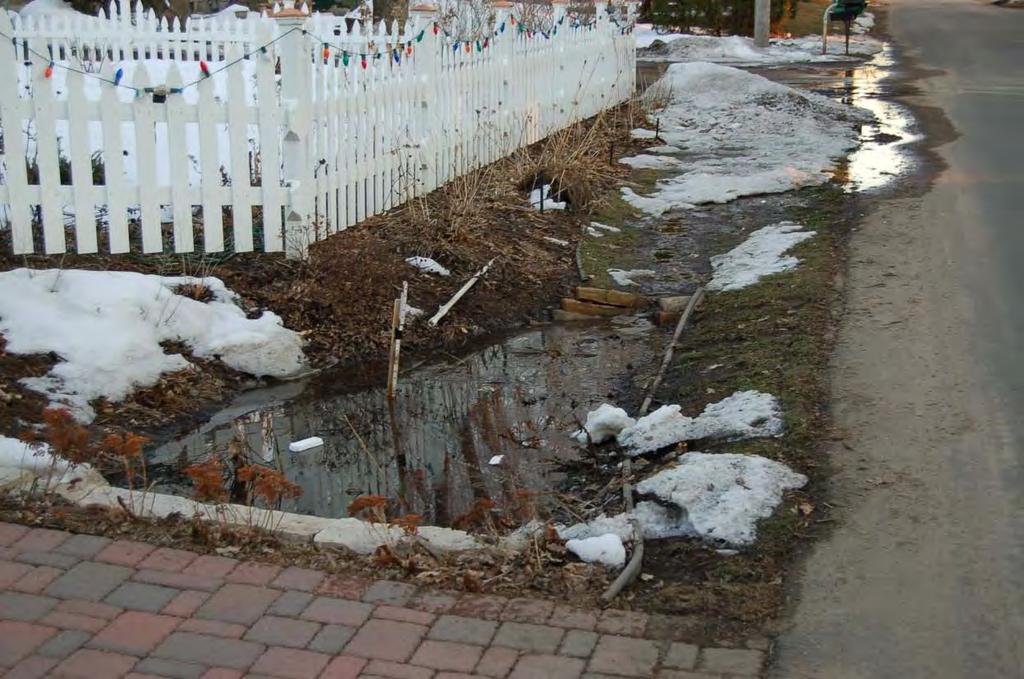
24 Frozen Ground Runoff Outstanding issue How much of the 4 inches of winter precipitation runs off? 100%?, 50%? Native conditions Developed conditions Do Infiltration BMPs work during the frozen ground period
25 Frozen Ground Runoff Working with MPCA to address issues and gain consensus on assumptions Results could affect the Performance Goal Volume.

26 AM AM

27 AM AM PM

28 Any Performance Goal can mimic natural hydrology! Goal today: Identify additional info needed to make a performance goal decision March 18