Action Today to Protect Tomorrow: London s efforts to curb traffic growth
|
|
|
- Cornelia Lane
- 5 years ago
- Views:
Transcription

1 Eleventh Biennial Conference on Transportation Energy and Environmental Policy Action Today to Protect Tomorrow: London s efforts to curb traffic growth Mark Evers Transport for London
2 Transport for London London s growth challenges T2025 and the Climate Change Action Plan Key policy areas Infrastructure investment Travel demand management Congestion charging


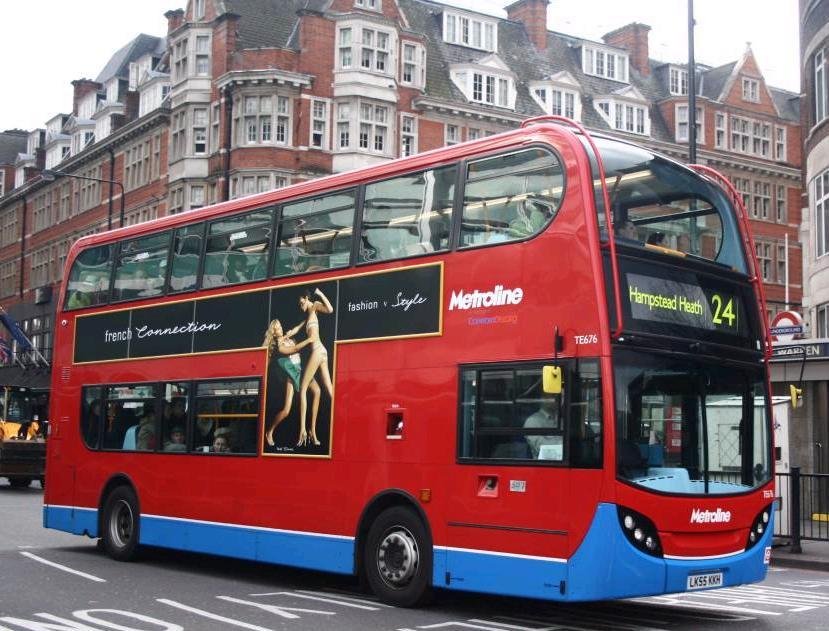
3 0.5m cycle trips daily 2.6m passengers daily 21,700 taxis More than 8,000 buses 4.9m passengers daily
4 Challenges for London s future London Today 7.5m people 4.6m jobs 27m trips per day By m people ( 11%) +0.9m jobs ( 20%) +4.0m trips ( 15%)
5 Growth must be accommodated while achieving challenging CO 2 targets 60% CO 2 reduction target for London by 2025 Existing targets are very challenging Science suggests tougher targets needed Success requires contributions from all sectors including transport!
6 CO 2 emissions from London s transport sector All sectors 44 million tonnes CO 2 Transport sector 100% = 10 million tonnes CO 2 Industrial 33% 7% 22% Ground-based aviation Ground-based National transport Rail 11% 4% Underground Road traffic = 80% 4% Taxi & PHVs 4% Bus 5% 49% Commercial 38% Domestic 23% Road freight Car & motorcycle
7 Carbon Dioxide Emissions (MtCO 2 ) Required CO 2 reductions Today 45.1m 44.3m 15% 51.0m Profile of national targets and aspirations (against 1990) Proposed London reductions to achieve 450ppm stabilisation year target (2016) = 20% 20% 25% 30% 600 million tonnes CO 2 to 2025 Target for London = 60% 60% (vs 2000)
8 20-year transport vision for London Recommends integrated transport policies and investments required to support economic environmental and social objectives Maximise existing network utility and lock-in benefits of new capacity Don t have to reduce standard of living, but must change the way we live Sets out actions for all sectors, including transport: Changing the way Londoners travel Operating vehicles more efficiently Promoting lower-carbon vehicles, infrastructure and fuels
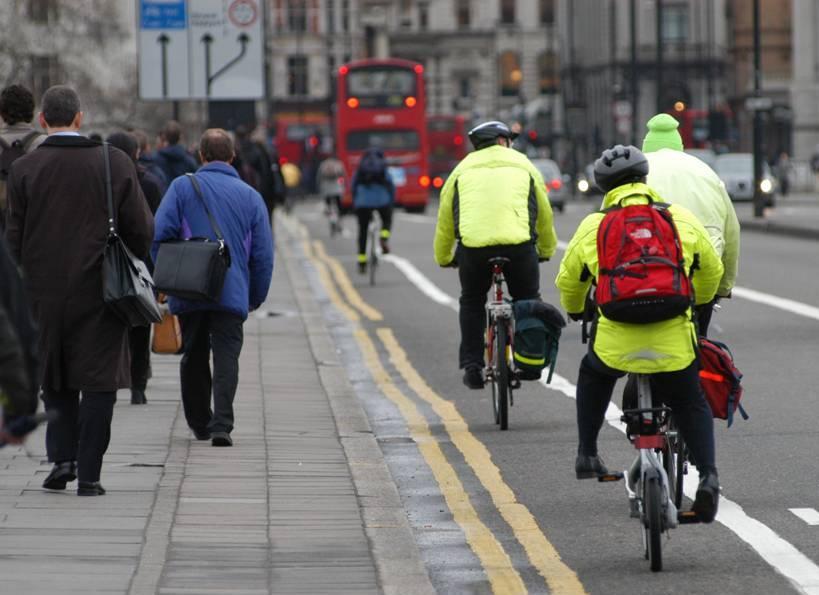
9 Shifting demand to sustainable modes is critical Typical CO 2 emissions by mode Walking & Cycling Underground Walking and cycling encouraged for short trips Rail Bus Improve public transport to promote shift from car Car kg CO 2 / passenger km


10 Continued investment in public transport and walking and cycling is required Transport2025 Tube upgrades DLR extension and London Overground PPP Expanded bus network Public realm improvements to promote walking and cycling Crossrail
11 Travel demand management is critical to maximise infrastructure investment How is it different? SMARTER TRAVEL SUTTON TDM measures will be implemented together in the same place Programme will be adequately funded ( 5m over 3 years) Performance will be measured before, during and after pilot Project Impact = 4-5% reduction in VMT
 Motorbikes, buses and coaches not included No barriers or tollbooths enforced using")
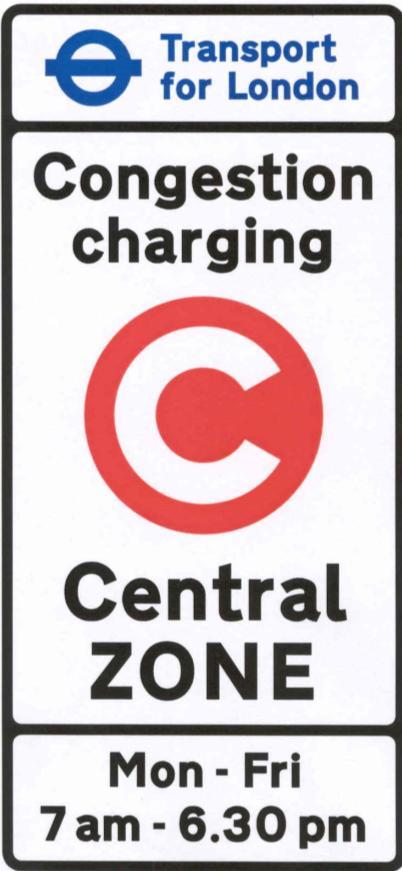
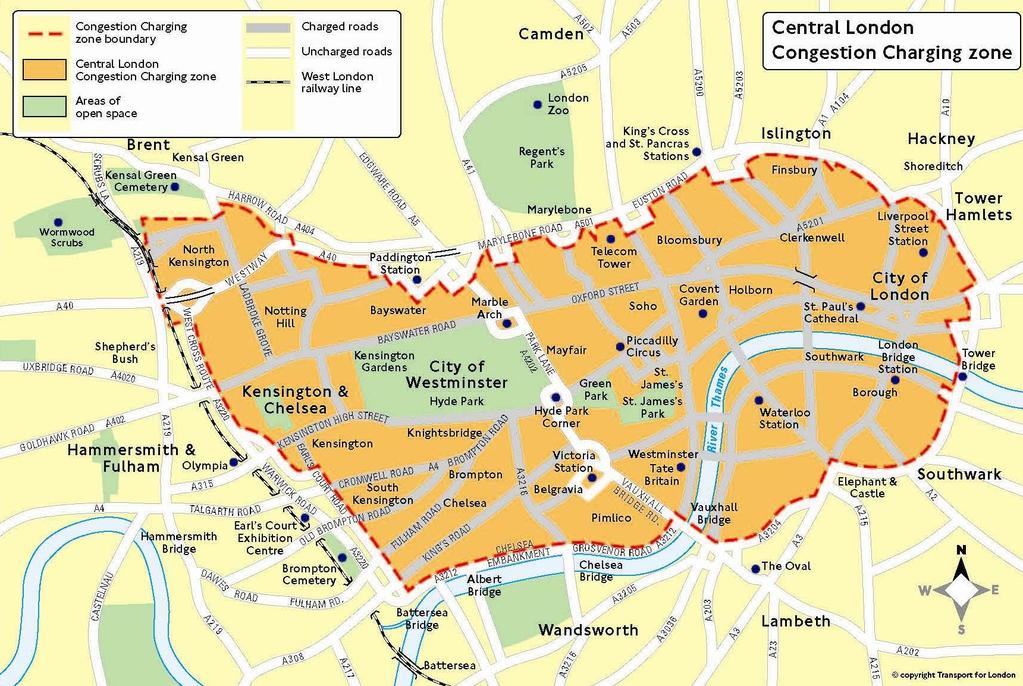
12 The Congestion Charge explained Introduced February 2003, extended February daily charge Operates Monday to Friday, 7am to 6pm, excludes weekends and public holidays Some discounts and exemptions (including 90% resident s discount, disabled passes, alternatively fuel vehicles) Motorbikes, buses and coaches not included No barriers or tollbooths enforced using cameras
13 Congestion Charge Zone Congestion Charging Zone River Thames London s boundary

14
15 Objectives of the scheme To reduce congestion To make radical improvements to bus services To improve journey time reliability for car users To make the distribution of goods and services more efficient


16 Summary of scheme impacts 20% reduction in traffic Congestion reduced by 30% Reduction in traffic accidents Neutral on business Bus patronage up, reliability and journey time improved Little change in number of trips to central London, but significant mode shift to public transport
17 Emissions-related charging O 2 Current scheme has reduced CO 2 emissions within the zone by 16% Next step: Emissionsrelated charging Better Better CO 2 (g/km) Worse <120g/km + Euro IV: 0 Air Quality g/km: 8 (US$16) >225g/km: 25 (US$50) Worse SUBJECT TO CONSULTATION 90% residents discount withdrawn for cars with CO 2 emissions >225g/km
18 Transport sector s contribution to CO 2 savings by 2025 Breakdown of savings by million tonnes CO 2 4.3m Transport 22% tonnes Commercial and public sector 39% Infrastructure efficiencies Breakdown of transport sector savings Biofuels Renewable Electricity 4% 13% 7% 26% Road user charging Domestic 39% Low carbon vehicles 19% 11% 9% 11% TDM Driver behaviour Contribution to Saving Operational efficiencies
19