Transit Oriented Development Study Addendum
|
|
|
- Dennis Bell
- 5 years ago
- Views:
Transcription

1 Federal Way Link Extension Transit Oriented Development Study Addendum
2 Table of Contents Introduction and Purpose... 2 FWLE Preferred Alternative... 2 Original TOD Potential Methodology (April 2015)... 6 Updated TOD Potential Methodology (Study Addendum, August 2016)... 8 Station Area Development Potential Methodology... 8 Updated Results Appendix A Table of Contents... 2 Executive Summary... 3 Station Area Development Potential Assessment... 4 Introduction & Background... 4 Criteria and Methodology... 5 Results... 6 S 216th Station Area Grouping... 6 Kent/Des Moines Station Area Grouping... 7 S 260th Station Area Grouping S 272nd Station Area Grouping Federal Way Station Area Grouping Corridor Development Potential Analysis Introduction Methodology Results Federal Way Link Extension 1 TOD Study Addendum
3 1 Introduction and Methodology Introduction and Purpose This document is an addendum to the original Transit Oriented Development (TOD) Study (Original Study) that was completed during the development of the Draft Environmental Impact Statement (Draft EIS) and both documents were published in April This Study Addendum supports the Final Environmental Impact Statement (Final EIS). The Study Addendum is intended to update findings based on changes in station locations and/or alternative alignments, and to respond to comments received on the Draft EIS related to TOD. It briefly summarizes methodology, measures, and results from the Original Study and follows with updated information consistent with Final EIS documentation. The Appendix includes the full Station Area Development Potential Assessment and Corridor Development Potential Analysis that supports the Study Addendum results. The purpose of the Original Study was to assess the potential for each station location to support TOD and to help identify the best station location within each of the five station areas in the corridor. Sound Transit evaluated 21 station locations under consideration in the Draft EIS to help inform the identification of a Preferred Alternative. Each station area was rated using a combination of quantitative and qualitative assessments, and these ratings were based on the information available at the time of the analysis. The Original Study was designed to address three key questions: Within each of the quarter mile station areas, which station locations would be more supportive of TOD? What combination of alignment and station locations would be more supportive of TOD? Would potential additional stations at S 216th Street and S 260th Street enhance support for TOD? FWLE Preferred Alternative In July 2015, the Sound Transit Board identified the Preferred Alternative for the FWLE project. This alternative, shown in Figure 1, leaves the Angle Lake Station and crosses to the east side of SR 99 near the proposed SR 509 Extension. It continues on the south side of the future SR 509 Project alignment until it reaches I 5. From S 211th Street to S 231st Street, the alignment is west of I 5 and the WSDOT right of way, to allow for the planned future build out of SR 509 and I 5. Between S 231st Street and S 317th Street, the alignment is mostly within the I 5 right of way, except to access stations. The Preferred Alternative has three stations: The Preferred Kent/Des Moines Station is elevated along the west side of 30th Avenue S, spanning a new S 236th Street that extends between SR 99 and the I 5 right of way. Federal Way Link Extension 2 TOD Study Addendum


4 The Preferred S 272nd Star Lake Station is in a trench at the existing park and ride. An elevated option has also been developed. The Preferred Federal Way Transit Center Station is elevated south of the existing Federal Way Transit Center, parallel to 23rd Avenue S and north of S 320th Street. Figure 1 FWLE Preferred Alternative The red line represents the guideway with a trench station at S 272 nd and a trench guideway at S 317 th ; yellow represents elevated station and alignment options at these locations. Figure 2 illustrates the range of station options considered. The preferred station locations are highlighted in orange. Federal Way Link Extension 3 TOD Study Addendum


5 Figure 2 Station Location Options for Kent/Des Moines, S 272nd, and Federal Way Federal Way Link Extension 4 TOD Study Addendum
6 When the Preferred Alternative was identified, the Sound Transit Board directed staff to work with stakeholders to develop and evaluate potential improvements in three areas. These include: Optimize the location of the Preferred Kent/Des Moines Station to facilitate access to Highline College and enhance future TOD potential in the Midway area. Identify ways to improve the potential for TOD all along the corridor, such as through better east west transit connections to stations, pedestrian and bike access improvements, and placemaking initiatives and development opportunities. Modify the preferred Federal Way Transit Center station to facilitate multimodal connections to the existing Federal Way Transit Center, enhance TOD potential in the downtown area, and accommodate a future light rail extension to the south on either I 5 or SR 99. Sound Transit staff conducted four stakeholder workshops for the Kent/Des Moines Station in September and October The stakeholders reached consensus that the Preferred Kent/Des Moines Station should optimize access for all modes of transport, create a safe pedestrian environment, and support near term and long term development opportunities. Following the workshops, the group recommended moving forward with the station location on the west side of 30th Avenue S with the following refinements (some of which are beyond Sound Transit s authority): Provide a connection to campus. Include walkways, lighting, and other treatments. Enhance pedestrian crossing safety at SR 99. Facilitate near term TOD and mixed income housing along S 236th Street. Maintain existing on campus Metro bus stops and consider providing more frequent east west transit service. Improve pedestrian access to neighborhoods. Consider naming the station Highline Station or Highline College Station. Continue stakeholder engagement for station planning. Sound Transit met with the City of Federal Way and King County Metro in September and October 2015 to optimize the location and layout of the preferred Federal Way Transit Center Station. The preferred location for this station is along the west side of 23rd Avenue S and north of S 320th Street. The tail track would extend over S 320th Street. A stakeholder workshop was conducted in December 2015 to review the station layout and discuss multimodal connections to the transit center and TOD potential. Sound Transit met with the City of Kent, Federal Way Public Schools, and King County Metro throughout fall 2015 and winter 2016 to optimize the Preferred S 272nd Star Lake Station. A stakeholder workshop was also conducted in March 2016 that focused on potential non motorized station access improvements, particularly along S 272nd Street to SR 99. The participants developed improvements that could be implemented, some of which would require collaboration among multiple jurisdictions. Federal Way Link Extension 5 TOD Study Addendum
7 DEIS Methodology for TOD Potential (April 2015) Four categories, illustrated in Figure 3, were considered together to provide an overall assessment of the degree to which each station option would be supportive of TOD: 1) access; 2) land use, plans & policies, and utilities; 3) market support; and 4) land availability. Each category is briefly described below. For more details on the methodology, refer to Chapter 2 of the Transit Oriented Development Study (April 2015). 1) Access Sound Transit assessed how existing development patterns support or hinder access to and from station locations for pedestrians, bicyclists, transit riders, and vehicles. The goal was to better understand the strengths and weaknesses of the station locations in terms of multimodal access. The following access modes were evaluated: walk, bicycle, transit, and auto. 2) Land Use, Plans & Policies, and Utilities Land Use Understanding neighborhoods and communities during light rail planning is a critical first step in understanding how development could change the area. This study evaluated existing land use, zoning, plans and policies, Capital Improvement Plans (CIPs) and Transportation Improvement Program (TIPs), urban form, and the existing infrastructure. Sound Transit assessed how well existing land use supports TOD in the proposed station areas. Existing land use was analyzed and grouped into two major categories uses that are transit supportive and those that are not. Plans and Policies Local plans and policies frame the jurisdictional and community perspectives, which are important to consider when planning a project to connect employment and activity centers and provide for uninterrupted transit access among the four cities in the corridor. The examination of future land uses, through published information indicating local agency plans and policies, demonstrates the vision for TOD in the future. Utilities Understanding the existing utility infrastructure and its capacity to support redevelopment can help in determining the TOD potential of a station option. Without appropriate utility capacity, development in a given area cannot move forward without significant investment. Utilities were analyzed qualitatively, with respect to the general proximity of the station to major existing utility corridors that could have additional capacity to accommodate future redevelopment. 3) Market Support The station area market support assessment evaluated the station s TOD potential in the context of market location characteristics. The purpose was to determine which stations were best suited to attract development from a locational perspective. This assessment did not quantify or forecast demand. Federal Way Link Extension 6 TOD Study Addendum

8 4) Land Availability This measure considered how many acres of land were available in the station area for redevelopment. Land availability was evaluated by comparing the amount of redevelopable land in each quarter mile station option to the total acreage of land overall in that quarter mile area. The objective of this assessment was to determine which stations were best suited to accommodate demand when it occurs. Figure 3 TOD Assessment Methodology used for the DEIS (April 2015) Federal Way Link Extension 7 TOD Study Addendum
9 Updated Methodology for TOD Potential for Final EIS (Study Addendum, August 2016) The methodology for the Access; Land Use, Plans & Policies, Utilities; and Market Support measures remains unchanged for this Study Addendum. These measures were applied to the Preferred Alternative station locations in the same manner as the Original Study. Sound Transit conducted new analysis to refine the Land Availability measure in response to comments received from stakeholders on the Draft EIS and to apply a finer grained approach to assessing development potential in station areas. The previous analysis did not take a parcel s zoning or building density into account which can influence the amount of potential development. For example, a twoacre parcel in the center of a dense commercial center that is zoned for multistory buildings, may offer more development potential than a two acre parcel in a rural area with single family residential zoning. Station Area Development Potential Methodology The previous Land Availability measure has been replaced with a new measure, Station Area Development Potential. This new measure estimates the amount of net new development that can be accommodated within each quarter mile station area after light rail is constructed. Development potential is based on each parcel s size, existing zoning, value of existing improvements, and known access, environmental, and other issues. Adjustments were made to account for zoning that is far beyond what is likely to develop based on existing development patterns. It is also important to note that this analysis does not estimate market demand. Additionally, the analysis considers developments that could potentially be built, not what is currently planned. For parcels with mixed use zoning, a 25% commercial/75% residential split is assumed unless zoning suggests otherwise. A 50% commercial/50% residential split is assumed for parcels that allow for both single purpose commercial and single purpose residential development. Results by station area are calculated in terms of number of residential units and commercial square footage. Results however, are reported as one number total square footage of potential net new development within each station area. To arrive at this single unit of measure, residential units are converted to square footage using an assumed average of 1,000 square feet per unit. The station area analysis estimates the amount of net new development that can be accommodated within each quarter mile station area after light rail is in place. As illustrated by the green area in Figure 4, net new development potential is calculated by subtracting the existing development within a station area from the station area s total estimated development potential. Federal Way Link Extension 8 TOD Study Addendum

10 Figure 4 Station Area Development Potential Methodology Federal Way Link Extension 9 TOD Study Addendum
11 2 Updated Station Area Development Potential Results Updated Results Sound Transit looked at three of the measures Access; Land Use, Plans, and Policies; and Market Support and concluded there were no significant changes in the rating metrics that resulted in a new rating since the Original Study was completed. Sound Transit then applied the same three measures to the Preferred Alternative stations that were optimized since the Original Study. The ratings did not change for any of the Preferred Alternative stations because their location was relatively similar to another station evaluated in the Original Study. For example, the Preferred Kent/Des Moines Station is essentially a refined combination of these two station options, and therefore access, land use, plans and policies, infrastructure, and market support did not differ from what was originally studied. Similar refinements were made at the S 272nd and Federal Way station locations. Figures 5 and 6 illustrate the scores for all station locations, and include the new Station Area Development Potential results, described in the following section. Station Area Development Potential Results As noted in the previous section, development potential was not assessed in the Original Study. Below is a summary of results by station groupings for this Study Addendum followed by Table 1 with data for each station location. The results from the Land Availability measure used in the Original Study are included for comparative purpose only and do not factor into the station ratings. Figures 5 and 6 illustrate the scores for each station, with the last column showing the Station Area Development Potential Results. These figures were shown in the Original Study and have been updated to reflect the new analysis. Kent/Des Moines Station Area The Kent/Des Moines station area could have between 2.6 and 5.2 million square feet of (re)development potential. The station options located furthest to the west, such as Kent/Des Moines HC Campus Station and Kent/Des Moines SR 99 West Station, have the least development potential. This is primarily because greater portions of these ¼ mile station areas are composed of Highline College Campus property and established single family neighborhoods with low redevelopment potential. The Kent/Des Moines I 5 Station also has relatively low redevelopment potential compared to the other stations in this grouping due to a large portion of its quarter mile station area being occupied by I 5. The I 5 At Grade Station presents the most (re)development potential. Although station access from a portion of the station area is impeded by I 5, it is the only station area that includes the large vacant parcels to the south of Lowes which are zoned to allow for relatively dense development. The development potential of these parcels more than makes up for impact of I 5 at this station. Federal Way Link Extension 10 TOD Study Addendum
12 S 272nd Station Area The station options in the S 272nd grouping offer relatively little (re)development potential. The two S 272nd Redondo Station options offer between 1.0 and 1.7 million square feet of (re)development potential. The only notable difference between the Redondo options is that the elevated option has more commercial potential than the trench option. This is because the station itself is located farther north within Sound Transit s facility footprint which influences the location of the quarter mile station area and the amount of future development area within facility footprint itself. The Preferred S 272nd Star Lake Station offers 0.1 million square feet (78 residential units), which is the least of all station options assessed. The low (re)development potential for this station is primarily due to the existence of wetlands, the fact that a significant amount of the station area is covered by existing multi family development with low redevelopment potential, and because I 5 bisects the station area. Federal Way Station Area Relative to station areas in other groupings, the Federal Way City Center station options offer a substantial amount of (re)development potential. At the station area level, development potential ranges from 2.2 to 6.4 million square feet. The Federal Way 320th Park and Ride Station option represents the low end of this range and the Preferred Federal Way Transit Center Station option represents the high end. The three station options located toward the center of the Federal Way City Center offer more development potential than the two options located near I 5. This is primarily due to the fact that there are a number of large parcels located in the center of downtown that have low improvement values and zoning that allows for development that is significantly denser than the existing development. The Preferred Alternative includes the station with the highest overall development potential, the Preferred Federal Way Transit Center Station, as well as the lowest overall development potential, the S 272nd Star Lake Station. These results fit the context of the two station areas. The Federal Way Transit Center Station is located in the Federal Way City Center while the S 272nd Star Lake Station is a parkand ride station. The Preferred Kent/Des Moines Station scores in the middle of all Kent/Des Moines stations. This station is located in the Midway Subarea, where the City of Kent is planning for new growth and development in the future. Federal Way Link Extension 11 TOD Study Addendum
13 Table 1 Station Area Development Potential Results Station S 216th East Station Option S 216th West Station Option Kent/Des Moines I-5 Station Option Kent/Des Moines I-5 At Grade Station Option Preferred Kent/Des Moines Station Kent/Des Moines 30th Avenue East Station Kent/Des Moines HC Campus Station Option Kent/Des Moines SR 99 East Kent/Des Moines SR 99 Median Station Option Kent/Des Moines SR 99 West Station Option S 260th East Station Option S 260th West Station Option Preferred S 272nd Star Lake Station S 272nd Redondo Station S 272nd Redondo Trench Station Option Preferred Federal Way Transit Center Station Federal Way I-5 Station Option Federal Way S 320th Park-and-Ride Station Option Federal Way Transit Center Station (SR 99) Federal Way SR 99 Station Option Number of Residential Units Residential Square Feet Commercial Square Feet Total Development Potential (Residential + Commercial SF) Original Study Result (Land Availability in Acres) ,000 2,000,000 2,700, ,000 3,000,000 3,700, ,093 2,100,000 1,100,000 3,200, ,016 3,000,000 2,200,000 5,200, ,273 2,300,000 1,200,000 3,500,000-2,434 2,400,000 1,200,000 3,600, ,852 1,900, ,000 2,600, ,735 2,700,000 1,400,000 4,100, ,362 2,400,000 1,000,000 3,400, ,199 2,200, ,000 3,100, , , , , , , , ,000 1,300,000 1,700, , ,000 1,000, ,269 3,300,000 3,100,000 6,400,000-1,490 1,500,000 1,500,000 3,000, ,166 1,200,000 1,000,000 2,200, ,241 3,200,000 3,000,000 6,200, ,652 2,700,000 2,400,000 5,100, Federal Way Link Extension 12 TOD Study Addendum

14 Figure 5 Updated Summary of TOD Support by Station Option Federal Way Link Extension 13 TOD Study Addendum

15 Figure 6 Updated Summary of TOD Support by Geographic Location Federal Way Link Extension 14 TOD Study Addendum
16 3 - Corridor Development Capacity Methodology The previous section described the Station Area Development Potential. This section describes the Corridor Development Capacity, which estimates the before and after effect that the project could have on the development potential of all parcels that Sound Transit has identified for acquisition along the entire corridor. In the Original study, the Land Availability measure considered the impacts of the guideway coming in and out of the station within the context of the quarter mile station area. Guideway impacts to parcels outside of the quarter mile station areas were not included in the original study. For this updated study and in response to Draft EIS comments, Sound Transit assessed potential development impacts to parcels along the entire corridor including those outside of the station area. The Corridor Development Capacity analysis is an evolution of the previous Land Availability Study, and is designed to: Document the impact of the project on the development potential of parcels between station areas. It s worth noting, that business and residential displacements and economic development impacts were also documented in the Final EIS. Account for a parcel s specific zoning and potential development density. Compare (re)development impacts and opportunities for the full corridors (i.e. at the stations and between stations). It s worth noting that the analysis is limited to parcels directly impacted by the project and does not consider indirect effects of adjacent parcels. That is, it does not integrate the results of the net development potential within ¼ mile of the station described in Section 2 above. There are a number of factors that influence a parcel s development potential including, but not limited to, zoning, physical site characteristics, location, site access, and environmental issues. To account for some of these factors, the impact of future development potential was evaluated for two sample corridors. The analysis considered the change in development potential on parcels identified for acquisition due to the project being constructed. Figure 7, graphically illustrates how development potential impact is calculated for a vacant residential parcel. Federal Way Link Extension 15 TOD Study Addendum
17 Figure 7 Corridor Development Capacity Methodology 4 - Corridor Development Capacity Results As shown in Table 2, the results of this analysis found that the SR 99 Alternative has more impact (almost twice) on potential commercial development than the Preferred Alternative and less impact on potential residential development. It is worth noting that these results are different from the station area development potential analysis which evaluates the net potential development capacity within each quarter mile station area. Table 2 Corridor Development Capacity Results Corridor Residential Units - Development Potential Impact Residential Square Feet - Development Potential Impact Commercial Square Feet -Development Potential Impact Total Development Potential Impact (Residential + Commercial SF) Preferred Alternative , ,000 1,300,000 SR 99 Alternative ,000 1,300,000 1,400,000 Federal Way Link Extension 16 TOD Study Addendum
18 Appendix A: Station Area Development Potential Assessment and Corridor Development Impact Analysis Prepared by Kidder Mathews Updated Federal Way Link Extension 17 TOD Study Addendum


19 Federal Way Link Extension Station Area Development Potential Assessment and Corridor Development Impact Analysis Presented to Sound Transit C/o HDR 601 Union Street Suite 700 Seattle, WA Attn: Sharon Kelly Presented by Kidder Mathews Michael George Blair Howe, CCIM 601 Union Street, Suite 4720 Seattle, WA Federal Way Link Extension 1 TOD STUDY ADDENDUM: APPENDIX A
20 Table of Contents Table of Contents... 2 Executive Summary... 3 Station Area Development Potential Assessment... 4 Introduction & Background... 4 Criteria and Methodology... 5 Results... 6 S 216th Station Area Grouping... 6 Kent/Des Moines Station Area Grouping... 7 S 260th Station Area Grouping S 272nd Station Area Grouping Federal Way Station Area Grouping Corridor Development Potential Analysis Introduction Methodology Results Nature of the Assignment The information supplied herein is from sources we deem reliable. It is provided without any representation, warranty or guarantee, expressed or implied as to its accuracy. Prospective Owner, Buyer or Tenant should conduct an independent investigation and verification of all matters deemed to be material, including, but not limited to, statements of value, income, and expenses. CONSULT YOUR ATTORNEY, ACCOUNTANT, OR OTHER PROFESSIONAL ADVISOR. Federal Way Link Extension 2 TOD STUDY ADDENDUM: APPENDIX A
21 Executive Summary Assignment Kidder Mathews conducted a Station Area Development Potential Assessment (Assessment) to estimate the amount of residential and commercial development potential within the quarter mile station areas along the proposed Federal Way Link Extension (FWLE) corridor alternatives (SeaTac to Federal Way). This Assessment builds on the FWLE Market and Land Availability Assessment produced by Kidder Mathews for Sound Transit in As part of this assignment, a separate Corridor Development Potential Analysis was tested on two sample alignments to estimate the before and after effect of the project on the development potential of all parcels that Sound Transit has identified for acquisition along the entire corridor. Summary Findings Station Area Development Potential Assessment The Assessment identifies vacant and underutilized properties where Station Grouping Station Area future development S 216th can occur and estimates the amount of net new building area that can be reasonably Kent/Des Moines accommodated on each of the parcels after accounting for project impacts. Exhibit 1 - Station Area Development Potential Summary Findings Total Dev. Potential (Res + Comm SF) S 216th East Station 2,700,000 S 216th West Station 3,700,000 Kent/Des Moines I-5 Station 3,200,000 Kent/Des Moines I-5 At Grade Station 5,200,000 Preferred Kent/Des Moines Station 3,500,000 Kent/Des Moines 30th Avenue East Station 3,600,000 Kent/Des Moines HC Campus Station 2,600,000 Kent/Des Moines SR 99 East Station 4,100,000 Kent/Des Moines SR 99 Median Station 3,400,000 Kent/Des Moines SR 99 West Station 3,100,000 S 260th East Station 700,000 S 260th Exhibit 1 summarizes S 260th West Station 900,000 the results of the Assessment. As shown, the station areas within the Federal Way grouping tend to offer the most development potential, followed by S 272nd Federal Way Preferred S 272nd Star Lake Station S 272nd Redondo Station S 272nd Redondo Trench Station Station Federal Way I-5 Station Federal Way S 320th Park-and-Ride Station Federal Way Transit Center Station (SR 99) Federal Way SR 99 Station 100,000 1,700,000 1,000,000 6,400,000 3,000,000 2,200,000 6,200,000 5,100,000 the Kent/Des Moines, and S 216th station area groupings. The S 272nd and S 260th station area groupings offer less development potential. Federal Way Link Extension 3 TOD STUDY ADDENDUM: APPENDIX A
22 Corridor Development Potential Analysis Findings The Corridor Development Potential Analysis found that both the Preferred Alternative and the SR 99 Baseline Alternative have a similar impact on total development potential. The main difference between the two is that SR 99 Baseline Alternative would have more impact on potential commercial development than the Preferred Alternative, and less impact on potential residential development. Station Area Development Potential Assessment Introduction & Background Kidder Mathews conducted a Station Area Development Potential Assessment (Assessment) to estimate the amount of net new residential and commercial development potential within each of the quartermile station areas along the proposed Federal Way Link Extension (FWLE) corridor alternatives (SeaTac to Federal Way). This Assessment builds on the FWLE Market and Land Availability Assessment produced by Kidder Mathews for Sound Transit in The Assessment identifies vacant and underutilized properties where future development can occur and estimates the amount of net new building area that can be reasonably accommodated on each of these parcels after accounting for project impacts. The previous Land Availability Assessment estimated the number of acres of land with TOD potential within a quarter mile of each station area. As part of this work, a cursory physical inspection was conducted to identify station area characteristics that are not always apparent in aerial studies or identifiable in the data. Exhibit 2 - Station Area Development Potential Unlike this Assessment, the previous work did not take parcel zoning or potential building density into account which can significantly influence the amount of potential development a parcel offers. For example, a two acre parcel in the center of a dense commercial center may offer more development potential than a two acre parcel in a less dense single family neighborhood. Federal Way Link Extension 4 TOD STUDY ADDENDUM: APPENDIX A
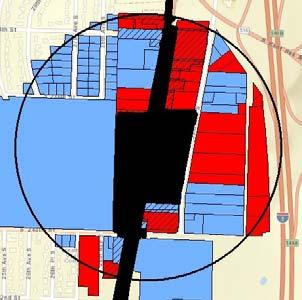
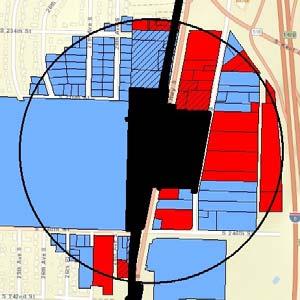
23 Results by station area are calculated in terms of the number of net new residential units and commercial square footage. To allow for simple comparisons between station areas, results are reported as one number total square feet of potential net new development within the station area. To arrive at the single unit of measurement, it is assumed that residential units average 1,000 square feet in size. Exhibit 2 graphically depicts the net development potential calculation. Criteria and Methodology This section describes the criteria used to assess each parcel s development potential. Improvement Ratio The improvement to land value ratio provides perspective about the utility of the existing property improvements in the market and can help determine redevelopment potential. A typical rule of thumb suggests existing improvements are not demolished to make way for new development unless the values of the improvements represent 50% or less of the value of the property. All improvement and land value s are based on King County Assessor s Data. General Zoning & Development Potential Assumptions A parcel s base zoning is used to calculate allowable FAR. If the FAR is not explicitly stated in the development code a best guess is made based on the information available. It is assumed that parcels develop to half their allowable FAR. To moderate the outsized effect of parcels zoned far beyond what has been developed historically, all zoning was capped at a FAR of 9. A 25% commercial/75% residential split is assumed for parcels with a mixed use zoning designation, unless zoning suggests otherwise. A 50% commercial/50% residential split is assumed for parcels that allow for both singlepurpose commercial and single purpose residential development. Structured parking is not included in FAR calculations. All parcel and building data is based on King County Assessor s Data. Physical Feasibility Physical characteristics such as a site s size and shape are factored into a site s (re)development rating. Other Development Factors Constrained site access, environmental and other issues likely to severely limit development potential are considered when assessing redevelopment potential of a parcel. Project Impacts Project impacts are based on Sound Transit s FEIS property aquisition file which maps both permanent and temporary impacts, and business and residential displacements. Aerial studies using ArcGIS and Pictometry ariel imagery were used to supplement this information where necessary Proximity and Access Impediments to the Station This criterion considers a parcel s proximity to the station after accounting for significant impediments such as major arterials or large wetlands that are difficult to cross. Parcels beyond the ten minute walk shed were removed from consideration. Federal Way Link Extension 5 TOD STUDY ADDENDUM: APPENDIX A
24 Assemblage Potential This criterion considers the likelihood of multiple parcels being assembled into larger development opportunities. Larger parcels with consolidated property ownership are typically less complex to redevelop than smaller parcel areas with multiple owners. This criterion is one of the reasons that some of the remnant slivers of property created by the light rail alignment are still rated to have (re)development potential. Physical Feasibility, Known Environmental Conditions, and Other Considerations This criterion considered a parcel s physical characteristics such as topography, physical barriers, and the availability of larger developable parcels to influence development potential. For example, steep slopes and barriers, such as freeways, can limit or prohibit development. Results The following sections detail the estimated net new development potential of the quarter mile station area surrounding each of the potential station options. The maps included in this section illustrate the range of (re)development potential within each station area. (Re)development parcels are shaded in red; parcels with limited (re)development potential are shaded in blue; hatching indicates a parcel is would be permanently or temporarily impacted by the alternative in some way; and, the area shaded in black indicates the portion of each parcel that would be permanently impacted by the alignment. The assessment assumes that a portion of the area shaded in black would be made available by Sound Transit for future transit oriented development. S 216th Station Area Grouping Exhibit 3 S 216th Station Area Grouping Number of Residential Commercial Total Dev. Potential Station Area Res. Units SF SF (Res + Comm SF) S 216th East Station ,000 2,000,000 2,700,000 S 216th West Station ,000 3,000,000 3,700,000 Exhibit 4 illustrates the range of (re)development potential within each station area. Federal Way Link Extension 6 TOD STUDY ADDENDUM: APPENDIX A


25 The S 216th West and S 216th East Station areas contain 3.7 and 2.7 million square feet of redevelopment potential, respectively. As shown in Exhibit 3, the main difference is that the S 216 th West Station area offers more commercial development potential than the 216th East station option. As compared to other station groupings, this grouping offers a moderate amount of (re)development potential. Exhibit 4 S 216th Development Potential Maps S 216th West S 216th East Kent/Des Moines Station Area Grouping Exhibit 5 Kent/ Des Moines Station Area Grouping Number of Residential Commercial Total Dev. Potential Station Area Res. Units SF SF (Res + Comm SF) Kent/Des Moines I-5 Station 2,093 2,100,000 1,100,000 3,200,000 Kent/Des Moines I-5 At Grade Station 3,016 3,000,000 2,200,000 5,200,000 Preferred Kent/Des Moines Station 2,273 2,300,000 1,200,000 3,500,000 Kent/Des Moines 30th Avenue East Station 2,434 2,400,000 1,200,000 3,600,000 Kent/Des Moines HC Campus Station 1,852 1,900, ,000 2,600,000 Kent/Des Moines SR 99 East Station 2,735 2,700,000 1,400,000 4,100,000 Kent/Des Moines SR 99 Median Station 2,362 2,400,000 1,000,000 3,400,000 Kent/Des Moines SR 99 West Station 2,199 2,200, ,000 3,100,000 As shown in Exhibit 5, individual station areas in the Kent/Des Moines grouping range between 2.6 and 5.2 million square feet of (re)development potential. The station options located furthest to the west, such as Kent/Des Moines Highline College Campus Station and Kent/Des Moines SR 99 West Station, tend to have relatively low development potential. This is primarily because a greater portion of these station areas are composed of Highline College Campus property and established single family neighborhoods with low redevelopment potential. The Kent/Des Moines I 5 Station also has relatively low redevelopment potential compared to the other stations in this grouping due to a large portion of its quarter mile station area being impacted by I 5. Federal Way Link Extension 7 TOD STUDY ADDENDUM: APPENDIX A
26 The I 5 At Grade station presents the most (re)development potential. Although a portion of the station is impacted by I 5, it is the only station area that includes the large vacant parcels to the south of Lowes which are zoned to allow for relatively dense development. The development potential of these parcels more than makes up for impact of I 5 at this station. Exhibit 6 illustrates the range of (re)development potential within each station area. Federal Way Link Extension 8 TOD STUDY ADDENDUM: APPENDIX A


27 Exhibit 6 Kent/Des Moines Development Potential Maps Kent/Des Moines I-5 Kent/Des Moines I-5 At Grade Preferred Kent/Des Moines Kent/Des Moines 30th Avenue East Kent/Des Moines HC Campus Kent/Des Moines SR 99 East Kent/Des Moines SR 99 Median Kent/Des Moines SR 99 West Federal Way Link Extension 9 TOD STUDY ADDENDUM: APPENDIX A
 S 260th East Station 43 0 700,000 700,000 S 260th West Station 51 100,000 800,000 900,000 The S 260th East and S 260th West Station areas offer relatively little")
development.")
28 S 260th Station Area Grouping Exhibit 7 S 260th Station Area Grouping Number of Residential Commercial Total Dev. Potential Station Area Res. Units SF SF (Res + Comm SF) S 260th East Station , ,000 S 260th West Station , , ,000 The S 260th East and S 260th West Station areas offer relatively little (re)development potential. As shown in Exhibit 7, these station areas contain.7 and.9 million square feet of net new development potential, respectively. Based on existing zoning, neither station offers the opportunity for a significant amount of residential (re)development. Exhibit 8 S 260th Development Potential Maps S 260th East S 260th West Exhibit 8 illustrates the range of (re)development potential within each station area. Federal Way Link Extension 10 TOD STUDY ADDENDUM: APPENDIX A
29 S 272nd Station Area Grouping Exhibit 9 S 272nd Station Area Grouping Number of Residential Commercial Total Dev. Potential Station Area Res. Units SF SF (Res + Comm SF) Preferred S 272nd Star Lake Station , ,000 S 272nd Redondo Station ,000 1,300,000 1,700,000 S 272nd Redondo Trench Station , ,000 1,000,000 Station areas within this grouping offer little development potential relative to other groupings. As shown in Exhibit 9, the two Redondo Station options offer between 1.0 and 1.7 million square feet of (re)development potential. The only notable difference between the S 272nd Redondo station options is that the elevated station option has more net new commercial development potential than the trench station option. This is because the station itself is located further north within Sound Transit s facility footprint which influences the location of the quarter mile station area and the amount of future development area within the facility footprint itself. The Preferred S 272nd Star Lake station option only offers.1 million square feet of (re)development potential (78 residential units), which is less than any of the other station areas assessed. The low potential for this station is primarily due to the impact of wetlands, the fact that a significant amount of the station area is covered by existing multi family development with low redevelopment potential, and because I 5 bisects the station area. Exhibit 10 illustrates the range of (re)development potential within each station area. Federal Way Link Extension 11 TOD STUDY ADDENDUM: APPENDIX A

 3,241 3,200,000 3,000,000 6,200,000 Federal Way SR 99 Station 2,652 2,700,000 2,400,000 5,100,000")
development potential within station areas ranges from 2.2 to 6.4 million square feet.")
30 Exhibit 10 S 272nd Station Area Grouping Preferred S 272nd Star Lake S 272nd Redondo S 272nd Redondo Trench Federal Way Station Area Grouping Exhibit 11 Federal Way Station Area Grouping Number of Residential Commercial Total Dev. Potential Station Area Res. Units SF SF (Res + Comm SF) Preferred Federal Way Transit Center Station 3,269 3,300,000 3,100,000 6,400,000 Federal Way I-5 Station 1,490 1,500,000 1,500,000 3,000,000 Federal Way S 320th Park-and-Ride Station 1,166 1,200,000 1,000,000 2,200,000 Federal Way Transit Center Station (SR 99) 3,241 3,200,000 3,000,000 6,200,000 Federal Way SR 99 Station 2,652 2,700,000 2,400,000 5,100,000 Relative to station areas in other groupings, the Federal Way station options offer a significant amount of (re)development potential. As shown in Exhibit 11, (re)development potential within station areas ranges from 2.2 to 6.4 million square feet. The Federal Way 320th Park and Ride Station option represents the low end of this range and the Preferred Federal Way Transit Center Station option represents the high end. The three station options located toward the center of Downtown Federal Way offer more development potential than the two options located near I 5. This is primarily due to the fact that there are a number of large parcels located in the center of downtown that have low improvement values and zoning that allows for development that is significantly denser than the existing development. Federal Way Link Extension 12 TOD STUDY ADDENDUM: APPENDIX A
development potential of")


31 Exhibit 12 illustrates the (re)development potential of parcels within each station area. Exhibit 12 Federal Way Station Area Grouping Preferred Federal Way Transit Center Federal Way I-5 Federal Way S 320th Park&Ride Federal Way Transit Center (SR 99) Federal Way SR 99 Federal Way Link Extension 13 TOD STUDY ADDENDUM: APPENDIX A
32 Corridor Development Potential Analysis Introduction The previous chapter describes the Station Area Development Potential. This section describes a separate Corridor Development Potential Analysis (Corridor Analysis) which was tested on two sample alignments to estimate the before and after effect of the project on the development potential of all parcels that Sound Transit has identified for acquisition along the entire corridor. The two sample corridors were the SR 99 Baseline Alternative which runs along SR 99, and the Preferred Alternative which runs along the west side of I 5. Each of these corridors contains three stations, including a Kent/Des Moines Station, a South 272nd Station, and a Federal Way Station. Methodology At a parcel level, The Corridor Analysis uses much of the same methodology as the Station Area Development Potential Assessment. However it differs in the following key ways: The Corridor Analysis does not consider the development potential of parcels within the quartermile station areas that are not directly impacted by the project. Instead of calculating the net new development potential of each parcel after light rail is in place, the Corridor Analysis measures the difference between a parcel s total development potential before and after the light rail is constructed. The Corridor Analysis estimates the before and after effect of the project on the development potential of all parcels that Sound Transit has identified for acquisition along the entire corridor, including parcels located between station areas. Exhibit 13 - Corridor Impact Analysis Exhibit 13 graphically depicts how development potential impact is calculated for a single, vacant residential parcel. Federal Way Link Extension 14 TOD STUDY ADDENDUM: APPENDIX A
33 Results Exhibit 14 Corridor Development Potential Analysis Results Corridor Residential Units Dev. Potential Impact Residential SF Dev. Potential Impact Commercial SF Dev. Potential Impact Total Dev. Potential Impact (Res.+ Comm SF) Preferred Alt , ,000 1,300,000 SR99 Baseline ,000 1,300,000 1,400,000 Alt As shown in Exhibit 14, the results of this analysis found that both Corridors will have a similar impact on total development potential. The main difference in terms of impact is that the SR 99 Baseline Alternative has more impact on potential commercial development than the Preferred Alternative, and less impact on potential residential development. Much of this difference is due to the fact that, with the exception of Federal Way, existing development along SR 99 is higher density commercial, while development along the west side of I 5 is primarily lower density residential. Federal Way Link Extension 15 TOD STUDY ADDENDUM: APPENDIX A