The City of Boise s Nutrient Control Approach and the Dixie Slough Offset Project
|
|
|
- Clemence Jenkins
- 5 years ago
- Views:
Transcription


1 The City of Boise s Nutrient Control Approach and the Dixie Slough Offset Project 2015 Annual Oregon ACWA Conference July 24, 2015 Robbin Finch, Water Quality Manager Boise City Public Works
2 Outline Sustainability and the City of Boise Regulatory Framework Dixie Slough Offset Project and Keys to Success Future Creative Strategy Opportunities

3 Sustainability is more than.

4 City of Boise
5 Each City has Unique Bar Code that Defines Best Fit Solution Carbon footprint impact of operations Maintain WWTF capacity to accommodate economic development Ensure manageable longterm cash flow 5


6 LIV and the Boise Wastewater Program West Boise WWTF Align Programs with Strategic Vision

7 Integration of LIV into Wastewater Program Energy Use Reductions: Part of Idaho Power Cohorts program EX: Lander Street Facility down ~14% in FY14 Dixie Drain Pollutant Trading: Improved environmental returnon-investment Improved cash flow Local Food Production: Crops grown at Farm sold to local farmers for livestock feed Solar Facility: 40 MW Facility at Farm Power for ~ 27,000 homes Boise WaterShed: Public outreach and education on environmental issues Carbon Footprint Quantification: Part of strategic decision making Resource Recovery: Methane gas for power Struvite as fertilizer Biosolids land applied at Farm Economic Development/ Innovation: Outreach to U of I and BSU Coordination with PDS and economic development Public-private partnerships


8 Consider Magnitude of Decisions Based on recent projections, over next 20 years: City will invest ~$140M in capital City will invest ~$67M in operations and maintenance To optimize planning and investment, integrated decision making necessary West Boise Lander Street Dixie Drain 8
9 Integrated Decision Making Process Business Case Evaluation (BCE) focused on selecting the preferred option that: Meets service levels unique to Boise Accounts for risk and benefit cost to deliver long term solution Delivers least life-cycle cost of ownership 9
10 1 BCE Steps Assemble Expert Team 2 Identify challenge and levels of service 3 Brainstorm alternatives and screen fatal flaws 4 Collect data on costs and benefits considering risk, environmental and community costs 5 Perform net present value analysis 6 Select Preferred alternative 10
11 Identify Levels of Service City s Comprehensive Plan defines goals and objectives Wastewater levels of service should consider goals and priorities Ensure Boise s wastewater decision align with City Vision and Mission 11
 Fragrance materials Polycarbonates Plasticizers Risk Approx.")
 15% (2023) 25% (2028) $2.25M (2018) $6.75M (2023) $11.")
12 Example: Technical Risk Cost Future NPDES regulations of microconstituents Pharmaceuticals UV blockers (sunscreen) Fragrance materials Polycarbonates Plasticizers Risk Approx. Capital Cost Annual O&M Costs Probability of Occurrence Annual Risk Cost (Capital) Annual Risk Cost (O&M) Microconstituent Limits $45M $3.6M 5% (2018) 15% (2023) 25% (2028) $2.25M (2018) $6.75M (2023) $11.25M (2028) $180K (2018) $540K (2023) $900K (2028)

13 Example: Developing Capital, O&M, Risk, and Benefit Costs Surface Water Risk Profile Reuse for Infiltration Risk Profile 13
14 Regulatory Framework


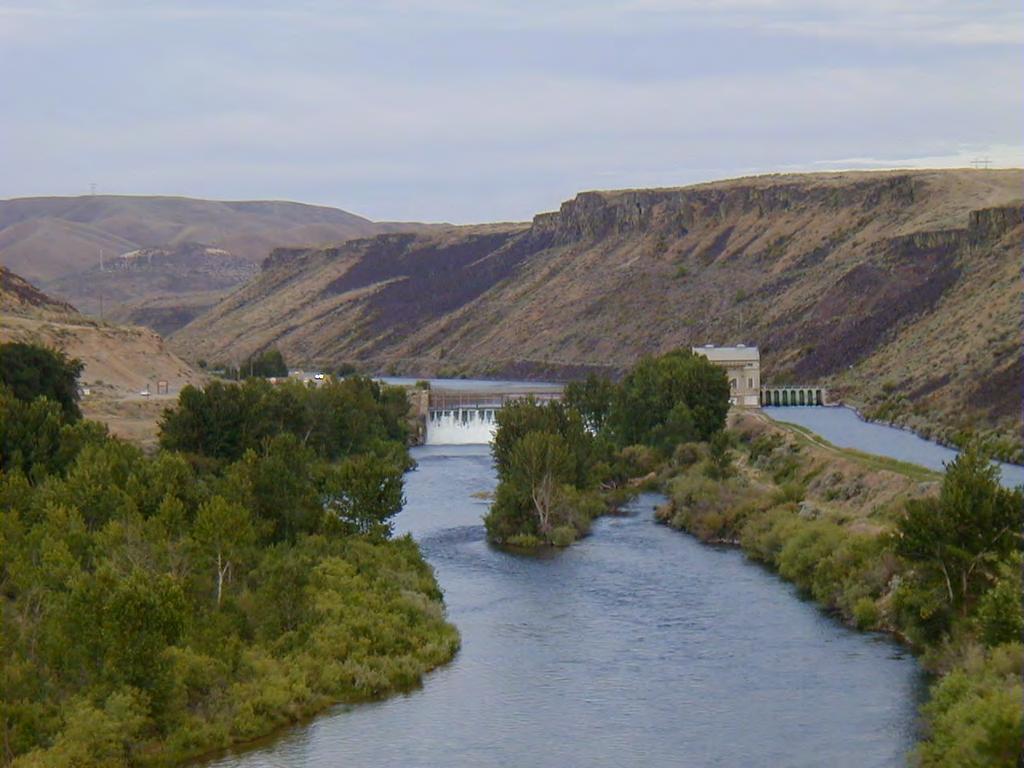
15 The Watershed 1,290 sq mile watershed 2 nd USBR Irrigation Project 3 major dams, 1 MAF of storage 176,000 Acres Irrigated Ag 75 % flood irrigated, 25% sprinkler 75 major diversions or returns/inputs in 64 river miles 5.3 million kg/yr Phosphorus applied annually 95% for ag purposes (USGS 2006) 1/3 of state population, rapidly urbanizing 11 WWTFs, 74 MGD capacity, 50 MGD discharge
16 High priority water quality-limited due to nutrients, temperature, sediment, pathogens, and D.O. Low priority water qualitylimited due to sediments, D.O., oil and grease P A Y E T T E G E M Boise Parma River Dixie Slough Conway Gulch Notus Hartley Gulch Middleton Willow Creek Star Boise Dry Creek Eagle B O I S E Caldwell River Snake O W Y H E E C A N Y O N River Lake Lowell Indian Creek Nampa Mason Creek Meridian Tenmile Creek BOISE Lucky Peak Reservoir Arrowrock Reservoir Kuna A D A E L M O R E
17
18

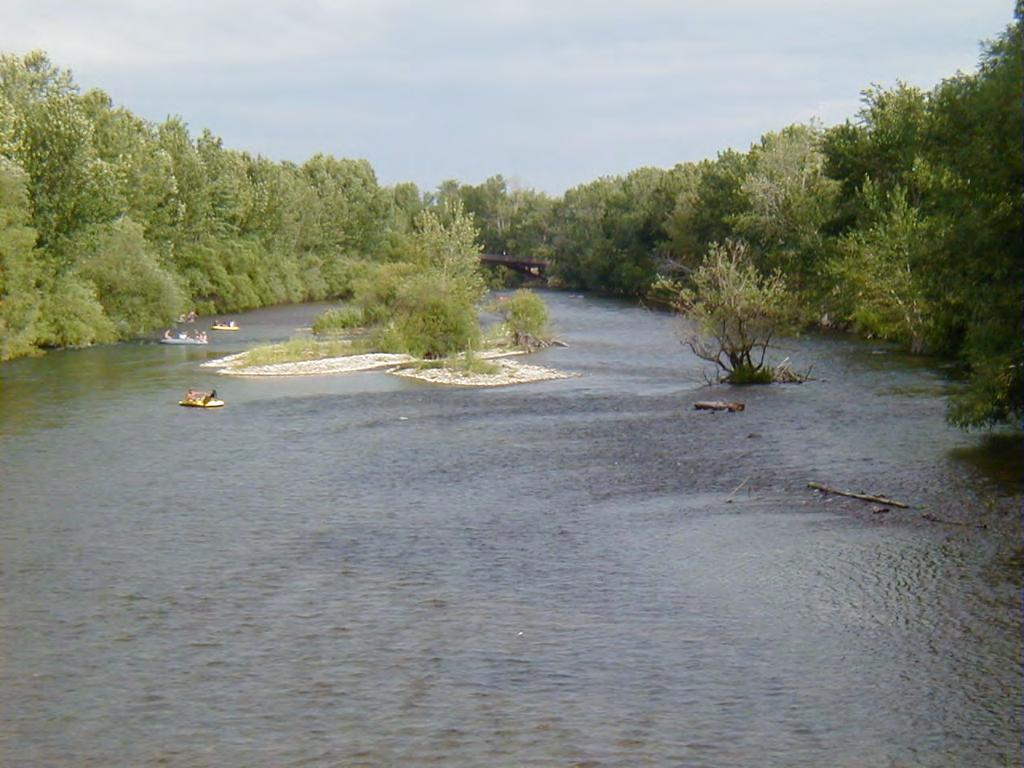
19 Boise/Mason Creek Confluence
 Lower Boise River Total Phosphorus TMDL (2015) Extraordinary")

20 Lower Boise Regulatory Drivers Snake River Hells Canyon TMDL (2004) Lower Boise TP: 70 ug/l, May September (77% reduction) Lower Boise River Total Phosphorus TMDL (2015) Extraordinary TMDL development Process & Transparency AQUATOX model and USGS Mass Balance Study based WWTFs: 100 ug/l May-September; 350 ug/l October-April MS4: 42% reduction NPS & Groundwater: 70 ug/l
21 Lower Boise Watershed Council Initiated in 1992, incorporated as 501(c)(4) in 1994 Includes all stakeholders (Muni and Industrial PS, NPS, Irrigators, NGOs ) Chemical, physical, biological monitoring USGS (1994-present) Build trust and understanding between stakeholders Improve knowledge/understanding of the watershed Designated Watershed Advisory Group for TMDLs Lower Boise River Trading Framework

22 Dixie Trade/Offset Opportunity Point Source + NPS TP reductions to meet water quality obligation Better environmental result Same cost as end of pipe solution

23 The Dixie Offset


24 Trading/Offset Success Lower Boise Trading Framework (2000) Clean Air Act Cap and Trade Acid Rain Program: 1990 SO2 trading 50% SO2 reduction with 40% increase power generation 2009 SO2 Market Value: $1.1 billion, Price: $61 per ton Significantly lower costs than anticipated