2015 Urban Water Management Plan. Adopted: June 14, 2016
|
|
|
- Bethanie Floyd
- 5 years ago
- Views:
Transcription

1 2015 Urban Water Management Plan Adopted: June 14, 2016
2 This page intentionally left blank

3 City of Folsom 2015 Urban Water Management Plan Final June 2016 Prepared by:
4 [This page intentionally left blank]

5 The City of Folsom s 2015 Urban Water Management Plan was prepared under the direction of a California licensed civil engineer.
6 [This page intentionally left blank]
7 Table of Contents CHAPTER 1. INTRODUCTION URBAN WATER MANAGEMENT PLANNING ACT PUBLIC PARTICIPATION AND AGENCY COORDINATION PLAN ADOPTION PREVIOUS REPORTS PLAN ORGANIZATION... 7 CHAPTER 2. WATER SYSTEM INFORMATION CITY OF FOLSOM SERVICE AREA AND GENERAL DESCRIPTION WATER DELIVERY SYSTEM... 6 CHAPTER 3. WATER SUPPLY CHARACTERISTICS INTRODUCTION EXISTING SURFACE WATER SUPPLIES AND ENTITLEMENTS GROUNDWATER RECYCLED WATER DESALINATED WATER TRANSFER AND EXCHANGE OPPORTUNITIES SUPPLY RELIABILITY CHAPTER 4. WATER DEMAND CONDITIONS REVIEW AND REFINEMENT OF GPCD TARGETS COMPLIANCE WITH 2015 INTERIM TARGET CURRENT AND FORECAST WATER DEMANDS... 5 CHAPTER 5. WATER DEMAND MANAGEMENT MEASURES CITY PARTICIPATION... 1 CHAPTER 6. WATER SHORTAGE CONTINGENCY PLAN WATER SHORTAGE CONTINGENCY RESOLUTION STAGES OF ACTION AND REDUCTION GOALS MANDATORY PROHIBITIONS ON WATER WASTE PENALTIES CONSUMPTION REDUCTION METHODS REVENUE AND EXPENDITURE IMPACTS REDUCTION MEASURING MECHANISM CATASTROPHIC SUPPLY INTERRUPTION MINIMUM SUPPLY NEXT THREE YEARS CURRENT DROUGHT... 5 CHAPTER 7. SUPPLY & DEMAND INTEGRATION NORMAL WATER YEAR CONDITIONS SINGLE DRY YEAR CONDITIONS MULTIPLE DRY YEAR CONDITIONS BUILD-OUT CONDITIONS... 3
8 [This page intentionally left blank]
9 List of Tables Table 1-1 Public and Agency Coordination Table 2-1 City of Folsom Climate Data Table 2-2 City of Folsom Historic Population and Projection Table 2-3 Land Use Summary Table 3-1 City of Folsom Water Right Summary Table 3-2 Normal Year Surface Supply Availability Table 3-3 Single Dry Year Surface Supply Availability Table 3-4 Multiple Dry Year Surface Supply Availability Table 3-5 WFA Surface Water Diversion Scenarios in the City s PSA Table 4-1 Revised Annual GPCD using 2010 Census Data Table 4-2 Comparison of baseline and target values Table 4-3 Annual GPCD for 2011 through Table 4-4 Existing Customer Characteristics Table 4-5 Future Customer Accounts and Demand Factors Table 4-6 Large Industrial Demands Table 4-7 Projected Water Demands Table 4-8 Lower Income Demands Table 5-1 CUWCC BPM Requirements Table 6-1 Drought Stages Contingency Plan Table 6-2 Stages of Penalties Table 6-3 Minimum Water Supply Available Table 7-1 Supply and Demand Comparison (Normal Year) Table 7-2 Supply and Demand Comparison (Single Driest-Year) Table 7-3 Supply and Demand Comparison (Multiple Dry Years) Table 7-4 Supply and Demand Comparison at Build-out
10 [This page intentionally left blank]
11 List of Figures Figure 2-1 City of Folsom Water Service Area Figure 2-2 Folsom Specific Plan Area Figure 2-3 Easton Plan Area Figure 2-4 City of Folsom Existing System, Future Easton Project, Future Folsom Specific Plan Area Figure 3-1 Regional Sacramento County Groundwater Basins
12 [This page intentionally left blank]
13 List of Appendices Appendix A A-1: A-2: A-3: A-4: Appendix B B-1: B-2: B-3: Appendix C C-1: C-2: DWR Recommended Tables DWR checklist SBX7-7 Compliance Form AWWA Water Audit Form Resolution adopting 2015 UWMP Copies of Notice Publications Copies of Notification Letters CUWCC Report Water Shortage Contingency Plan
14 [This page intentionally left blank]

, share part of the City s boundary.")
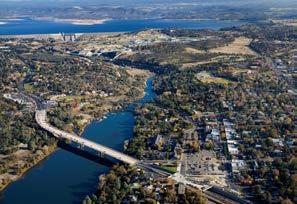
15 CHAPTER 1. INTRODUCTION The City of Folsom (City) was founded along the banks of the American River in The City was incorporated in 1946 and has been supplying water to the surrounding areas for nearly 160 years. The earliest water customers in the area had gold mining and agricultural interests. Over time, as rural communities transitioned to urban settlements, the City has become almost exclusively an urban water supplier 1. The namesake Folsom Dam and Folsom Lake Reservoir, both of which are part of the Central Valley Project (CVP), share part of the City s boundary. Folsom Dam regulates runoff from about 1,875 square miles of drainage area and the Reservoir provides flood control, water supply, hydropower, and recreation opportunities for the Sacramento area. The reservoir is the primary diversion point for all surface water supplies delivered throughout the City s service area. Folsom is located about twenty-three miles east of downtown Sacramento on the northeast edge of Sacramento County. The City currently serves about 27,000 af/yr 2 to a population of approximately 64,000 through nearly 19,000 metered connections. The City has prepared this 2015 Urban Water Management Plan (2015 UWMP) to comply with the Urban Water Management Planning Act (UWMPA) requirements for urban water suppliers. Note to DWR The City of Folsom has written this UWMP primarily as a water resources planning tool and secondarily to satisfy the requirements of the UWMPA. The body of the document provides narratives and discusses data that DWR requests in its 2015 UWMP Guidebook, including changes to the California Water Code since To facilitate review by DWR for compliance with the UWMPA, data from the body of the document has been transferred into DWR Tables consistent with the organization of the tables in Section E of the 2015 UWMP Guidebook Appendices. These tables are in Appendix A-1. Also, this UWMP has been reviewed for adequacy according to the UWMP Checklist as contained in Section F in the 2015 UWMP Guidebook. A completed checklist is included in Appendix A-2. The City s 2015 Urban Water Management Plan (2015 UWMP) documents the City s water management planning efforts to ensure adequate water supply to meet demands over the next 25 years. As required by the UWMPA, the City s 2015 UWMP specifically 1 The City of Folsom s boundaries are not coterminous with the City s water service areas. 2 This estimation applies to the existing water service area only and is derived from historical water use as well as existing additional growth and improved water efficiency. Use represents an estimate of recent demands without mandatory conservation. City of Folsom Urban Water Management Plan Final June 2016
16 assesses the availability of supplies to meet future demands during normal, single-dry and multiple dry years through Verification that future demands will not exceed supplies and assuring the availability of supplies in dry year conditions are critical outcomes of this UWMP. The 2015 UWMP is an update to the City s 2010 UWMP and presents new data and analysis as required by DWR and the California Water Code (CWC) since It is also a comprehensive water planning document which describes existing and future supply reliability, forecasts future demands, presents demand management progress, and identifies local and regional cooperative efforts to meet projected water use. The current four-year drought has emphasized the importance of planning ahead to meet water demands with potentially at-risk water supplies. Such forward planning is an important outcome of the 2015 UWMP, which also addresses the evolving impact of drought on City water supply and operations. 1.1 Urban Water Management Planning Act The Urban Water Management Planning Act requires every urban water supplier to prepare an urban water management plan pursuant to California Water Code et seq. 3 Because the City is an urban water supplier, it is preparing its 2015 UWMP consistent with the UWMPA. The 2015 UWMP provides a framework for water planning to minimize the negative effects of potential water shortages, and provides useful information to the public about the City and its water management programs. Specifically, the City s 2015 UWMP describes and evaluates the quality and reliability of the City s existing and planned water supplies to meet short-term and long-term customer water demands; especially availability and sufficiency of surface water assets and the vulnerability of these supplies to seasonal and climactic conditions. Groundwater is a miniscule component of the City s supply strategy as groundwater supplies within the City of Folsom are limited. 4 The UWMP also revisits baseline per-capita water use data and target conservation values, first developed and presented in the 2010 UWMP as required by CWC et seq., and assess compliance with those targets. This UWMP also includes narratives describing the City s water demand management measures 5, its long-term plan for efficient water use, and estimated future water savings based on water use projections are 3 An urban water supplier is a supplier, either publicly or privately owned, providing water for municipal purposes either directly or indirectly to more than 3,000 customers or supplying more than 3,000 acre-feet of water annually. CWC Groundwater Resources Study by Brown and Caldwell 5 As detailed in the CWC (f)(1) and (2). City of Folsom Urban Water Management Plan Final June 2016
17 included, where available. Also included are discussions regarding distribution system water loss, information on potential use of recycled water as a water source for the City, and the City s comprehensive water shortage contingency analysis, which details stages of action to be undertaken by the City in response to water supply shortages. 6 In short, this 2015 UMWP allows the City to assess and plan for on-going effective management of its water supplies to meet its evolving water demands. 1.2 Public Participation and Agency Coordination The UWMPA requires a water purveyor to coordinate the preparation of its UWMP with other appropriate agencies and organizations in and around its service area. This includes coordination with other water suppliers that share a common source, water management agencies, and relevant public agencies. Additionally, the City encouraged active involvement of other sectors of the population prior to and during the preparation of the plan. The City coordinated preparation of its UWMP with the entities listed in Table 1-1. Copies of the various notifications are included in Appendix B-3. Table 1-1 Public and Agency Coordination Coordinating Agencies Coordinate Sent Sent Copy of Notice of Regarding 60-Day Draft UWMP Public Hearing Demands Notice Cities, Counties, Customers and Interested Parties Sacramento County Sacramento County (Planning Department) United States Bureau of Reclamation - CVP San Juan Water District Southern California Water Company Placer County Water Agency Regional Water Authority Sacramento County Water Agency Sacramento Groundwater Authority El Dorado Irrigation District El Dorado County Water Agency City of Roseville Fair Oaks Water District Orange Vale Water Company Citrus Heights Water District Sacramento Suburban Water District General Public Note: The UWMP draft was made available 6 A recent amendment to CWC includes defining water features that are artificially supplied with water as part of this contingency analysis. City of Folsom Urban Water Management Plan Final June 2016
18 1.2.1 Water Forum Community leaders, along with water managers from Sacramento, Placer and El Dorado counties negotiated the Water Forum Agreement (WFA), which is a comprehensive package of linked actions that will achieve two coequal objectives: (1) Provide a reliable and safe water supply for the region's economic health and planned development through to the year 2030; and (2) Preserve the fishery, wildlife, recreational, and aesthetic values of the Lower American River. The District is a signatory to the Water Forum Agreement. Pursuant to the Water Forum provisions, the District has also developed best management practices that are consistent with the Demand Management Measures in the 2015 UWMPA Sacramento Groundwater Authority The City of Folsom co-developed the Sacramento Groundwater Authority (SGA) in 1998 as a collaborative and inclusive approach to sustainable groundwater management. Formation of SGA notably preceded California s 2014 Sustainable Groundwater Management Act (SGMA) 7, which requires the formation of local groundwater sustainability agencies to assess conditions in their local water basins and adopt locallybased management plans. SGA is a joint powers authority created to collectively manage groundwater resources in the North Area Groundwater Basin (North Basin), which includes Sacramento County north of the American River. In 2003, SGA adopted a groundwater management plan (GMP) that identifies management objectives for the North Area Groundwater Basin and includes several components aimed at monitoring and managing groundwater levels and quality in that basin. 8 In 2008, and again in 2014, SGA adopted an updated GMP to ensure that management objectives and responses remain responsive to developing needs. The groundwater management plan is designed to achieve an overarching objective of the Water Forum Agreement related to the North Area Groundwater Basin groundwater production that is within the groundwater basin s 131,000 af/yr 9 annual average sustainable yield as estimated in the Water Forum Agreement. SGA members have also developed a Water Accounting Framework (Framework), which establishes a set of policies and procedures that will encourage and support conjunctive use operations within the SGA area. The Framework will facilitate the long-term 7 The SGA preceded California s landmark 2014 Sustainable Groundwater Management Act and was recognized as a model program by one of the primary authors of the SGMA (Sacramento Business Journal, 2014). 8 A copy of the plan is available at 9 This value was estimated based on long-term average water use, supply conditions, and facilities in the basin at the time of the WFA. This value was not intended to be a fixed value that could not be modified as conditions and assumptions changed in the basin. City of Folsom Urban Water Management Plan Final June 2016
19 sustainability of the underlying groundwater basin as a source of public water supply. The Framework recognizes investments by the SGA member agencies in the development of conjunctive use programs and supports groundwater banking programs that enhance the long-term sustainability of the groundwater basin Central Sacramento County Groundwater Management Plan The City is also a founding member of the Central Sacramento County Groundwater Management Plan (CSCGMP). 10 The plan encompasses a larger portion of the City of Folsom and could be utilized in the future for groundwater extraction and groundwater banking. At this time, the City receives raw water deliveries derived from the Aerojet/Rocketdyne Groundwater Extraction and Treatment (GET) efforts in the Central Basin. These activities include delivering water from GET A and GET B to use at the Aerojet facilities in the Folsom Plan Area. The City has access to groundwater through two smaller wells in the Central Basin located at the Empire Ranch Golf Course. These wells are used to offset irrigation demand as much as possible throughout the year. Groundwater in the City of Folsom is limited by the underlying geology, where the underlying rocks hold and transmit little water, so it is a very small part of the City s service area supply. Despite these limitations, the Central Basin and North Basin water users implement conjunctive use operations that may offer exchange and banking opportunities for the City in the future. 11 Additional groundwater pumping and banking efforts are being examined as part of the City s long-term water management strategy Regional Water Authority The Regional Water Authority (RWA) is a joint powers authority that serves and represents the interests of 24 water providers in the greater Sacramento, Placer, El Dorado and Yolo County regions. The Authority's primary mission is to help its members protect and enhance the reliability, availability, affordability and quality of water resources. RWA has launched significant programs and services on a regional scale, including: (1) a water efficiency program designed to help local purveyors implement best management practices on a regional basis; (2) implementation of the American River Basin Regional Conjunctive Use Program to build and upgrade water facilities throughout the region to better manage surface and groundwater resources; and (3) development of an Integrated Regional Water Management Planning Program to 10 A full copy of the plan can be found at 11 Sacramento Groundwater Authority Groundwater Management Plan 2014, Section 2.3 Surface Water Resources. City of Folsom Urban Water Management Plan Final June 2016
20 continually identify the regional projects and partnerships that will help the region best meet its future water needs Additional Entities The City has shared water interests with a several other entities due to its water supply agreements and interconnections. These neighboring entities include Sacramento County, San Juan Water District, and El Dorado Irrigation District. A complete list of entities is included in Table 1-1. All of these entities, including the general public and adjacent water suppliers, were sent 60 day notices and encouraged to attend the public hearing prior to the adoption of the 2015 UWMP. A copy of the letter is provided in Appendix B Plan Adoption Prior to adoption of its UWMP, the City held a public hearing regarding its UWMP on June 14, Before the hearing, the City made a draft of the UWMP available for public inspection at Folsom City Hall at 50 Natoma Street. Pursuant to CWC Section 10642, general notice of the public hearing was provided through publication of the hearing date and time 12, and posting of the hearing at City Hall. The City Council received comments at the public hearing. As part of its public hearing, the District received community input regarding its implementation plan for complying with the water conservation requirements contained in CWC et seq., including the implementation plan s economic impacts. 13 Also, at the public hearing, the District presented the method for determining its urban water use target pursuant to CWC (b). The City of Folsom adopted its 2015 UWMP on June 14, A copy of the adopted 2015 UWMP will be provided to Sacramento County and the California State Library, and posted onto the City s website Additional Compliance The City plans to submit all required documentation related to the UWMPA soon after adoption. These include the required DWR UWMP Tables as Appendix A-1, the DWR Checklist as Appendix A-2, the SB X7-7 compliance forms as Appendix A-3, and the AWWA Water Audit worksheet as Appendix A See Appendix B-2 for copies of the published notices. 13 CWC The resolution adopting the 2015 UWMP is in Appendix B-1. City of Folsom Urban Water Management Plan Final June 2016
21 1.4 Previous Reports The 2015 City of Folsom UWMP has been prepared using a number of related planning documents and previous reports, including, but not limited to: S 2010 City of Folsom UWMP S City of Folsom, Bureau of Reclamation Five-Year Water Management Plan Update, Dec 2010 S Sacramento County General Plan of S Regional Water Authority Integrated Regional Water Management Plan (IRWMP) S Sacramento Groundwater Authority, Groundwater Management Plan 2014 S Central Sacramento Basin Groundwater Management Plan Plan Organization This UWMP is organized as follows: S Chapter 2 provides a description of the City s (a) service area, including climate; demographic and population characteristics; and current and projected land-use changes integral to the demand forecasts, and (b) water system, including the potable and non-potable delivery systems. S Chapter 3 describes the City s current and future water supplies and the reliability of the supplies. S Chapter 4 details the demands on the City s system, including the past and future estimated demands. S Chapter 5 provides information regarding the City s demand management measures. S Chapter 6 discusses the City s water shortage contingency plan. S Chapter 7 compares the City s supplies and demands in normal and dry years. The appendices include background information, details, and necessary supporting documents. City of Folsom Urban Water Management Plan Final June 2016
22 [This page intentionally left blank] City of Folsom 2015 Urban Water Management Plan Final June
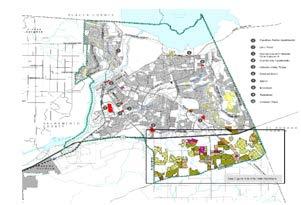
23 CHAPTER 2. WATER SYSTEM INFORMATION 2.1 City of Folsom Service Area and General Description The City of Folsom is a public agency that provides potable water directly to its residential and business customers. The City s boundaries are not coterminous with the City s water service areas. San Juan Water District (SJWD) supplies retail water service to the American River Canyon Area, which is within the City s boundaries. The City purchases wholesale water from SJWD for the Ashland Area, which is also within the City s boundaries. The City in turn provides retail water service to the customers in the Ashland Area. El Dorado Irrigation District will provide water to a small portion of the Folsom Plan Area south of Highway 50 along the Sacramento County and El Dorado County border. The Easton Development (Nimbus) is in the unincorporated area of Sacramento County that is included in the City s water service area. The current service area is divided into six (6) zones, with Zone 1 in the western part of the service area a Zone 6 on the eastern border of the service area. The Easton Development is located south of Zone 1, south of U.S. Highway 50, west of Prairie City Road. Water service area is shown in Figure 2-1. Figure 2-1 City of Folsom Water Service Area City of Folsom Urban Water Management Plan Final June 2016
24 2.1.1 Climate Climate data for the City of Folsom service area was obtained from local reporting stations with the same microclimate characteristics as the City s service area. The City has cool and humid winters with hot and dry summers. The rainy season begins in November and ends in March, with the lowest humidity occurring in the summer months. Standard monthly average evapotranspiration (ETo) data was obtained from the California Irrigation Management Information System (CIMIS) station located in Fair Oaks, California, which is just west of the City of Folsom service area about 4 miles from the City center. Evapotranspiration varies seasonally, and during a drought the significance of evapotranspiration is magnified because it continues to deplete surface and soil water supplies that are not being replenished by sufficient precipitation. The City closely monitors rates of ETo. Average annual ETo for the period measured inches. Average precipitation and temperature data was also obtained from the CIMIS station 131 in Fair Oaks. For the period , average annual rainfall was measured as inches. The wettest months are December, January and February, and the driest months are normally July and August. For the same time period, average daily maximum and minimum temperature was recorded by month. Typically, July and August are the hottest months of the year with an average daily temperature of about 75 degrees Fahrenheit, though daytime high temperatures average close to 92 degrees. December and January are generally the coolest months of the year, with an average annual temperature of about 55 degrees, with the average minimum dipping down to 49 degrees. All evapotranspiration (ETo), rainfall, and temperature data is provided in Table 2-1. City of Folsom Urban Water Management Plan Final June 2016
25 Standard Monthly Average ETo (inches) Table 2-1 City of Folsom Climate Data Average Precipitation (inches) Average Temperature (Fahrenheit) Average Maximum Temperature (Fahrenheit) Average Minimum Temperature (Fahrenheit) Month January February March April May June July August September October November December Annual : DWR CIMIS Data, Fair Oaks Station 131, Demographics and Population Characteristics The population served by the City includes a mix of users and user classes. This includes residential, as well as commercial, industrial, and public customers. Population estimates were derived from census data following the methods set forth by DWR. The historic population for the District s service area is presented in the left side of Table 2-2. Table 2-2 also includes a population projection through build out (BO) which should occur around 2050 according to Sacramento Area Council of Governments (SACOG) Blueprint plan. 15 The timing of the City s actual buildout will depend on a number of factors and market conditions but the SACOG timing is in line with a long-term average growth rates. The majority of the City growth will be in the new developments south of Highway 50 but not all areas in the City boundary are consistent with the water service boundary. These current and future differences between the administrative and water service boundaries necessitated the use of the DWR population tool rather than simply using DOF tables. These south of 50 developments will increase the population to nearly double its current number City of Folsom Urban Water Management Plan Final June 2016
26 Table 2-2 City of Folsom Historic Population and Projection Year Population Year Population , , , , , , , , , , , , ,351 BO 114, , , , ,536 Note: * The left side population was determined using the DWR Population tool. The right column future population estimates are calculated from the housing unit growth anticipated by the City and a persons per household number Current and Projected Land Use The City currently serves a variety of land use including residential, industrial, retail and commercial customers. The current and projected population shown in Table 2-2 reflects these land uses, with the increased population reflecting proposed development, as well as continued growth. In 2012 the City annexed the Folsom Specific Plan Area (FSPA), which covers 3,513 acres along the southern edge of the City south of U.S. Highway 50, bounded by the Sacramento/El Dorado County boundary to the east and Prairie City Road to the west. 16 The FSPA is shown in Figure 2-2. The FSPA is being developed consistent with the City s Housing Element 17 and the Plan Area planning principles, the FPASP proposes a mix of residential, commercial and public uses. The Easton Place/Glenborough development is located in an unincorporated area of Sacramento County outside the City limits but within the City s water service area since In 1994 Sacramento County designated the land Aerojet Special Planning Area 16 The City completed the Folsom Plan Area Water Master Plan in October City of Folsom Housing Element adopted 14 July See California Public Utilities Commission Decision No , and dated January 24, 1967, which authorized the City to provide water service within the service area designated in the decision in connection with the acquisition by the City of certain water facilities and water supplies from Southern California Water Company. City of Folsom Urban Water Management Plan Final June 2016


27 which allowed owners to submit Land Use Master Plans. The development is situated on approximately 1,380 acres south of Highway 50 and Folsom Boulevard east of Hazel Avenue as shown in Figure 2-3. Figure 2-2 Folsom Specific Plan Area Figure 2-3 Easton Plan Area Table 2-3 presents anticipated total growth by land-classification from the adopted Folsom Specific Plan Area Plan for the FSPA as well as the Easton Project. City of Folsom Urban Water Management Plan Final June 2016
28 Table 2-3 Land Use Summary Land-class Folsom Specific Plan Area Easton Project Dwelling Units Acres Dwelling Units Acres Multi-Family 5, , Single Family 5,376 1,176 2, Commercial/Industrial Schools Parks Municipal 0 10 Total Acres 3,565 1,383 Note: Roadways and Open Space acreages are not listed in the land-classes 2.2 Water Delivery System The City s obtains its surface water supply at two diversion points. The first draws water directly from Folsom Reservoir. The second diversion point is on the Folsom South Canal (FSC). The City, through its water service contracts, has the ability to develop an intake facility at the Folsom South Canal but has not yet done so. The water delivery system is described in greater detail in Chapter 3. As discussed previously, the City produces only minimal supply from groundwater and none of that supply augments its potable water system. Figure 2-4 shows the current and proposed water delivery system Potable Delivery System For areas south of the American River, the City takes deliveries from the Natoma Pipeline, a 42-inch steel pressure pipe that originates at Folsom Dam. The Natoma Pipeline splits into two separate lines: one line to the Folsom Prison water treatment plant, and one line to the Folsom Water Treatment Plant (Folsom WTP). This water is measured through the Folsom PIA ultrasonic meters, a 36-inch (97 percent accuracy) and a 24- inch (98.5 percent accuracy). At the inlet to the Folsom WTP, the raw water line splits. A portion of the raw water is delivered to the Willow Hill Reservoir through a 30-inch reinforced concrete pipeline equipped with a propeller meter. This portion of the water serves non-potable industrial uses on the Aerojet Industrial Property. Recently, Groundwater Extraction and Treatment (GET) A and B facilities are being used to serve a majority of Aerojet s needs. The balance of the water is delivered to the Folsom WTP through a 60-inch ultrasonic meter (95 percent accuracy) and is treated. After treatment at the City s plant, water is stored and pumped through a system of reservoirs and pumping stations to seven pressure zones within the City, and a small pressure zone in Southwest Folsom (the Nimbus Zone) that extends slightly beyond the City limits. City of Folsom Urban Water Management Plan Final June 2016

29 For the Ashland Area, water is diverted from the Folsom Reservoir and piped to the Sydney N. Peterson Water Treatment Plant, which is owned and operated by San Juan Water District (SJWD). After treatment, water is stored in Hinkle Reservoir until SJWD releases it and pumps or delivers it by gravity flow to the Ashland Area. While SJWD provides water supplies to the Ashland Area, the City physically serves the SJWD water to customers in the Ashland service area. The water is measured through a 24-inch magmeter with a ± 0.50 percent accuracy. Figure 2-4 City of Folsom Existing System, Future Easton Project, Future Folsom Specific Plan Area Map from FPA Water Master Plan - (Brown & Caldwell, 2014). City of Folsom Urban Water Management Plan Final June 2016
30 2.2.2 Non-Potable and Recycled Water Systems The City does not currently deliver any recycled water. The City s wastewater is delivered to Sacramento Regional County Sanitation District. The City does, however, deliver remediated water supplies to Aerojet at its industrial facilities derived from GET A and GET B. These remediated supplies offset raw water demands on the City s water system that are derived from its water rights and entitlements and delivered from Folsom Reservoir. The FSPA incorporates recycled water supply and storage in future water demand management planning. 20 As such, the City is developing water assets and facilities that could deliver and utilize recycled, non-potable or reclaimed water assets. 20 Folsom Plan Area Water System Master Plan City of Folsom Urban Water Management Plan Final June 2016
31 CHAPTER 3. WATER SUPPLY CHARACTERISTICS 3.1 Introduction Section 3 describes the City of Folsom s (City s) existing and planned water supplies through an analysis of its various surface water and groundwater rights. The majority of the City s water supplies are derived from surface water rights based upon its pre-1914 appropriative right filings and a contract with the Bureau of Reclamation. The City also uses a portion of its groundwater assets on a golf course and has established rights to Groundwater Extraction and Treatment (GET) water derived from the Aerojet-Rocketdyne groundwater contamination. Further, the City has water assets and delivery arrangements with San Juan Water District for service in the American River Canyon Area and the Ashland Area. Last, the City has water asset and delivery arrangements with El Dorado Irrigation District for water service in the eastern portion of the Folsom Plan Area that lies within EID s service area boundary. All of the City s water supplies are subject to reduction under certain conditions. These conditions may manifest through (a) hydrological circumstances, like a drought; (b) the City s contractual relationships, like the Water Forum Agreement; and (c) legal and regulatory constraints, like species protection in the Sacramento-San Joaquin Bay Delta. The water supply reductions impact the availability of each water asset in a different way that implicates the City s operations and long-term planning. All of these aspects of the City s water supplies are outlined in the text below. 3.2 Existing Surface Water Supplies and Entitlements The City-controlled surface water supplies serve the Folsom Service Area West, Folsom Service Area East, and Nimbus Service Area. These City controlled water assets will also serve a majority of the Folsom Plan Area south of Highway 50. Collectively, these service areas are referred to in this document as the Folsom Service Area. The City also has groundwater assets available for these service areas that are derived from appropriative groundwater rights as well as access to Aerojet GET water described later in this section. The surface water supplies were developed through different circumstances and, as such, are subject to unique conditions and limitations. These conditions and limitations affect the volume of water available under certain hydrological and regulatory settings. The surface water supplies for Folsom Service Area are listed below. The five surface water supplies are summarized in Table 3-1. City of Folsom Urban Water Management Plan Final June 2016
32 S A pre-1914 appropriative water right for 22,000 acre-feet per year S A pre-1914 appropriative water right for 5,000 acre-feet per year S A Central Valley Project (CVP) contract entitlement for 7,000 acre-feet per year S Contract rights with San Juan Water District S EID Water Service Agreement to Folsom Plan Area The City s surface water supplies have additional limitations that may impact where and when each source can be used. We describe these additional limitations in the detailed description of each water asset below. Table 3-1 below identifies each of the City s surface water assets. Table 3-1 City of Folsom Water Right Summary Water Right Supply Diversion Point Place of Use Transferable Pre-1914 Appropriative Right 22,000 GSWC Contract 5,000 Folsom Reservoir Folsom South Canal Folsom Reservoir Folsom South Canal Folsom Service Area Folsom Service Area Yes Yes CVP Fazio Contract 7,000 Folsom Reservoir Folsom East Area Yes Ashland Area Contract 1,540 Folsom Reservoir Ashland Area No GET A and GET B Supply 3,250 Direct Application Folsom South Canal Folsom Service Area Yes Total Supply 38, Pre-1914 Rights for 22,000 Acre-Feet per Year The City s 22,000 acre-foot entitlement is based on a pre-1914 appropriative right from the South Fork of the American River established by the Natoma Water Company in Natoma Water Company s original pre-1914 water right established a maximum diversion rate to fill a Canal Eight feet wide and Four feet deep with a current running ten miles per hour. This correlates to a diversion rate of 60 cubic feet per section (cfs) and a maximum allocation of 32,000 acre-feet per year. This right is held jointly with Golden State Water Company (GSWC) pursuant to a co-tenancy agreement. The co-tenancy agreement means that both the City and GSWC have the right to use the water to the fullest extent possible as desired by the respective entities. The City and GSWC have allocated the supplies under the entire 32,000 acre-foot water right. The City unilaterally controls 22,000 acre-feet and GSWC controls the remaining 10,000 acre-feet. The place of use under the City s pre-1914 right includes a wide area that encompasses the City and additional surrounding areas (including Easton Place/Glenborough) that made up City of Folsom Urban Water Management Plan Final June 2016
33 the boundaries of the Natoma Water Company. The pre-1914 appropriative right status of this water asset makes it more flexible in delivery to additional locations so long as those deliveries do not injure other legal users of water. The 1851 filing is the earliest in priority of perfected appropriative rights on the South Fork of the American River and is recorded. The entire 22,000 acre-feet of this water right is formally recognized in the settlement agreement between the U.S. Bureau of Reclamation ("Reclamation") and the City of Folsom. Under this agreement, Reclamation delivers this entire water supply without reduction on a permanent basis. This water asset may be diverted at its point of diversion in the water right itself, as well as Folsom Reservoir and Folsom South Canal pursuant to the Settlement Agreement. The City currently diverts the water at Folsom Reservoir in order to deliver that supply to its water treatment plant. In 2015, the ability to divert this water at Folsom Reservoir proved vulnerable because reservoir elevation forecasts indicated that the level would drop below the physical intake. In response to this, Reclamation in partnership with agencies dependent upon Folsom Reservoir diversion developed a physical pumping solution that would modify how the water would be delivered to the intake in the case of extreme drought conditions. In 2015, the driest year in the last 100 years in California, the State Water Resources Control Board curtailed some pre-1914 appropriative water rights with priority dates as early as The City s 1851 water right was protected from curtailment because of its seniority. As such, the entirety of this water right is available to the City in all year types. Furthermore, the United States Bureau of Reclamation must deliver the entire supply under this water asset in all year types Pre-1914 Rights for 5,000 Acre-Feet per Year The City s 5,000 acre-foot entitlement is also based on Natoma Water Company s pre-1914 appropriative water right from the South Fork of the American River. In November 1994, the City executed a contract with Southern California Water Company-Folsom Division (SCWC) under which the City acquired the right to lease 5,000 acre-feet of water per year. As described above, SCWC controlled the remaining 10,000 acre-feet of the 32,000 acrefoot total water right under the original co-tenancy Natoma Water Company purchase. As such, the basis of this water asset is held with Golden State Water Company pursuant to the co-tenancy agreement but the lease of the water asset to the City is pursuant to a lease agreement. This water right is also formally recognized in the settlement agreement between Reclamation and the City of Folsom. This water asset for 5,000 acre-feet has the same diversion provisions as does the 22,000 acre-foot diversion right above since both assets are derived from the same water right. Moreover, this water asset has the same priority as the 22,000 acre-foot water asset which makes it extremely resilient against drought conditions and regulatory curtailment. City of Folsom Urban Water Management Plan Final June 2016
34 3.2.3 CVP Project Contract Right up to 7,000 Acre-Feet per Year On April 8, 1999, Reclamation entered into Contract No W1372 with the Sacramento County Water Agency (SCWA) under Section 206 of Public Law The contract dedicated 22,000 acre-feet of water to SCWA, commonly called Fazio Water. The City was specifically named in the SCWA-Reclamation contract as a subcontractor to gain benefit of a portion of the Fazio Water supply. On April 25, 2000, SCWA entered into a separate contract with the City to provide 7,000 acre-feet of the 22,000 acre-feet of Fazio Water. The Fazio Water supply is a standard Central Valley Project (CVP) Project Supply water entitlement derived entirely from federal Central Valley Project water supplies. More specifically, the Fazio water is derived solely from American River water rights held by the Bureau of Reclamation for diversion and storage at Folsom Reservoir. Reclamation s CVP water rights are junior to water rights that existed prior to the development of the CVP. In other words, in the case of shortages, the CVP water rights are curtailed before other, more senior water rights, are curtailed. In both 2014 and 2015, the CVP water rights on the American River were curtailed forcing Reclamation to release water (not store water) from Folsom Reservoir in order to meet the natural flow conditions for downstream senior water right holders. The Fazio Water contract entitlement for the City of Folsom is fairly reliable. In normal and wet years, the City may call upon the supply for delivery and should receive 100 percent allocation. In dry years, the water supply is subject to Reclamation s Municipal and Industrial Water Shortage Policy (M&I Shortage Policy). Under this policy, water supplies are reduced from a baseline volume depending upon the inflow and storage conditions. The baseline volume is calculated by averaging the last three years of use under normal supply conditions and incorporating other details to account for variability like actual demand expansion and other minor adjustments. As an example, if the City s contract was for 7,000 acre-feet but City had used (or calculated use) of 5,000 acre-feet over the course of the last 3 normal water years, then the City s baseline from which to measure supply reduction is 5,000 acre-feet. The supply reduction under the M&I Shortage Policy, then is calculated against the baseline. Before the extreme drought conditions of 2014 and 2015, the maximum project reduction for north of Delta municipal and industrial water purveyors was 75 percent of baseline demand. In 2015, however, conditions were so extreme, that the CVP allocation was cut to 25 percent of baseline demand. For a City like Folsom, the potential for future reductions is real in light of supplies available in Folsom lake and the American River watershed. However, the worst-case scenario for CVP contract entitlements is delivering water in order to meet Health and Safety Conditions. These conditions represent a maximum demand reduction and allow a purveyor to deliver water to provide the most City of Folsom Urban Water Management Plan Final June 2016
35 minimal level of sustainability for its end users. The City considers the M&I Shortage Policy to limit dry year supplies to 75 percent of historical average except in the case of an extreme drought. The single dry year supply reliability number as well as the first two years of a multi-year drought reliability number is 5,250 acre-feet. For purposes of that assessment, the City will consider a 50 percent supply allocation in the third year of a multiyear drought. In the third year of a multi-year drought, the CVP Fazio supply reliability number is 3,500 acre-feet. All other supply reductions would consist of emergency conditions and be accompanied by severe water restrictions mandated by the State of California (as done in 2015) that would offset supply reliability concerns. These supply reliability numbers are shown in Tables 3-2 through 3-4 below. The City is working with Sacramento County Water Agency and the United States Bureau of Reclamation to assign the City s 7,000 acre-foot portion the CVP Fazio Water Contract from SCWA to the City. The purpose of this assignment is to consolidate the City s water assets derived from the City s relationship with Reclamation in order to better facilitate administrative issues associated with those water assets Contract Rights with San Juan Water District The City has a contract with the San Juan Water District (SJWD) for water use on City lands on the north side of the American River. There are two areas located here: the Ashland Area and the American River Canyon Area. In the Ashland Area, the City controls the water conveyance facilities but the water provided to those facilities is delivered by San Juan Water District. In the American River Canyon Area, SJWD provides all water services. Water service to these two areas is subject to the San Juan Water District and City of Folsom Wholesale Water Supply Agreement (Agreement) that was signed on September 26, 2007 and the subsequent Amendment dated January 1, The Agreement covers water service to the Ashland Area as well as the American River Canyon Area. Under this Agreement, SJWD provides surface water assets to the City to serve the Ashland Area. SJWD agrees to serve the Ashland Area in the City and could reduce allocations to the City in times of water shortage. It would reduce its deliveries to the City in pursuant to SJWD s Surface Water Supply and Water Shortage Management Plan. 21 At this time, SJWD has significant water assets that are very reliable and curtailment of the water supplies is unlikely. Nevertheless, out of an abundance of caution we reduce this supply to 1,000 acre-feet in the second and third years of a multi-year drought. For the American River Canyon Area, the Agreement upholds the findings in the Case City of Folsom v. San Juan Suburban Water District that was decided in Under that 21 Article 6 H San Juan Water District and City of Folsom Wholesale Water Supply Agreement as amended by Amendment 1 to San Juan Water District and City of Folsom Wholesale Water Supply Agreement dated January 1, City of Folsom Urban Water Management Plan Final June 2016
36 finding, San Juan provides the retail water service to the end users residing in the American River Canyon Area. The Agreement does, however, allow the City the first right of refusal to become the retail provider for water in this area should SJWD seek to cease water service within the City of Folsom jurisdictional boundaries El Dorado Irrigation District Water Supply El Dorado Irrigation District (EID) will provide the water supply to meet demands of 530 residential dwelling units. 22 Like the American River Canyon Area related to SJWD mentioned in Section 3.2.4, EID will be the sole provider of this water supply to the development. As such, this supply is not incorporated into the supplies available to the City of Folsom. This water supply is derived from EID s pre-1914 water rights, its American River water rights (Project 184), and its Central Valley Project contract entitlement. The delivery protocols and total volumes from identified sources have not yet been identified. Supply Source (values in acre-feet/yr) Table 3-2 Normal Year Surface Supply Availability Pre-1914 Appropriative Right 22,000 22,000 22,000 22,000 22,000 22,000 GSWC Contract 5,000 5,000 5,000 5,000 5,000 5,000 CVP Fazio Contract 7,000 7,000 7,000 7,000 7,000 7,000 Ashland Area Contract 1,540 1,540 1,540 1,540 1,540 1,540 Total Potable Supply 35,540 35,540 35,540 35,540 35,540 35,540 GET A and GET B Raw Water 3,250 3,250 3,250 3,250 3,250 3,250 Total Water Supply 38,790 38,790 38,790 38,790 38,790 38,790 Supply Source (values in acre-feet/yr) Table 3-3 Single Dry Year Surface Supply Availability Pre-1914 Appropriative Right 22,000 22,000 22,000 22,000 22,000 22,000 GSWC Contract 5,000 5,000 5,000 5,000 5,000 5,000 CVP Fazio Contract 5,250 5,250 5,250 5,250 5,250 5,250 Ashland Area Contract 1,540 1,540 1,540 1,540 1,540 1,540 Total Potable Supply 33,790 33,790 33,790 33,790 33,790 33,790 GET A and GET B Raw Water 3,250 3,250 3,250 3,250 3,250 3,250 Total Water Supply 37,040 37,040 37,040 37,040 37,040 37, Folsom Specific Plan Area SB 610 Water Supply Assessment, October 29, 2009, at page 5. City of Folsom Urban Water Management Plan Final June 2016
37 Supply Source (values in acre-feet/yr) Table 3-4 Multiple Dry Year Surface Supply Availability Multi-dry Year 1 (same as "Single-dry") Pre-1914 Appropriative Right 22,000 22,000 22,000 22,000 22,000 22,000 GSWC Contract 5,000 5,000 5,000 5,000 5,000 5,000 CVP Fazio Contract 5,250 5,250 5,250 5,250 5,250 5,250 Ashland Area Contract 1,540 1,540 1,540 1,540 1,540 1,540 Total Potable Supply 33,790 33,790 33,790 33,790 33,790 33,790 GET A and GET B Raw Water 3,250 3,250 3,250 3,250 3,250 3,250 Total Water Supply 37,040 37,040 37,040 37,040 37,040 37,040 Multi-dry Year 2 Pre-1914 Appropriative Right 22,000 22,000 22,000 22,000 22,000 22,000 GSWC Contract 5,000 5,000 5,000 5,000 5,000 5,000 CVP Fazio Contract 5,250 5,250 5,250 5,250 5,250 5,250 Ashland Area Contract 1,000 1,000 1,000 1,000 1,000 1,000 Total Potable Supply 33,250 33,250 33,250 33,250 33,250 33,250 GET A and GET B Raw Water 3,250 3,250 3,250 3,250 3,250 3,250 Total Water Supply 36,500 36,500 36,500 36,500 36,500 36,500 Multi-dry Year 3 Pre-1914 Appropriative Right 22,000 22,000 22,000 22,000 22,000 22,000 GSWC Contract 5,000 5,000 5,000 5,000 5,000 5,000 CVP Fazio Contract 3,500 3,500 3,500 3,500 3,500 3,500 Ashland Area Contract 1,000 1,000 1,000 1,000 1,000 1,000 Total Potable Supply 31,500 31,500 31,500 31,500 31,500 31,500 GET A and GET B Raw Water 3,250 3,250 3,250 3,250 3,250 3,250 Total Water Supply 34,750 34,750 34,750 34,750 34,750 34,750 City of Folsom Urban Water Management Plan Final June 2016
38 3.2.6 Water Forum Agreement Community leaders, along with water managers from Sacramento, Placer and El Dorado counties negotiated the Water Forum Agreement (WFA). The WFA is a comprehensive package of linked actions that will achieve two coequal objectives: (1) Provide a reliable and safe water supply for the region's economic health and planned development through to the year 2030; and (2) Preserve the fishery, wildlife, recreational, and aesthetic values of the Lower American River. The City of Folsom is a signatory to the Water Forum Agreement. The City s Water Forum purveyor specific agreement (PSA) states that, under certain conditions, the City would take specific water management actions under a range of hydrologic events that are linked primarily to the American River Basin and Folsom Reservoir. The water management actions could impact the availability of water to the City under its water rights and entitlements in order to make water available to meet Lower American River flow requirements. Pursuant to the Water Forum provisions, the City has also developed best management practices that are consistent with the Demand Management Measures in the 2015 UWMPA. Under the conditions applicable under the City s PSA, the City s water diversions may be limited depending on the identified year type. Under the PSA, however, the City is not required to implement the Water Forum actions unless its foregone water supplies are made up by alternative water supplies provided by the other purveyors. Nevertheless, an average or wet year is defined under the Agreement as unimpaired inflow into Folsom Reservoir from March through November that exceeds 950,000 acre-feet per year. The probability of an average or wet year inflow of this volume is 82 percent, meaning that this inflow has occurred approximately 8 out of every 10 years. 23 Accordingly, even under its PSA, the City has a good chance of receiving its full annual surface water allocations from Folsom Reservoir in any given year. In drier years defined by the Water Forum Agreement as Stages 1, 2, and 3 the City s PSA states that, under certain conditions, the City would reduce its diversions from Folsom Reservoir. These reductions are relatively proportional to reductions in March through November unimpaired inflow into Folsom Reservoir of less than 950,000 but equal to or more than 400,000. The decreased inflows could require the City s allowable surface diversions to drop from 34,000 acre-feet to 22,000 acre-feet, separated into a three-stage stepped and ramped reduction in proportion to the decreased inflows. These reductions are known as the Water Forum Wedge and illustrated below in Table The State of California Department of Water Resources (DWR) conducts annual snowpack surveys and provides a forecast of runoff for the American River watershed along with other watersheds in the State beginning in February and ending in May of each year. Results of these four surveys are published annually in a series of State DWR Bulletins (Bulletin through 120-4) and are the basis for determining the unimpaired inflow into Folsom Reservoir; Water Forum Proposal Final EIR, October 1999 at Appendix I. City of Folsom Urban Water Management Plan Final June 2016
39 S Under Stage 1 reductions where the unimpaired inflow to Folsom Reservoir is greater than 870,000 acre-feet but less than 950,000 acre-feet, the City could divert a decreasing amount from 34,000 acre-feet to 30,000 acre-feet in proportion to the reduced flow into Folsom Reservoir. S Under Stage 2 reductions where the unimpaired inflow to Folsom Reservoir in March through November is greater than 650,000 acre-feet but less than or equal to 870,000 acre-feet, the City could divert a maximum of 27,000 acre-feet. S Under Stage 3 when the unimpaired inflow to Folsom Reservoir in March through November is equal to or greater than 400,000 acre-feet but less than or equal to 650,000 acre-feet, the City could divert a maximum of 22,000 acre-feet. The differences in these staged reductions are important. Stage 1 reductions are different than Stage 2 and Stage 3 reductions because the reduced Stage 1 surface supply diversion is directly proportional to the decreased inflow. Under Stages 2 and 3, diversion rates are set based on the stated range of inflow into Folsom Reservoir. Accordingly, diversion reductions under Stage 1 may require different types of supply augmentation mechanisms than those required under the other two stages. In the driest years also called the conference years when the March through November unimpaired inflow to Folsom Reservoir is less than 400,000 acre-feet, the City PSA states that, under certain conditions, the City could reduce diversions to a maximum of 20,000 acre-feet. The City s PSA also states that the City could further reduce diversions in the driest years to 18,000 acre-feet by imposing extra-ordinary conservation measures throughout its service area. A Conference Year was called in Although the City s PSA describes this significant surface diversion reduction in the driest years, the Water Forum Agreement has the following caveat: [I]t is recognized that in years when the projected unimpaired inflow to Folsom Reservoir is less then 400,000 acre-feet there may not be sufficient water available to provide the purveyors with the driest years quantities specified in their agreements and provide the expected driest years flows to the mouth of the American River. In those years the City will participate in a conference with other stakeholders on how the available water should be managed. City of Folsom Urban Water Management Plan Final June 2016
40 Table 3-5 WFA Surface Water Diversion Scenarios in the City s PSA Water Forum Year Type Average or Wet Year Stage 1 Stage 2 Stage 3 Driest Years (conference years) The Water Forum Agreement included a key provision that, in consideration for its reduction in diversion and use of its surface water entitlements from Folsom Reservoir and the American River, Folsom will enter into agreements with other purveyors that have access to both surface water and groundwater for an equivalent exchange of the amount of reduction needed by Folsom as outlined above in the 3 stages of reduction. 24 Accordingly, unless the City receives an equivalent amount of water for its foregone water assets to meet Lower American River flow objectives, it will not be required to forego the water. Thus, for planning purposes, the City has reliable supplies based upon its existing water assets in accordance with the replacement provisions in the WFA. In the event the City foregoes water supplies to other purveyors as part of an exchange opportunity, the City will retain both the ownership of the water asset as well as the unilateral authority as to where the water will be delivered. The City will not lose control of its water even if required to send water down the American River as part of the Water Forum Agreement. The City seeks to develop these arrangements with regional water purveyors as it fulfills its obligation to reduce diversions in certain year types under the Water Forum Agreement. All signatories to the Water Forum Agreement have, among other things, agreed to assist each other in meeting supply reliability objectives. 3.3 Groundwater City of Folsom Unimpaired Inflow Greater than 950,000 AF 950,000 to 871,000 AF 870,000 to 651,000 AF 650,000 to 400,000 AF City of Folsom Surface Water Diversion Probability of year type or above [1] 34,000 AF 82% 34,000 to 30,000 AF 90% 27,000 AF 95% 22,000 AF 97% <400,000 AF 20,000 to 18,000 AF 99% [1] DWR Bulletins (Bulletin through 120-4) and are the basis for determining the unimpaired inflow into Folsom Reservoir; Water Forum Proposal Final EIR, October 1999 at Appendix I. The City overlies portions of the Sacramento Valley Groundwater Basin. Specifically, the City overlies two smaller subbasins wholly contained in the Sacramento Valley 24 Water Forum Agreement at page 178. City of Folsom Urban Water Management Plan Final June 2016
41 Groundwater Basin: the Sacramento North Area Groundwater Subbasin ( North Basin ) and the Central American Groundwater Subbasin ( Central Basin ). These two subbasins are two of 18 subbasins that comprise the Sacramento Valley Groundwater Basin. These two subbasins are depicted in Figure North Basin The North Basin lies within portions of Sutter, Placer, and Sacramento Counties. The North Basin is delimited by the Bear River on the north, the Feather River and the Sacramento River on the west, the American River on the south, and the Sierra Nevada foothills on the east. The North Basin is identified by the California Department of Water Resources (DWR) in Bulletin as Basin No The approximate total storage of the North Basin is 4.9 million acre-feet of water, across a surface land area of approximately 351,000 acres. City of Folsom Urban Water Management Plan Final June 2016

42 Figure 3-1 Regional Sacramento County Groundwater Basins CSCGMP Figure ES-1. City of Folsom Urban Water Management Plan Final June 2016
43 3.3.2 Sacramento Groundwater Authority The Sacramento Groundwater Authority (SGA), formerly the Sacramento North Area Groundwater Management Authority, was formed as a joint powers authority and charged with the management of the North Basin. The SGA s formation in 1998 resulted from a coordinated effort by the Sacramento Metropolitan Water Authority and the Water Forum to establish an appropriate management entity for the basin. SGA draws its authority from a joint powers agreement signed by the cities of Citrus Heights, Folsom and Sacramento as well as the County of Sacramento to exercise their common police powers to manage the underlying groundwater basin. In turn, these agencies chose to manage the basin in a cooperative fashion by allowing representatives of the 14 local water purveyors and representatives from the agricultural and self-supplied pumper interests to serve as the Board of Directors of the SGA. SGA has developed a Groundwater Management Plan (GMP). The SGA GMP is a quasicontractual document that identifies basin management objectives and binds the members of SGA to follow certain agreed upon criteria to meet those objectives. The GMP outlines the volumes of water in the basin, the safe yield of the basin, and recharge expectations that water users rely on in planning and using their groundwater assets. In 2014, SGA updated its groundwater management plan to ensure that management objectives and responses remain responsive to developing needs. SGA may again refine its basin management objectives in the context of the Sustainable Groundwater Management Act (SGMA) enacted in The SGA GMP includes a discussion of the groundwater levels in the central portion of the North Basin the area within the North Basin which SGA claims jurisdiction. This subarea is bounded on the west by the Natomas Central Mutual Water Company and Rio Linda/Elverta Community Water District and on the east by San Juan Avenue. For about years up through the mid-1990s, groundwater production in the North Basin resulted in a general lowering of the groundwater levels near its center. 26 Even though the central portion of the North Basin has experienced a decline in groundwater elevations, DWR has not identified the Northern American Groundwater Subbasin as overdrafted, nor has it projected it would become overdrafted. 27 Since the mid-1990s, groundwater elevations have stabilized throughout the area overlying the regional cone of depression and, in some cases, groundwater elevations are continuing to rise. 28 Recent conjunctive use activities have resulted in providing new surface water supplies to water purveyors historically producing groundwater in the central portion of the 26 Id. at See California s Groundwater Bulletin 118, Sacramento Valley Groundwater Basin, North American Subbasin (DWR Subbasin ), January Id. at 53. City of Folsom Urban Water Management Plan Final June 2016
44 North Basin. 29 Although water purveyors in the region will rely more heavily on groundwater during dry periods, the net increase in available surface water will result in a maintained or improved amount of groundwater in storage in the basin over the long term. 30 The average sustainable yield of the groundwater basin is estimated by SGA to be 131,000 af/yr 31, and the groundwater elevations range from about 10 feet above mean sea level (msl) and 40 msl Central Basin The Central Basin is identified by DWR in Bulletin as Basin No The Central Basin is located in the Central Basin Area of the Sacramento County Groundwater Basin, as identified in the Central Sacramento County Groundwater Management Plan (CSCGMP). The aquifer system within the Central Basin consists of continental deposits of the late Tertiary to Quaternary age (DWR Bulletin 118). The Central Basin is depicted in Figure 3-1 above. The major fresh water bearing geologic units are the Laguna Formation and the Mehrten Formation. The Laguna Formation, which extends to a total depth of approximately 300 feet within the Central Basin, is used for private domestic wells and municipal water supply wells Central Basin Groundwater Management The Central Basin Groundwater Management Plan is the primary planning tool for the current Central Basin groundwater management. 32 The CSCGMP was formally adopted by the participating agencies in 2006 and identified the safe yield of the Central Basin as 273,000 acre-feet per year. The emerging rules associated with the Sustainable Groundwater Management Act, however, will likely change the plan. The SGMA requires formation of a Groundwater Sustainability Agency (GSA) and adoption of a Groundwater Sustainability Plan (GSP) may greatly impact the long-term management of the Central Basin. Central Sacramento County Groundwater Management Plan As described above, the City overlies the Central Basin but it does not extract groundwater from the Basin for use on overlying lands. Instead, it relies on Aerojet to extract and treat groundwater for use in the City s service area. The public water systems and water service providers that extract water from the Central Basin include: the California American Water 29 Id. 30 Id. 31 This value was estimated based on long-term average water use, supply conditions, and facilities in the basin at the time of the WFA. This value was not intended to be a fixed value that could not be modified as conditions and assumptions changed in the basin. 32 A copy of the Central Basin Groundwater Management Plan is available at City of Folsom Urban Water Management Plan Final June 2016
45 Company, Sacramento County Water Agency, the Golden State Water Company, Elk Grove Water District and numerous private landowners that possess overlying groundwater rights linked to their property ownership. The Central Basin is not adjudicated or considered to be in a state of overdraft. Due to the active planning by water agencies and conjunctive use efforts, the basin will remain stable in the future. The CSCGMP provides for the long- term protection of groundwater quantity and quality within the region, and contains policies directing the development of surface water supplies, conservation, and other measures to service urban development as it occurs, thereby protecting the sustainable annual groundwater yield threshold of 273,000 AF. Sustainable Groundwater Management Act The Sustainable Groundwater Management Act requires establishing a GSA and a GMP as noted above. Although the Central Basin has an existing Groundwater Management Plan, the CSCGMP may not be the controlling planning document in the future because of this new law. Moreover, the CSCGMP participating agencies have not yet been chosen to act as a GSA. Once a GSA is formed, the participating agencies will be required to develop a GMP that coordinates management with all Central Basin water users and stakeholders. This GMP may mimic the CSCGMP fundamental analyses but it is too early to tell if those analyses will meet the states more stringent GMP regulations City Groundwater Development and Use The City does not pump groundwater for use in the City s water service area but has a vested interest in the management of the Central Basin. The City will continue to work in the Central Basin in order to protect its short-term and long-term water management interests, including groundwater banking and conjunctive use options. In previous years, the City of Folsom relied on groundwater to serve the area south of U.S. Highway 50, including the areas within the Aerojet area (referred to as the Natomas Nimbus service subarea). During the late 1970 s to 1980 s, the City recognized the need to develop the conjunctive use of groundwater and surface water to meet future water demands. However, with the recognized contamination of groundwater within the City s water service area from the 1990 s to present, the City pursued surface water as the primary source of water supplies, and a reliance on other agencies outside of the Folsom water service area to meet any conjunctive use plans for dry-year water supplies. However, as technology has improved and uses for remediated water supplies have been identified, the City has embraced using groundwater derived from its service area for certain identified uses. These uses are described in Section below. City of Folsom Urban Water Management Plan Final June 2016
46 3.3.6 Groundwater Extraction and Treatment (GET) Water Pursuant to terms of the 2007 Aerojet Agreement between the City and Aerojet, the City acquired rights to treated groundwater produced by Aerojet s Groundwater Extraction and Treatment Facilities A and B (GET A and GET B). The GET A facility consists of extraction wells and a treatment facility. GET A s 17 wells will produce treated water of approximately 537 gallons per minute (GPM). The GET B Facility, also currently consisting of extraction wells and a treatment facility will be extracting approximately 2,077 GPM, of which approximately 1,477 GPM will be made available to the City. In total, these facilities will provide the City with an additional water supply of approximately 3,250 acre-feet per year. Water derived from the GET facilities will be used to meet industrial demands within the Aerojet Industrial Property (projected to average 2,731 acre-feet per year) as well as other potential non- potable demands throughout the City. Because the City has not yet developed additional non-potable uses for the GET water supply, the amount of GET water represented will show this supply as only that which is projected to be used by Aerojet industrial facilities. Any GET water remaining above and beyond the demonstrated use by Aerojet can be used by the City for other non-potable demands Other Groundwater within the City s Water Service Area Other groundwater use within the City s service area is limited to private use by the Empire Ranch Golf Course and as an emergency supply for Intel Corporation. The golf course uses groundwater in the spring and early summer months as a primary source of irrigation water. As the irrigation season progresses, groundwater levels typically decline and the golf course purchases supplemental potable surface supplies from the City. And Intel Corporation has established two emergency backup wells capable of delivering 100 GPM and 15 GPM, respectively. To better understand the groundwater conditions and supply potential that may underlie the golf course and other areas within the City limits, the City completed a Groundwater Resources Investigation through an AB 303 grant. Two test wells were installed for this study in localized areas of high electrical resistivity in ancestral paleochannels of the American River. These wells are considered to be of the South American Groundwater Sub-basin ( ) of the Sacramento Valley Basin. The two test wells yielded 200 to 400 GPM during short-term pumping tests, but additional aquifer testing would be required to confirm the sustainability of the yields. City of Folsom Urban Water Management Plan Final June 2016
47 3.4 Recycled Water The City of Folsom completed a Water Recycling Feasibility Study. This study evaluated the potential use of recycled water in Folsom s Service Area. The study identified two categories of potential recycled water use, landscape irrigation use and non-potable, nonirrigation uses. Based on the finding of the report, a future City of Folsom recycling program would likely be limited by the availability of supplies and seasonal storage. At this time, the City does not have a source of recycled water. 3.4 Desalinated Water Desalination of ocean water is not physically or financially viable for the City at this time and it has no future plans to develop water supplies derived from desalination activities. 3.5 Transfer and Exchange Opportunities The City has opportunities for water transfers and exchanges. The City is already engaged in one water transfer in transferring its GSWC leased water asset back to GSWC for compensation in order for GSWC to have a temporary supply to supplant groundwater contamination. Additional opportunities are available now. With some creative thinking and willing partnerships, the City could engage in numerous forms of water transfers that may have short-term benefit to the City as well as long-term regional benefit. Some examples of these are described below. Water Forum Transfers As an initial matter, in order for the City s obligations under the Water Forum Agreement to manifest, other regional water purveyors must provide the City with a replacement water supply. As such, the City may be amenable to receiving water through water transfer mechanisms derived from surface water assets and groundwater assets. But the WFA also provides the City with an opportunity to sell foregone water assets in below normal years. In these years, where Folsom releases its water assets into the Lower American River, it retains its rights to those assets through the confluence of the American and Sacramento Rivers. As such, the City could potentially sell those assets when they are available. Placer County Water Agency (PCWA) a fellow WFA signatory agency is selling its foregone water assets under the WFA each year. In Lieu Banking Arrangement with Groundwater Purveyor The City could engage a water purveyor with surface water assets connected to the Sacramento River watershed and deliver the City s surface water assets in lieu of the recipient using its groundwater assets. The foregone groundwater assets could be retained City of Folsom Urban Water Management Plan Final June 2016
48 as banked groundwater available when surface water is not available or simply left in the ground to recharge the groundwater basin. A potential partner in this sort of water transfer arrangement would be Sacramento County Water Agency with its diversion capabilities from the Sacramento River at Freeport. The benefit of this sort of transaction is that it would relieve pressure on the groundwater basin and preserve the groundwater supplies for dry periods when surface water assets are less available. A second form of the in lieu banking alternative might include assigning the rights to the banked groundwater to another agency. For instance, if Golden State Water Company could deliver some of its surface water assets directly to the City in normal and wet years, the City could assign a portion of its banked groundwater assets to Golden State Water Company for use in dry years. The in lieu banking and exchange agreement can work where an entity shares surface water and groundwater resources in all portions of the Sacramento Area Groundwater Basin (North, Central and South). Water Conservation Based Transfers The City is experiencing significant per capita water savings by instituting water conservation activities. Under Water Code Section 1011, all water conserved by the City remains the property of the City for its intended uses and disposition. Thus, where conservation efforts result in reduced consumptive uses, the City is able to transfer those water assets to willing buyers. These buyers may be local water purveyors or those in faraway places even south of the Delta. Accordingly, the City may develop conservation based water transfers and receive compensation. Water Reclamation Based Transfers As noted in Section above, the City has acquired and is using reclaimed water assets to meet specific demands in lieu of potable water deliveries. 33 Water Code Section 1010 protects the City s potable supplies for the City s uses. But in addition to that protection, Section 1010 indicates that the preserved water assets may be available for direct transfer because they are based on a reclaimed asset offset. This offset is similar to a conservation based transfer as water that is reclaimed from an unusable source is now made available for water usage. Groundwater Substitution Transfers The reclaimed water transfer described above may also be characterized as a groundwater substitution transfer. Under this characterization, the City is using water derived from 33 The water code considers use of water that is polluted by waste to a degree which unreasonably affects the water for other beneficial uses as protecting water assets otherwise available under Water Code Section City of Folsom Urban Water Management Plan Final June 2016
49 groundwater sources to offset surface water that is normally delivered to Aerojet. Thus, the utilization of groundwater in lieu of surface water is one of the primary mechanisms for short-term water transfers in dry years. The City is well-positioned to demonstrate this type of water transfer. Direct Water Transfer Last, but probably most important, is the City s ability to directly transfer its surface water assets to other users. This form of transfer essentially allows the City to continue its full water usage but transfer surplus water to other legal users in the system. The City can manifest this type of transfer through its pre-1914 appropriative water rights as well as its CVP contract entitlement. Under the City s pre-1914 appropriative water rights, the City has the ability to simply deliver the water to a new place of use without the approval of the SWRCB. In other words, the City can move this water asset without the express permission of a regulatory entity. The regulatory entity would need to challenge the delivery as causing injury. The City has engaged in this transfer by delivering its pre-1914 appropriative water rights water to GSWC in exchange for money. Although this did not expand the place of use of the pre right because of the co-tenancy agreement, it did set in motion the ability to deliver the asset to other legal users without express approval of other agencies. The City could also deliver its CVP Contract Entitlement to other legal users in the American River Watershed. Under the Central Valley Project Improvement Act (CVPIA), in watershed water users that share contract rights for water supplies are allowed to transfer the entirety of their contract entitlement to other CVP users. This paper water transfer was one of the important regional requests in developing and implementing this law. The American River contractors have never implemented this rule. However, neighboring agencies on the Sacramento River the City of West Sacramento has engaged in lucrative water transfers through this narrow CVPIA provision. 3.6 Supply Reliability The City s water supplies are stable and reliable. The City s surface water assets on the American River are well documented and well preserved. The City s groundwater assets manifesting from GET A and GET B are also well documented and protected for the City s uses. And the WFA curtailments are merely voluntarily implemented until the City has access to additional water resources provided by the other WFA participating water agencies. City of Folsom Urban Water Management Plan Final June 2016
50 3.6.1 Normal Year Water Supply Availability The City s total available water supply will not vary in a normal year from what was discussed in Section The City has 35,540 acre-feet of water to meets its service requirements in the City s Service Area. In addition, the City has nearly 3,250 acre-feet of GET A and B groundwater per year available. Although 2,731 acre-feet is used at Aerojet, the remaining 500 plus acre-feet could be used in other areas within the City Single Dry-Year Water Supply Availability The City s total available water supply will diminish only slightly in a dry year as described in Section The City has 33,790 acre-feet of water to meets its service requirements in the Folsom Area and Ashland Area. The baseline reduction is due to the CVP M&I Shortage Policy reducing the CVP Fazio supply by 25 percent from 7,000 acre-feet to 5,250 acre-feet. The City would continue to have nearly 3,250 acre-feet of GET A and B groundwater per year available Multiple Dry Year Water Supply Availability In the second year of a multi-year drought, the City has 33,250 acre-feet of water available. This reduction represents a proportional cutback in water supplies available under the San Juan Water District Water Supply Agreement. Although this reduction of approximately 33 percent of the available supply may be drastic, we are using this figure out of an abundance of caution pursuant to the SJWD water supply shortage plan. In the last year of a multi-year drought, the City has 32,000 acre-feet of water available. This number represents a 50 percent supply cutback in the City s Central Valley Project Fazio supply. Although the 2015 extreme drought cut this supply by 75 percent, this statewide situation was also accompanied with state-mandated end-user demand reductions. As such, in these extreme cases, the City is prepared to implement significant demand reductions in order to manage water supply. Otherwise the City s overall water supply portfolio remains the same. City of Folsom Urban Water Management Plan Final June 2016
51 CHAPTER 4. WATER DEMAND CONDITIONS Understanding water demand characteristics is essential to enable the City of Folsom to reliably and cost-effectively manage its water supplies to continue to meet customer needs. This section characterizes the City s retail customer demands current and forecast over the next few decades. Characteristics such as how demands vary among different land use classifications and under differing hydrologic conditions, all help with that understanding. This section is organized as follows: S Review and refinement of the 2020 Urban Water Use Target - This subsection presents the review and refinement of 2015 and 2020 water use targets as allowed under CWC (g). 34 S Compliance with Interim 2015 Urban Water Use Target This subsection documents the derivation of the 2015 GPCD value and comparison to the 2015 interim target. S Historic and Current Water Demands This subsection presents data reflecting the historic and current water demand conditions for residential and nonresidential customers in the City. S Future Water Demands This subsection presents the derivation of future demands for potable water within the City s service area, including land-use classifications, unit demand factors, and estimation of non-revenue water. S Summary of Water Demands This subsection presents a summary of the projected current and future water demands in five-year increments. 4.1 Review and Refinement of GPCD Targets As detailed in the City s 2010 UWMP, population, residential connections, and water production data were used to generate a gallon per capita day (GPCD) baseline. From this GPCD baseline, the City assessed and determined a 2020 Urban Water Use Target and an Interim 2015 Urban Water Use Target. These values were determined to be 343 and 386, respectively, as presented in the 2010 UWMP. 35 According to the DWR Guidebook, a retail water purveyor who did not use actual 2010 Census data must re-calculate its baseline using the available 2010 Census data. 36 For the (g): An urban retail water supplier may update its 2020 urban water use target in its 2015 urban water management plan required pursuant to Part 2.6 (commencing with Section 10610). 35 City of Folsom 2010 UWMP, p (available at: percent20city percent20of/city percent20of percent20folsom percent percent20uwmp percent20update percent20- percent20fin.pdf). 36 If an agency did not use 2010 U.S. Census data for its baseline population calculations in the 2010 UWMP (the full census data set was not available until 2012) the agency must re-calculate its baseline population for the 2015 UWMPs using 2000 and 2010 Census data. This may affect the baseline and target GPCD values calculated in the 2010 UWMP, which must be modified accordingly in the City of Folsom Urban Water Management Plan Final June 2016
52 City s 2010 UWMP, the 2010 Census data was not fully available, causing the City to use other methods to estimate 2010 population. 37 Thus, the City must recalculate its baseline GPCD and re-establish its target and interim-target values with the available 2010 Census data. 38 The City cannot use the revised DOF tables for calculation of the 2015 UWMP population because three separate Water Service Boundaries make up the City Administrative Boundary. To recalculate the annual GPCD values using the 2010 Census data, the City utilized the available population tool from DWR. Use of this tool requires uploading of specific files that define the City s service areas for 1990, 2000, and 2010 as each of those periods potentially have varied service area boundaries. The result of the boundary analysis provided a new population value for the 2000 and 2010 census years and, based upon the prior connection data, new population estimates for the entire baseline period. New population values divided into the previously determined gross water values (as documented in the 2010 UWMP) provided revised GPCD values for this period. Table 4-1 provides a comparison of the yearly population and GPCD estimates from the 2010 UMWP and as revised using 2010 Census data and the DWR population tool. Using the revised annual GPCDs, new values were calculated for four of the six 10-year time periods ending no earlier than December 31, 2004 and no later than December 31, 2009 where quality data was available. The comparative results are shown in Table 4-2. As expected, the use of 2010 Census data and the new DWR population tool did result in changes to the estimated baseline values, and the resulting 2015 Interim GPCD Target and 2020 GPCD Target UWMP. (2015 Urban Water Management Plans: Guidebook for Urban Suppliers, DWR, January 2016, p. 5-8). 37 The City did both a block level analysis for the 2000 census and DOF tables. For the 2010 UWMP the City used DOF population numbers subtracting the section of the City which is not served or billed by the City water system. 38 According to CWC Section (g), the District may also re-assess the methodology chosen to determine its 2015 and 2020 GPCD targets and update these targets, even if the 2010 population data was appropriate. City of Folsom Urban Water Management Plan Final June 2016
53 Table 4-1 Revised Annual GPCD using 2010 Census Data From 2010 UWMP For 2015 UWMP Year Gross Water Use Service Area Population GPCD Revised Gross Water Use* Revised Population Revised GPCD ,761 31, ,761 31, ,603 33, ,603 32, ,376 35, ,376 34, ,196 40, ,196 37, ,278 45, ,278 41, ,354 47, ,354 47, ,414 50, ,415 49, ,913 52, ,913 52, ,547 54, ,547 54, ,974 55, ,974 56, ,519 56, ,519 57, ,304 58, ,304 58, ,644 59, ,644 60, * Values Include Aerojet Raw Pursuant to CWC (g) the City may choose to select a different method for calculating its 2020 GPCD target. Upon review of the analysis in the 2010 UMWP that resulted in the choice of Method 1, the City finds no reason to vary from the prior method choice. Thus, the City is officially using Method 1 to establish its 2020 GPCD target. However, to accurately reflect the use of the 2010 Census data and the DWR population tool, the City will modify its 2020 GPCD Target to be 352 gallons per capita per day (see Table 4-2). Table 4-2 Comparison of baseline and target values Baseline Baseline Values 2015 Target 2020 Target Period* Original Revised Original Revised Original Revised *Values Include Aerojet Raw 4.2 Compliance with 2015 Interim Target Pursuant to CWC Section , the City is to report to DWR on its progress in meeting its urban water use targets as part of its 2015 UWMP. As part of the progress reports, the City should include its compliance daily per capita water use (Compliance Value), which is the gross water use during the final year of the reporting period, reported in gallons per capita per day. 39 Documentation of the Compliance Value must include the basis for determining the estimates, including references to supporting data. 39 CWC (e). City of Folsom Urban Water Management Plan Final June 2016
54 Furthermore, pursuant to CWC Section (a), the City must demonstrate that it has met its 2015 Interim GPCD Target as of December 31, 2015 through its calculation of its 2015 Compliance Value. Extending the population analysis that was revised during the reassessment of the baseline GPCD, the City is able to calculate its 2015 Compliance Value. Table 4-3 presents the extended population calculation for 2011 through 2015, the associated gross water use in each year, and the resulting annual GPCD. As demonstrated, the City s 2015 Compliance Value is 239 gallons per capita per day, which is significantly below the 2015 Interim GPCD value of 396. Though the 2015 Compliance Value seems impressive, the City does not believe it represents the actual progress toward its 2020 GPCD Target conditions due to two factors: (1) weather conditions in 2015, and (2) mandatory conservation requirements imposed by the State Water Resources Control Board. While normalizing for weather is recognized and suggested in statute, with a tool available from DWR to perform the calculation, the State mandated conservation likely had a greater downward affect on the 2015 Compliance Value. 40 Table 4-3 Annual GPCD for 2011 through 2015 Gross Water Use Year Population GPCD (af/yr) ,187 22, ,351 23, ,600 22, ,145 22, ,756 19, ,536 15, * Includes Aerojet Raw Although adjustments for weather are allowed, they are not required. 41 Because the City s 2015 Compliance Value demonstrates that the City is in compliance with the statutes, it has elected to not adjust the 2015 Compliance Value for weather. However, it has chosen to adjust the value to understand what 2015 GPCD conditions may have been absent the State conservation mandate so that it can appropriately assess progress toward its 2020 Target GPCD. One option for the City to understand its progress toward the 2020 Target GPCD is to look at the most recent average year, which would be In 2013, there were no mandatory conservation measures, weather was not significantly different than average 40 CWC Section (d)(1)(A) 41 CWC Section (d)(2) City of Folsom Urban Water Management Plan Final June 2016
55 conditions (though it was the beginning of the current drought cycle), and the City had yet to complete its customer meter installation. Even without these factors the GPCD in 2013 was 390 gpcd, just below the revised 2015 Target GPCD value of 396 (see Table 4-2). From this information, the City concludes that it is on track to achieve its 2020 GPCD Target when it reports the 2020 Compliance Value in its next UWMP update. The City recognizes that a primary factor in this early success was the growth in modern housing numbers in the 2000s and an extensive water loss program which, respectively, brought the average household water use down and brought City water loss inline with industry standards. 4.3 Current and Forecast Water Demands Based on available records for water production, water sales and deliveries, the City s water demands for the past five years were previously presented in Table 4-3. As demonstrated by the presented gross water use values, the City has not experienced much growth since the 2010 UWMP. And, as described in Chapter 2, the City only anticipates limited growth in the existing service areas, but does anticipate significant short-term growth in the planned communities south of Highway 50. These two categories of growth are detailed in the next section. Water demands for uses within the City that are met by other sources, such as private well use at Intel and Empire Golf Course, are not included in this analysis. Forecasting future demand requires several considerations: assessing the future water use habits of existing customers that will lower per capita water use, analyzing the land use plans that indicate locations and types of anticipated growth, and examining the various laws and regulations that determine future water demand factors Existing Customers As described in Chapter 2, the City currently serves a mostly built-out area of Sacramento County with a variety of residential and non-residential customers with varying uses. With recent completion of the meter program, the City is able to begin better understanding the characteristics of its customers use. To assist with this understanding, the City maintains a database of meter use information, categorized by land-use classification. Exiting customers are categorized into a number of land-use classifications in the meter database including but not limited to: single family residential, multi-family residential, commercial, industrial, schools, parks, and municipal. With account numbers and meter data, the existing unit demand factors for each can be determined. This information provides a baseline for estimating the future demands of existing customers. Table 4-4 provides the baseline demand factors for each land use City of Folsom Urban Water Management Plan Final June 2016
56 category using 2013 account and meter data. The City believes 2013 is the best available data to represent average conditions at this time. Using data from the drought years of 2014 and 2015 are less likely to represent average use conditions because of statemandated use reductions. Using these years would likely skew baseline conditions. 42 This approach is congruent with the GPCD values depicted in Table 4-3. As discussed in Chapter 2, the City of Folsom is split into a number of sub-areas. The American River Canyon area is not served by the City and is not included in the demand forecasts for this 2015 UWMP. The Ashland Service Area, located north of the American River, was near build-out before the beginning of the GPCD baseline period. The City s West Service Area and the East Service Area saw significant growth in the 1990 s through 2000 s and are also nearly built-out. As a result, these areas predominantly see future demand forecasts resulting from changes to existing customers. Existing customers future unit demand factors are assumed to change mostly from drivers such as general homeowner fixture replacements and upgrades, the City s conservation awareness and incentive programs, and other factors affecting a general increased awareness of water conservation. The future unit demand factors reflect a reduction from the current value in all categories resulting from conservation rates indicated in the far right column of the table. This reduction is reasonable as it reflects expected benefits of on-going City and customer conservation efforts, coupled with the use of 2013 for baseline conditions. A reflection of the impact of these drivers is presented as the unit demand factors for existing customers as demonstrated in Table 4-4. The future demand factors for existing residential customers reflect a 5 to 10 percent reduction from the current value to conservatively reflect anticipated conservation efforts. This reduction is reasonable as it reflects expected benefits of on-going customer conservation efforts, coupled with the use of 2013 for baseline conditions was the first year that the City was fully metered and billing on volumetric use. Accordingly, this data is the best available to assess average demand conditions at the writing of this UWMP. City of Folsom Urban Water Management Plan Final June 2016
57 Land-class Future Customers Table 4-4 Existing Customer Characteristics Current DUs/ACs As discussed in Section 2.1.2, City of Folsom service area is substantially built out in the Current Water Service Areas, having little remaining undeveloped land, so limited growth is expected. The expected growth will occur as a result of isolated infill, lot split development projects, and the significant planned communities located south of highway 50. Based on the WSA information available and revised Specific Plans, this growth will amount to around 16,000 new dwelling units or increasing the current City size by over 70 percent. 43 There are several factors that affect the development of future unit water demand, which in turn affect the forecasted water demand for future customers. These range from state mandates to changes in the types of housing products being offered. These are incorporated into the determination of future unit water demand factors, discussed later in this chapter. Characteristics of the most important factors are described below Factors Affecting Future Water Demands These following factors are generally recognized to result in lower per unit demand factors for future residential and non-residential customers. A brief discussion of each item is described in the sections below. Water Conservation Objectives: Current Demand Factors (af/account) Existing Customers Future Demand Factors (af/account) Multi-Family 5, Single Family 17, Commercial/Industrial 2, Schools Parks Municipal Notes Demand factors represent DUs, which may have many units per account Calculated from current GIS acreage and metered demands Derived from regional meter study results Calculated from current GIS acreage and metered demands On November 10, 2009, Governor Arnold Schwarzenegger signed SBX7 7, which required each urban water supplier to reduce their per-capita water use by 2020, with a 43 Approximately 11,000 new DU as part of the SPA projects and a further 5,000 new DU as part of the Glenborough Easton projects. City of Folsom Urban Water Management Plan Final June 2016
58 statewide goal of achieving a 20-percent reduction by As discussed previously, the City has established a 2020 Target GPCD in response to this requirement. Achieving the City s 2020 conservation target will require the City to continue its ongoing conservation efforts. As illustrated by the compliance analysis previously discussed, the City has already achieved its 2015 goal and is on track to achieve it s 2020 goal. New customers will likely further reduce the City s annual GPCD since the factors below were designed to lower use. Indoor Infrastructure Requirements In January 2010, the California Building Standards Commission adopted the statewide mandatory Green Building Standards Code (hereafter the CAL Green Code ) that requires the installation of water-efficient indoor infrastructure for all new projects beginning after January 1, The Cal Green Code was revised in 2013 with the revisions taking effect on January 1, 2014; however these revisions do not have substantial implications to the water use already contemplated by the 2010 Cal Green Code. 45 The CAL Green Code applies to the planning, design, operation, construction, use and occupancy of every newly constructed building or structure. All new developments must satisfy the indoor water use standards directed by the CAL Green Code, which essentially require new buildings and structures reduce overall potable water use by 20 percent. Expected future customers will satisfy the standards through the use of appliances and fixtures such as high-efficiency toilets, faucet aerators, on-demand water heaters, or other fixtures as well as Energy Star and California Energy Commission-approved appliances. California Model Water Efficient Landscape Ordinance The Water Conservation in Landscaping Act was enacted in 2006, requiring the Department of Water Resources to update the Model Water Efficient Landscape Ordinance (MWELO). 46 In 2009, the Office of Administrative Law (OAL) approved the updated MWELO, which required a retail water supplier or a county to adopt the 44 California Water Code The 2010 CAL Green Code was evaluated for updates during the 2012 Triennial Code Adoption Cycle. HCD evaluated stakeholder input, changes in technology, implementation of sustainable building goals in California, and changes in statutory requirements. As such, the scope of the CAL Green Code was increased to include both low-rise and high-residential structures, additions and alterations. Guide to the 2013 California Green Building Standards Code (Residential), California Department of Housing and Community Development, Gov. Code City of Folsom Urban Water Management Plan Final June 2016
59 provisions of the MWELO by January 1, 2010, or enact its own provisions equal to or more restrictive than the MWELO provisions. 47 In response to the Governor s executive order dated April 1, 2015, (EO B-29-15), DWR updated the MWELO and the California Water Commission approved the revised MWELO on July 15, The changes include a reduction to 55 percent for the maximum amount of water that may be applied to a landscape for residential projects, which reduces the landscape area that can be planted with high water use plants, such a turf. The MWELO applies to new construction with a landscape area greater than 500 square feet (the prior MWELO applied to landscapes greater than 2,500 sf). 48 For residential projects, the coverage of high water use plants is reduced to 25 percent of the landscaped area (down from 33 percent). It is difficult to predict the ultimate impact of the MWELO requirements on future water demand. While the requirement is for development of a landscape design plan that uses plants and features that are estimated to use no more than 55 percent of ETo, some provision must be made for the inherent tendency to overwater even with irrigation controllers installed, piecemeal changes in landscape design, reductions in irrigation efficiency through product use, and limited resources for enforcement in the absence of dedicated irrigation meters. California Urban Water Conservation Council BMPs The City is a signatory to the California Urban Water Conservation Council (CUWCC) Best Management Practices (BMP) Memorandum of Understanding (MOU). Due to this affiliation, the City has implemented the CUWCC BMPs. These practices further reduce the City s demands. Further details on the City s conservation efforts can be found in Chapter Future Unit Demand Factors When considering the various factors discussed above, coupled with a review of current customer use characteristics, the City has established the demand factors presented in Table 4-5 for estimating future customer demand. Table 4-5 also presents the anticipated growth rate for new dwelling units or non-residential acreage over the 2015 UMWP planning horizon. 47 California Code of Regulations (CCR), Tit. 23, Div. 2, Ch. 27, Sec The MWELO provides the local agency discretion to calculate the landscape water budget assuming a portion of landscape demand is met by precipitation, which would further reduce the outdoor water budget. 48 CCR Tit. 23, Div. 2, Ch. 27, Sec City of Folsom Urban Water Management Plan Final June 2016
60 Table 4-5 Future Customer Accounts and Demand Factors Land-class New DUs/ACs (cumulative) Future Demand Factors Multi-Family 500 1,000 1,750 2,750 4, Single Family 1,500 3,000 4,500 6,000 7, Commercial/Industrial Schools Parks Municipal Large Industrial Demands Large Industrial Users represent a unique demand on the City. Subject to economic conditions, state and federal regulations, and leadership located outside of the City, projected use cannot be analyzed in a meaningful way using industry standard assumptions. Table 4-6 provides the projections in demands for each 5-year planning horizon as used in the 2015 UWMP. 49 Table 4-6 Large Industrial Demands Land-class Treated Industrial Users* Current Intel Aerojet Kikkoman Gekkeikan Subtotal 1,221 1,059 1,059 1,059 1,059 1,059 *Intel is technically commercial but due to it's size uses water on an industrial scale Raw Industrial Users Land-class Current Aerojet 2,278 2,731 2,731 2,731 2,731 2, Demand Forecast Summary Water demand projections within the City s service area reflect the combination of continued conservation by existing customers and the addition of new customers over the 2015 UWMP planning horizon. For purposes of this 2015 UWMP, Table 4-7 provides the summation of this analysis and the resulting expected demands for each 5-year planning horizon to The City s build-out demand is expected to be approximately 32,000 acre-feet per year. 49 The projected demands for these high water using customers is kept consistent with estimates from the 2010 UWMP. The actual demands have varied as represented by the current (2013) reported values. City of Folsom Urban Water Management Plan Final June 2016
61 Table 4-7 Projected Water Demands Land-class Forecast Demand (af/yr) Existing 1,707 1,691 1,675 1,660 1,645 Multi-Family Future Subtotal 1,822 1,921 2,078 2,292 2,623 Existing 10,113 9,985 9,863 9,742 9,626 Single Family Future 630 1,260 1,890 2,520 3,150 Subtotal 10,743 11,245 11,753 12,262 12,776 Existing 5,128 5,128 5,128 5,128 5,128 Commercial/ Future 677 1,412 1,512 1,611 1,611 Industrial Subtotal 5,805 6,540 6,639 6,739 6,739 Existing Schools Future Subtotal ,004 1,004 1,004 Existing Parks Future ,043 1,160 1,160 Subtotal 1,158 1,621 1,738 1,856 1,856 Existing Municipal Future Subtotal Subtotal 20,832 22,979 23,981 24,921 25,766 Unaccounted water 1,875 1,838 1,679 1,495 1,288 Aerojet Raw 2,731 2,731 2,731 2,731 2,731 Unaccounted raw water (at 5%) Total 25,575 27,685 28,527 29,283 29, Distribution System Water Losses The demand factors presented earlier in this chapter represent the demand for water at each customer location. To fully represent the demand, distribution system losses must also be included. Often, these losses represent water that is lost due to system leaks, fire protection, construction water, unauthorized connections and inaccurate meters. Essentially, this is the water that is produced at the City s treatment plant or diverted into delivery pipes that does not make it to the customer either as a real loss or an apparent loss (e.g. such as may result when a customer meter under reports actual use). In most instances, the predominant source of distribution system losses is from leaks that inevitably exist throughout the many miles of pipes and fitting that bring water to the City s customers. For the City of Folsom, an extensive 2-year leak detection and recovery project was completed since adoption of the 2010 UWMP. As a result, the measured losses on the potable system have been significantly reduced. For purposes of forecasting future demands, the system loss is established on a declining loss factor from 9 percent to 5 percent of the treatment plant production through The raw water delivery pipeline which feeds the Aerojet Industrial demands historically lost approximately 35 percent but is currently being replaced. Future raw water losses are assumed to be 5 percent starting in City of Folsom Urban Water Management Plan Final June 2016
62 Pursuant to CWC 10631(e)(3)(B), the City must quantify and report the distribution system loss for 2015 using methodology developed by the American Water Works Association (AWWA) and provided as a worksheet through DWR. Using the available worksheet, the City calculated a loss equal to 18 percent of the water supplied into the distribution system. Specifically, the non-revenue water or the water losses plus the unbilled usages amount to 21.2 percent. The total losses amounted to 3,403 acre-feet and the real losses, after accounting for meter inaccuracies and data issues, was closer to 3,616 acre-feet per the AWWA spreadsheets. The AWWA spreadsheets are included as Appendix A-4. For purposes of estimating future demand from new connections, the distribution system loss is assumed to be 9 percent by 2020 to reflect on-going City programs to address meter inaccuracies, and find and fix identified system leaks. This 9 percent will then ramp down to 5 percent by 2040 through ongoing management programs Low Income Water Demands CWC Section requires water suppliers to include a projection of water use by lower income households as defined by Health and Safety Code Section The housing element of the City of Folsom General Plan provides the income distribution used for this analysis. 50 This housing element, adopted in October 2013, uses data from the 2010 U.S. Census and provides household income groups. The income limits for lower income come from U.S. Department of Housing and Urban Development s 2009 income guidelines. 51 The percentage of low income was derived from the same housing element table showing income groups. The housing element indicated 8,836 of the 22,659 households were below about 80 percent of median income level, which approximates to 39 percent of all households. For lack of more detailed income distributions, this 39 percent is assumed to remain constant into the future. Using 39 percent of the projected population, a demand factor from the multi-family housing units of approximately 0.3 acre-foot per year, and 2.61 people per housing unit, the current and future demand from lower income customers is estimated (see Table 4-8). The City of Folsom does track low income units that are built and they are designated a different billing rate in the water meter system. In 2013 the City served 482 acre-feet to low income households as labeled in the meter billing system. This is well below the near 2,800 acre-feet necessary to serve the projected 39 percent of low income residents but nearly 150 acre-feet more than was projected for 2015 in the 2010 UWMP. 50 City of Folsom General Plan Housing Element, pg 3-15, Table The income guidelines place households who make less than 80 percent of the median family income for an area as low income. This is in line with the CWC income threshold. City of Folsom Urban Water Management Plan Final June 2016
63 Further, the median income for Folsom is $94,462, with a low income qualifying as a family of four making $60,900, which is more than $4,000 than the median income household in Sacramento County as a whole. 52 AFY Table 4-8 Lower Income Demands Current Projected* Current Actual* Total Retail Treated Before Loss 19,420 19,420 20,832 22,979 23,981 24,921 25,766 Projected Lower Income Housing Demands 2, ,082 3,316 3,579 3,872 4,223 Percent of Treated Retail 15% 2% 15% 14% 15% 16% 16% *Current retail treated deliveries uses 2013 data to better represent a normal year 52 City of Folsom General Plan Housing Element, pg 3-35, Table and Sacramento County General Plan Housing Element, pg 5-8, Table 5-9. City of Folsom Urban Water Management Plan Final June 2016
64 CHAPTER 5. WATER DEMAND MANAGEMENT MEASURES 5.1 City Participation CWC requires that an UWMP include a description of the urban water supplier s water demand management measures. CWC also provides that members of the California Urban Water Conservation Council (CUWCC) shall be deemed in compliance with the UWMPA demand management measure requirements by complying with all the provisions of the CUWCC MOU and by submitting the annual reports. 53 The CUWCC MOU for Best Management Practices (BMP) is organized into five categories. Two categories, utility operations and education, are Foundational BMPs because they are considered to be essential water conservation activities by any utility and are adopted for implementation by all signatories to the MOU as ongoing practices with no time limits. The remaining BMPs are Programmatic BMPs and are organized into residential indoor and landscape, commercial/industrial/institutional (CII) indoor and landscape, and CII dedicated large landscape categories. 54 All the categories are outlined in Table 5-1. The City is a current member of CUWCC and has submitted annual reports to the Council, complying with CWC A copy of the most recent report from is available in Appendix C-1. As a signatory to the CUWCC MOU, the City is committed to implementing best management practices (BMP) designed to achieve water conservation across existing and future demand sectors. The CUWCC MOU requires that a water utility implement only the BMPs that are economically feasible. The City s continued implementation of the CUWCC BMPs should reduce some of the unit demand factors for its existing connections and help maintain the unit demand factors for future connections. 53 CWC 10631(j) City of Folsom 2015 Urban Water Management Plan Final June
65 Table 5-2 Table CUWCC 5-1 CUWCC BMPs and BPM Associated Requirements Standards 55 FOUNDATIONAL BMPS 1. Utility Operations Programs 1.1 Operations Practices Staff and maintain the position of a trained conservation coordinator Enact and enforce an ordinance designed to prevent water waste Enact and enforce an ordinance designed to promote water efficient design in new development Enact and enforce an ordinance designed to facilitate water shortage response measures 1.2 Water Loss Control Compile a standard water audit and balance annually Improve data accuracy and completeness of water audit during first four years During 5th through 10th year, demonstrate progress in water loss control 1.3 Metering with Commodity Rates for All New Connections and Retrofit of Existing Connections Initiate volumetric billing for all metered customers within one year after signing MOU Complete meter installations for all connections no later than July 1, 2012 Assess feasibility of moving mixed-use metered landscape uses to dedicated landscape meters Develop a written plan, policy or program to test, repair or replace meters 1.4 Retail Conservation Pricing Develop water rates such that 70% of revenue is generated from volumetric billing Develop conservation pricing for retail sewer service 2. Education Programs 2.1 Public Information Programs Implement public information programs to promote water conservation and water-conservation benefits 2.2 School Education Programs Educate students about water conservation and efficient water use PROGRAMMATIC BMPS 3. Residential Develop a Residential Assistance Program - including leak detection assistance, conservation surveys, and efficiency suggestions, as well as provision of high-efficiency appliances Perform site-specific landscape water surveys Provide financial incentives for, or institute ordinances requiring, purchase of efficient clothes washers Provide incentives or ordinances for replacement of toilets using 3.5 or more gallons per flush 4. Commercial, Industrial and Institutional Implement measures to achieve water savings for Commercial, Industrial and Institutional (CII) accounts of 10% compared to baseline water use (i.e., 2008 water use by CII accounts) 5. Landscape Identify accounts with at least one dedicated irrigation meter and assign an ETo based budget of no more than an average of 70% of ETo for metered irrigation uses; "Recreational" areas may be so designated and may use up to 100% of ETo Provide notices to irrigation meter customers comparing actual use to the water budget Offer site-specific technical assistance to those accounts at least 20% over budget Target and market landscape surveys to CII accounts with mixed-use meters, and those CII accounts with large landscapes and offer financial incentives to both 55 City of Folsom 2015 Urban Water Management Plan Final June
66 CHAPTER 6. WATER SHORTAGE CONTINGENCY PLAN As an urban water purveyor, the City of Folsom must meet the minimum health and safety requirements of a drinking water purveyor at all times. The City has created a water shortage contingency plan to help meet this goal during water shortages. The full version of this plan can be found in Appendix C-2. The strategy for allocating water during shortages for the City is complex. Detailed discussion of water supply, water shortage actions, catastrophic failure, financial impacts, and prohibitions during shortages is also provided in the City s Water Shortage Contingency Plan (WSCP) (included in Appendix C-2). The ordinance provides for emergency water supply management related to general supply shortages due to severe droughts, infrastructure failure, or any other cause. 6.1 Water Shortage Contingency Resolution The City s current ordinance allows for declaration of water shortages by the City Manager when deemed appropriate after considering factors such as availability of nonpotable water, agreements for deliveries or additional water supply and any variations in the reliability of the water supplies available to the City. When a shortage occurs, the City Manager assesses which of the stages of action discussed in Section 6.2 should be implemented. 6.2 Stages of Action and Reduction Goals The City has developed a five-stage shortage contingency plan as shown in Table 6-1. Each stage corresponds to an increased demand reduction target to align with anticipated supply availability. The shortage contingency plan includes voluntary and mandatory actions that expand under each stage, depending on the cause, severity, and anticipated duration of the water supply shortage. The Plan also prioritizes essential health and safety water uses over economic and discretionary uses. The details of these stages are provided in the Plan in the City of Folsom Municipal Code. City of Folsom Urban Water Management Plan Final June 2016
67 Table 6-1 Drought Stages Contingency Plan Stage Water Supply Conditions Response Actions 1 Voluntary Normal Supply Conditions Voluntary Conservation 2 Water Alert Slightly restricted water supplies Voluntary conservation and up to a 12% water use reduction 3 Water Warning Moderately Restricted Water Supplies Moderate conservation with some mandatory conservation for up to 20% water use reduction 4 Water Crisis Severely Restricted Water Supplies Mandatory water conservation and some use prohibition with up to 35% water use reduction 5 Water Emergency Extremely restricted water supplies Mandatory prohibitions and conservation for up to 50% water use reduction 6.3 Mandatory Prohibitions on Water Waste The City instituted a water shortage contingency plan under the Folsom Municipal Code The code prohibits intentional or unintentional water waste and encourages beneficial water use. 56 Allowing cooling fixtures to leak, maintaining waterways without recirculation devices and irrigation of landscaping during rainfall are a few examples of actions that would qualify as water waste under the regulation. Details on the prohibited types of water use for each stage of action are also outlined below in Section Penalties The City of Folsom Municipal Code section provides the stages of penalties for violators of the water waste regulation as seen in Table 6-2. For the first violation, the City shall issue a personal or written notice of the violation. For a subsequent violation within the 3 months of the first violation, the City shall issue a notice of intent to correct. If a third violation occurs within six months of the first violation an administrative penalty, mandatory water meter or discontinuation of service may occur. For every violation up to a $100 fee may be imposed. Additionally, any violations that occur during Stages 2, 3, 4 or 5 and are not corrected within 5 days can have further penalties imposed. These include applying established meter rates to any flat rate service or billing a customer who is already metered at twice the established rate while the violation continues. 56 City of Folsom, Municipal Code City of Folsom Urban Water Management Plan Final June 2016
68 First 6.5 Consumption Reduction Methods CWC (a)(1) requires that all water purveyors establish stages of action to be undertaken in the event of a water shortage. The Water Code section also specifies that a 50 percent reduction in supply must be considered and addressed. This specific supply reduction is addressed at Stage Five in Section It should be noted that the following sections on each stage of action are a summary of the key points established by the City in its WSCP. The City provides water users notice about water restrictions through direct mail, newspaper advertising and information posted on their website. For the full body of text and all the details of each stage please refer to these documents in Appendix C Stage One Voluntary Conservation Stage One involves the City s request that customers voluntarily limit their water use and attempt to conserve water. It also outlines that the general waste of water is prohibited and all water should be for beneficial use. The words general waste include allowing water to run off into an unused ditch, failing to repair a leak, irrigating during rain events, and other negligent uses of water under certain conditions Stage Two Water Alert Table 6-2 Stages of Penalties Violation Penalty Second (within three months of the first violation) Third (Within six months of the first violation) Personal or written notification of the violation Written notification and issuance of a notice to correct Issuance of an administrative penalty, mandatory installation of a water meter, discontinued water service and/or other penalties as provided in the notice of violation and as determined by the utilities director If water supplies become slightly restricted, the Plan calls for Stage 2 drought response, during which customers are informed of possible shortages and asked to voluntarily conserve 12 percent. Additionally some mandatory restrictions including limiting landscape and pasture irrigation to three days a week, the service of water at restaurant only upon request and no washing of hardscapes except as required for health and safety. City of Folsom Urban Water Management Plan Final June 2016
69 6.5.3 Stage Three Water Warning In the event Stage Three is implemented, the City will continue to encourage communityoriented voluntary conservation measures, enforce some conservation measures and implement mandatory water use reduction measures to decrease normal demand by up to 20 percent. Stage Three activities include a continuation of activities described under Stage 1 and 2, as well as greater conservation and water use restrictions. Stage 3 also restricts landscape watering to two days a week with no irrigation permitted on Mondays, Thursdays and Fridays Stage Four Water Crisis Stage Four s primary purpose is to reduce water use by 35 percent. In addition to all the voluntary and mandatory restrictions previously implemented under the earlier stages, landscape and pasture irrigation is further restricted to only one day a week. No water features, including swimming pools, can be refilled with City water and no new permits for pools will be permitted Stage Five Water Emergency Stage Five s purpose is to ensure the protection of the water supply for all public health and safety purposes. This Stage will require reductions in water demand by up to 50 percent. At this stage, all previous conservation restriction will apply and all ornamental ponds and fountains are prohibited, no new lawn or landscaping can be installed, and the flushing of sewer of fire protection systems is prohibited, except as required for essential maintenance. 6.6 Revenue and Expenditure Impacts When a drought or water shortage occurs, the City s costs will increase due to the additional activities and duties of instituting a stage of action. Not only will there be costs for materials, and time from permanent staff, but additional staff may need to be hired to assist in implementing the WSCP. As conservation measures and requirements increase and the water supply decreases, the City will likely realize a decrease in revenue. To combat this and help pay for the expenses discussed above, revenue will be provided by the penalties incurred by excessive water users as discussed in Section Reduction Measuring Mechanism In order to determine the City s success in achieving its conservation goals, the actual water savings will be determined by comparing the water used in the current year to the water used in the same month of the previous year. 57 It is important to note that the fines in no way offset reduced revenue expenses. City of Folsom Urban Water Management Plan Final June 2016
70 6.8 Catastrophic Supply Interruption In addition to climate, other factors that can cause water supply shortages are earthquakes, chemical spills, dam failures, canal breaks, waterline ruptures, and energy outages at treatment and pumping facilities. The City has an emergency operation plan that provides procedures and guidance to the City personnel in responding to emergency situations including catastrophic events, both natural and manmade. The plan provides procedures for preparing, mobilizing and employing city resources and coordinating outside resources during an emergency. 6.9 Minimum Supply Next Three Years Pursuant to CWC Section 10632(a)(2), the City is required to estimate the water supplies available for the next three years, specifically 2016, 2017 and Because of diligent planning efforts, the City believes it has ample water supplies available to meet its demand during this time frame as detailed in Chapter 3. Any potential shortfall in supply that may occur will be addressed through combinations of demand reductions as detailed in the WSCP and the use of interties with neighboring purveyors (once constructed), and supplemental sources (including the potential for spot market water transfers). However, to specifically address the statutory language, which requires water purveyors to assume a period of three dry years, the City has prepared Table 6-3. The values in this table represent the supply reliability for multiple dry years as detailed in Table 3-4, with the exception of remediated water. The City anticipates remediated water supplies available by 2020, but not in the next three years Current Drought Table 6-3 Minimum Water Supply Available Year AFY , , ,500 The current drought has impacted the City s drought and water shortage plans through Executive Orders and new statewide conservation goals. Executive Order B required the City to achieve 25 percent water use reduction by June The SWRCB subsequently increased the required water use reduction for the City of Folsom to 32 percent. In light of this 32 percent reduction goal, the City has sent out flyers, issued press releases and direct mailers to inform the public of this conservation goal and that the City is currently in Stage 3 of the WSCP. The City plans to continue promoting water City of Folsom Urban Water Management Plan Final June 2016
71 conservation and water use efficiency among its customers to ensure water use reductions continue. City of Folsom Urban Water Management Plan Final June 2016
72 CHAPTER 7. SUPPLY & DEMAND INTEGRATION The purpose of this chapter is to compare the total water supply sources available to the City with the total projected water use over the next 25 years, in five-year increments, for a normal water year, a single-dry water year, and multiple dry water years. 58 Water supply and demand data presented in this section is presented in prior sections of this UWMP. 7.1 Normal Water Year Conditions Under this water supply scenario, the City would anticipate full availability of its surface supplies as well as raw water and non-potable water as available. The City s pre-1914 appropriative water rights as well as its CVP contract rights are not subject to any curtailment in normal years. Therefore, in assessing long-term supply reliability in normal years over the 25 year planning horizon, the City s total supplies exceed its total demands. The resulting total supplies from Chapter 3 and the forecasted demands from Chapter 4 are shown in Table 7-1. As demonstrated, the City projects adequate water supplies through Table 7-1 Supply and Demand Comparison (Normal Year) (acre-feet/yr) Current Supplies 17,042 38,790 38,790 38,790 38,790 38,790 Demands 17,042 25,575 27,685 28,527 29,283 29,921 Difference -- 13,215 11,105 10,263 9,507 8, Single Dry Year Conditions In a single dry year condition, the City anticipates slight increases in its water supply deliveries consistent with the increased demand projections in Chapter 4. As described in more detail in Chapter 4, this demand increase represents the generalized expansion of the landscape irrigation season due to limited rainfall meaning customers begin demanding landscape irrigation supplies from the City earlier in the spring than during a normal year when rainfall would otherwise satisfy landscape water needs. Though the increase is dependent on actual conditions, it is represented by adjusting the normal year annual forecast demand value upward by 5 percent for each 5-year increment to This adjustment reflects rudimentary relationships between, historic use variances and 58 This is consistent with CWC Section 10635, but extends the period an additional 5 years to provide 20 year analysis coverage for the intervening years between UWMP updates. City of Folsom Urban Water Management Plan Final June 2016
73 other conditions and is meant only to highlight the anticipated increase in demands for purposes of City planning. As shown in Table 7-2, the City anticipates adequate water supplies in single dry years through It is important to note, however, that the demand associated with industrial facilities remain constant through the dry year conditions. This elevated demand is used out of an abundance of caution in order to provide a conservative estimate of the impacts of industrial demands on the City s water supply system. Table 7-2 Supply and Demand Comparison (Single Driest-Year) (acre-feet/yr) Current Supplies -- 37,040 37,040 37,040 37,040 37,040 Demands -- 26,853 29,070 29,668 30,162 30,819 Difference -- 10,187 7,970 7,372 6,878 6, Multiple Dry Year Conditions For purposes of this UMWP, the City has assessed a three-year series of dry conditions. As detailed in Chapter 3, the City anticipates reductions in available water supplies during these multiple dry years, consistent with its water supply forecasting. Demand, however, will vary across this planning scenario. This variance is represented by setting the forecast demands for the first of three years equal to the demand used in the single dry year scenario. In the second year, the City would anticipate that its water shortage contingency plan would be triggered, resulting in a demand reduction for that year. The rationale for triggering the WSCP is that water assets from the wholesale agencies may be reduced per those agencies water supply shortage provisions under their rights and assets as well as PG&E contracts. Thus, the City s WSCP Stage 2 reduction target is assumed as implemented (see Chapter 6). Similarly, in the third year, the City would expect further reductions resulting from implementing further WSCP actions. For this third year, the City s Stage 3 reduction target is assumed. However, as described in Section 7.2, the City has assumed full deliveries to its industrial facilities. This resulting analysis has been represented in Table 7-3. During each multiple dry year period projected in Table 7-3, the City anticipates adequate water supplies being available. City of Folsom Urban Water Management Plan Final June 2016
74 Table 7-3 Supply and Demand Comparison (Multiple Dry Years) (acre-feet/yr) Current Supplies -- 37,040 37,040 37,040 37,040 37,040 Demands -- 26,853 29,070 29,668 30,162 30,819 Difference -- 10,187 7,970 7,372 6,878 6,221 (acre-feet/yr) Current Supplies -- 36,500 36,500 36,500 36,500 36,500 Demands -- 24,168 26,163 26,701 27,146 27,737 Difference -- 12,332 10,338 9,799 9,355 8,763 (acre-feet/yr) Current Supplies -- 34,750 34,750 34,750 34,750 34,750 Demands -- 21,483 23,256 23,734 24,130 24,655 Difference -- 13,268 11,495 11,016 10,621 10, Build-out Conditions For the purposes of this 2015 UWMP, Table 7-4 is provided to demonstrate water supply availability at estimated build-out conditions. Table 7-4 Supply and Demand Comparison at Build-out (acre-feet/yr) Normal Single Dry Multi-Dry 1 Multi-Dry 2 Multi-Dry 3 Supplies 38,790 37,040 37,040 36,500 34,750 Demands 31,852 32,808 32,808 28,667 25,482 Difference 6,938 4,232 4,232 7,833 9,269 City of Folsom Urban Water Management Plan Final June 2016
75 APPENDICES Appendix A This appendix section shall contain all compliance and reporting related documents Appendix A-1 Appendix A-2 Appendix A-3 Appendix A-4 DWR Recommended Tables DWR Checklist SBX7-7 Compliance Form AWWA Water Audit Form Appendix B This appendix section shall contain all agency related documents Appendix B-1 Appendix B-2 Appendix B-3 Resolution Adopting the 2015 UWMP Copies of General Notice Publications Copies of Notification Letters Appendix C This appendix section shall contain demand conservation related documents Appendix C-1 Appendix C-2 CUWCC Report Water Shortage Contingency Plan City of Folsom 2015 Urban Water Management Plan Final June 2016
76 This page intentionally left blank
77 Appendix A-1: DWR Recommended Tables City of Folsom 2015 Urban Water Management Plan Final June 2016
78 City of Folsom 2015 Urban Water Management Plan Final June 2016 This page intentionally left blank
79 NOTES FOR REGIONAL URBAN WATER MANAGEMENT PLANS (RUWMPs) RUWMPs will report data for each agency in the RUWMP, requiring duplicates of the standardized tables. The supplier will copy the needed tables and notate each of the copies with the name of the agency, or some other designation, identifying the table with the corresponding agency. WUEdata upload tool for RUWMPs RUWMPs will submit data to the WUEdata upload tool on an individual agency basis. If the RUWMP contains a Regional Alliance, the Regional Alliance information will be uploaded separately from the individual agency information.
80 Table 2-1 Retail Only: Public Water Systems Public Water System Number Public Water System Name Number of Municipal Connections 2015 Volume of Water Supplied 2015 CA City of Folsom Main 19,565 14,945 CA City of Folsom Ashland 1, NOTES: TOTAL 20,597 15,907
81 Table 2-2: Plan Identification Select Only One Type of Plan Name of RUWMP or Regional Alliance applicable drop down list if Individual UWMP Water Supplier is also a member of a RUWMP Water Supplier is also a member of a Regional Alliance NOTES: Regional Urban Water Management Plan (RUWMP)
82 Table 2-3: Agency Identification Type of Agency (select one or both) Agency is a wholesaler Agency is a retailer Fiscal or Calendar Year (select one) UWMP Tables Are in Calendar Years UWMP Tables Are in Fiscal Years If Using Fiscal Years Provide Month and Date that the Fiscal Year Begins (mm/dd) Units of Measure Used in UWMP (select from Drop down) Unit AF NOTES:
83 Table 2-4 Retail: Water Supplier Information Exchange The retail supplier has informed the following wholesale supplier(s) of projected water use in accordance with CWC Wholesale Water Supplier Name (Add additional rows as needed) San Juan Water District NOTES: See Chapter 1 and Appendix A-3
84 Table 3-1 Retail: Population - Current and Projected Population Served NOTES: See Chapter (opt) 63,536 69,196 74,855 81,223 88,552 96,787
85 Table 4-1 Retail: Demands for Potable and Raw Water - Actual Use Type additional rows as needed) (Add 2015 Actual Drop down list May select each use multiple times These are the only Use Types that will be recognized by the WUEdata online submittal tool Additional Description needed) (as Level of Treatment When Delivered Drop down list Volume Single Family Drinking Water 9,217 Multi-Family Drinking Water 1,551 Commercial and industrial Drinking Water 4,615 Other schools and parks Drinking Water 1,114 Institutional/Governmental Drinking Water 680 Losses Drinking Water 1,909 Other aerojet Raw Water TOTAL 2,278 21,363 NOTES: Due to mandated conservation, the actual 2015 demand was 15,900 AF. Values included in this table are representative of 2013 conditions. See Chapter 4.
86 Table 4-2 Retail: Demands for Potable and Raw Water - Projected Use Type (Add additional rows as needed) Drop down list May select each use multiple times These are the only Use Types that will be recognized by the WUEdata online submittal tool opt Single Family 10,743 11,245 11,753 12,262 12,776 Multi-Family 1,822 1,921 2,078 2,292 2,623 Commercial and industrial 5,805 6,540 6,639 6,739 6,739 Other schools and parks 1,700 2,506 2,742 2,860 2,860 Institutional/Governmental Losses 2,011 1,975 1,815 1,632 1,425 Other aerojet 2,731 2,731 2,731 2,731 2,731 NOTES: See Chapter 4 Additional Description (as needed) TOTAL Projected Water Use Report To the Extent that Records are Available 25,575 27,685 28,527 29,283 29,921
87 Table 4-3 Retail: Total Water Demands (opt) Potable and Raw Water Tables 4-1 and 4-2 Recycled Water Demand* Table 6-4 From From 21,363 25,575 27,685 28,527 29,283 29, TOTAL WATER DEMAND 21,363 25,575 27,685 28,527 29,283 29,921 *Recycled water demand fields will be blank until Table 6-4 is complete. NOTES: Due to mandated conservation, the actual 2015 demand was 15,900 AF. Values included in this table are representative of 2013 conditions. See Chapter 4.
88 Table 4-4 Retail: 12 Month Water Loss Audit Reporting Reporting Period Start Date (mm/yyyy) Volume of Water Loss* 01/ * Taken from the field "Water Losses" (a combination of apparent losses and real losses) from the AWWA worksheet. NOTES: See Appendix A-4
89 Table 4-5 Retail Only: Inclusion in Water Use Projections Are Future Water Savings Included in Projections? (Refer to Appendix K of UWMP Guidebook) Drop down list (y/n) Yes If "Yes" to above, state the section or page number, in the cell to the right, where citations of the codes, ordinances, etc utilized in demand projections are found. Chapter 4 Are Lower Income Residential Demands Included In Projections? Drop down list (y/n) NOTES: See Chapter 2 and Chapter 4 Yes
90 Table 5-1 Baselines and Targets Summary Retail Agency or Regional Alliance Only Baseline Period Start Year End Year Average Baseline GPCD* 2015 Interim Target * Confirmed 2020 Target* year Year *All values are in Gallons per Capita per Day (GPCD) NOTES: See Appendix A-3
91 Table 5-2: 2015 Compliance Retail Agency or Regional Alliance Only Actual 2015 GPCD* 2015 Interim Target GPCD* Optional Adjustments to 2015 GPCD Enter "0" if no adjustment is made Methodology 8 Extraordinary Events* Economic Adjustment* Weather Normalization* TOTAL Adjustments* From Adjusted 2015 GPCD* 2015 GPCD* (Adjusted if applicable) Did Supplier Achieve Targeted Reduction for 2015? Y/N Yes *All values are in Gallons per Capita per Day (GPCD) NOTES: See Chapter 4 and Appendix A-3
92 Table 6-1 Retail: Groundwater Volume Pumped Groundwater Type Drop Down List May use each category multiple times Add additional rows as needed Supplier does not pump groundwater. The supplier will not complete the table below. Location or Basin Name Alluvial Basin North American Subbasin TOTAL NOTES: The City intends to use remediated groundwater for future non-potable uses. See Chapter 3.
93 Table 6-2 Retail: Wastewater Collected Within Service Area in 2015 There is no wastewater collection system. The supplier will not complete the table below. Name of Wastewater Collection Agency Add additional rows as needed Percentage of 2015 service area covered by wastewater collection system (optional) Percentage of 2015 service area population covered by wastewater collection system (optional) Wastewater Collection Wastewater Volume Volume of Wastewater Metered or Estimated? Collected from UWMP Drop Down List Service Area 2015 Name of Wastewater Treatment Agency Receiving Collected Wastewater Recipient of Collected Wastewater Is WWTP Located Treatment Plant Within UWMP Name Area? Drop Down List Is WWTP Operation Contracted to a Third Party? (optional) Drop Down List Total Wastewater Collected from Service Area in 2015: NOTES: See Chapter 3. Wastewater is collected by Sacramento Regional County Sanitation District. 0
94 Table 6-3 Retail: Wastewater Treatment and Discharge Within Service Area in 2015 No wastewater is treated or disposed of within the UWMP service area. The supplier will not complete the table below volumes Wastewater Treatment Plant Name Discharge Location Name or Identifier Discharge Location Description Wastewater Discharge ID Number (optional) Method of Disposal Drop down list Does This Plant Treat Wastewater Generated Outside the Service Area? Treatment Level Drop down list Wastewater Treated Discharged Treated Wastewater Recycled Within Service Area Recycled Outside of Service Area Add additional rows as needed NOTES: See Chapter 3. Wastewater is collected by Sacramento Regional County Sanitation District. Total
95 Table 6-4 Retail: Current and Projected Recycled Water Direct Beneficial Uses Within Service Area Recycled water is not used and is not planned for use within the service area of the supplier. The supplier will not complete the table below. Name of Agency Producing (Treating) the Recycled Water: Name of Agency Operating the Recycled Water Distribution System: Supplemental Water Added in 2015 Source of 2015 Supplemental Water Beneficial Use Type Agricultural irrigation Landscape irrigation (excludes golf courses) Golf course irrigation Commercial use Industrial use Geothermal and other energy production Seawater intrusion barrier Recreational impoundment Wetlands or wildlife habitat Groundwater recharge (IPR)* Surface water augmentation (IPR)* Direct potable reuse Other (Provide General Description) General Description of 2015 Uses *IPR - Indirect Potable Reuse NOTES: See Chapter 3. Wastewater is collected by Sacramento Regional County Sanitation District. Level of Treatment Drop down list (opt) Total:
96 Table 6-5 Retail: 2010 UWMP Recycled Water Use Projection Compared to 2015 Actual Recycled water was not used in 2010 nor projected for use in The supplier will not complete the table below. Use Type 2010 Projection for Actual Use Agricultural irrigation Landscape irrigation (excludes golf courses) Golf course irrigation Commercial use Industrial use Geothermal and other energy production Seawater intrusion barrier Recreational impoundment Wetlands or wildlife habitat Groundwater recharge (IPR) Surface water augmentation (IPR) Direct potable reuse Other Type of Use Total 0 0 NOTES: See Chapter 3. Wastewater is collected by Sacramento Regional County Sanitation District.
97 Table 6-6 Retail: Methods to Expand Future Recycled Water Use Supplier does not plan to expand recycled water use in the future. Supplier will not complete the table below but will provide narrative explanation. Provide page location of narrative in UWMP Name of Action Description Add additional rows as needed Planned Implementation Year Expected Increase in Recycled Water Use Total NOTES: See Chapter 3. Wastewater is collected by Sacramento Regional County Sanitation District. 0
98 Table 6-7 Retail: Expected Future Water Supply Projects or Programs No expected future water supply projects or programs that provide a quantifiable increase to the agency's water supply. Supplier will not complete the table below. Some or all of the supplier's future water supply projects or programs are not compatible with this table and are described in a narrative format. Chapter 3 Provide page location of narrative in the UWMP Name of Future Projects or Programs Joint Project with other agencies? Drop Down List (y/n) If Yes, Agency Name Description (if needed) Planned Implementation Year Planned for Use in Year Type Drop Down List Expected Increase in Water Supply to Agency This may be a range Add additional rows as needed NOTES: See Chapter 3.
99 Table 6-8 Retail: Water Supplies Actual Water Supply 2015 Drop down list May use each category multiple times. These are the only water supply categories that will be recognized by the WUEdata online submittal tool Additional Detail on Water Supply Actual Volume Water Quality Drop Down List Total Right or Safe Yield (optional) Add additional rows as needed Surface water Pre-1914 Appropriative Drinking 22,000 Right Water Surface water GSWC Contract 5,000 Drinking Water Purchased or Imported Water CVP Fazio Contract 7,000 Drinking Water Purchased or Imported Water Ashland Area Contract 1,540 Drinking Water Groundwater GET A and GET B 3,250 Raw Water NOTES: Total 38,790 0
100 Table 6-9 Retail: Water Supplies Projected Water Supply Drop down list May use each category multiple times. These are the only water supply categories that will be recognized by the WUEdata online submittal tool Add additional rows as needed Reasonably Available Volume Total Right or Safe Yield (optional) Reasonably Available Volume Total Right or Safe Yield (optional) Reasonably Available Volume Total Right or Safe Yield (optional) Reasonably Available Volume Total Right or Safe Yield (optional) Surface water Pre-1914 Appropriative Right 22,000 22,000 22,000 22,000 22,000 Surface water GSWC Contract 5,000 5,000 5,000 5,000 5,000 Purchased or Imported Water CVP Fazio Contract 7,000 7,000 7,000 7,000 7,000 Purchased or Imported Water Ashland Area Contract 1,540 1,540 1,540 1,540 1,540 Groundwater GET A and GET B 3,250 3,250 3,250 3,250 3,250 NOTES: See Chapter 3 Additional Detail on Water Supply Total Projected Water Supply Report To the Extent Practicable (opt) Reasonably Available Volume 38, , , , ,790 0 Total Right or Safe Yield (optional)
101 Table 7-1 Retail: Basis of Water Year Data Volume Available % of Average Supply Average Year 100% Single-Dry Year Multiple-Dry Years 1st Year Multiple-Dry Years 2nd Year Multiple-Dry Years 3rd Year Multiple-Dry Years 4th Year Optional Multiple-Dry Years 5th Year Optional Multiple-Dry Years 6th Year Optional Agency may use multiple versions of Table 7-1 if different water sources have different base years and the supplier chooses to report the base years for each water source separately. If an agency uses multiple versions of Table 7-1, in the "Note" section of each table, state that multiple versions of Table 7-1 are being used and identify the particular water source that is being reported in each table. NOTES: Year Type Base Year If not using a calendar year, type in the last year of the fiscal, water year, or range of years, for example, water year , use 2000 Available Supplies if Year Type Repeats Quantification of available supplies is not compatible with this table and is provided elsewhere in the UWMP. Location Section 3.2 Quantification of available supplies is provided in this table as either volume only, percent only, or both.
102 Table 7-2 Retail: Normal Year Supply and Demand Comparison (Opt) Supply totals (autofill from Table 6-9) 38,790 38,790 38,790 38,790 38,790 Demand totals (autofill from Table 4-3) 25,575 27,685 28,527 29,283 29,921 Difference NOTES: See chapter 7 13,215 11,105 10,263 9,507 8,869
103 Table 7-3 Retail: Single Dry Year Supply and Demand Comparison (Opt) Supply totals 37,040 37,040 37,040 37,040 37,040 Demand totals 26, ,668 30,162 30,819 Difference 10,187 7,970 7,372 6,878 6,221 NOTES: See Chapter 7.
104 Table 7-4 Retail: Multiple Dry Years Supply and Demand Comparison (Opt) Supply totals 37,040 37,040 37,040 37,040 37,040 First year Demand totals 26,853 29,070 29,668 30,162 30,819 Difference 10,187 7,970 7,372 6,878 6,221 Supply totals 36,500 36,500 36,500 36,500 36,500 Second year Demand totals 24,168 26,163 26,701 27,146 27,737 Difference 12,332 10,337 9,799 9,354 8,763 Supply totals 34,750 34,750 34,750 34,750 34,750 Third year Demand totals 21,483 23,256 23,734 24,130 24,655 NOTES: See Chapter 7 Difference 13,267 11,494 11,016 10,620 10,095
105 Table 8-1 Retail Stages of Water Shortage Contingency Plan Complete Both Stage Percent Supply Reduction 1 Numerical value as a percent Water Supply Condition (Narrative description) Add additional rows as needed Stage1 Normal Voluntary Conservation Stage2 12% Voluntary conservation with water use reduction Stage 3 20% Moderate conservation with some mandatory conservation Stage 4 35% Mandatory water conservation with some prohbitions Stage 5 50% Mandatroy prohibitions and conservation 1 One stage in the Water Shortage Contingency Plan must address a water shortage of 50%. NOTES: See. Section 6.2, 6.5
106 Table 8-2 Retail Only: Restrictions and Prohibitions on End Uses Stage Restrictions and Prohibitions on End Users Drop down list These are the only categories that will be accepted by the WUEdata online submittal tool Additional Explanation or Reference (optional) Penalty, Charge, or Other Enforcement? Drop Down List Add additional rows as needed Stage 1 Other - Customers must repair leaks, breaks, and malfunctions in a timely manner Yes Stage 1 Landscape - Other landscape restriction or prohibition No irrigation during rain Yes Stage 2 Landscape - Limit landscape irrigation to specific days 3 days per week Yes Stage 2 CII - Restaurants may only serve water upon request Yes Stage 2 Other - Prohibit use of potable water for washing hard surfaces Yes Stage 3 Landscape - Limit landscape irrigation to specific days 2 days a week Yes Stage 4 Water Features - Restrict water use for decorative water features, such as fountains Yes Stage 4 Other water feature or swimming pool restriction No new pool permits Yes Stage 5 Landscape - Prohibit certain types of landscape irrigation Yes Stage 5 Other No flushing of sewer or fire systems, unless required by health and safety Yes NOTES: See Section 6.5, Appendix D-2
107 Table 8-3 Retail Only: Stages of Water Shortage Contingency Plan - Consumption Reduction Methods Stage Consumption Reduction Methods by Water Supplier Drop down list These are the only categories that will be accepted by the WUEdata online submittal tool Additional Explanation or Reference (optional) Add additional rows as needed Stage 2 Expand Public Information Campaign Implement or Modify Drought Rate Structure Stage 4 or Surcharge Stage 5 Decrease Line Flushing NOTES: See Chapter 6 and Appendix D-2
108 Table 8-4 Retail: Minimum Supply Next Three Years Available Water Supply 37,540 37,000 35,250 NOTES: See Section 6.9
109 Table 10-1 Retail: Notification to Cities and Counties Roseville City Name 60 Day Notice Add additional rows as needed Notice of Public Hearing County Name Drop Down List Sacramento County 60 Day Notice Add additional rows as needed Notice of Public Hearing See Chapter 1 and Appendix B-3. Many notices were sent to entities that are not cities or counties
110 This page intentionally left blank
111 Appendix A-2: DWR Checklist City of Folsom 2015 Urban Water Management Plan Final June 2016
112 City of Folsom 2015 Urban Water Management Plan Final June 2016 This page intentionally left blank
113 2015 UWMP Checklist CWC Section 10620(b) 10620(d)(2) UWMP Requirement Subject Guidebook Location Every person that becomes an urban water supplier shall adopt an urban water management plan within one year after it has become an urban water supplier. Coordinate the preparation of its plan with other appropriate agencies in the area, including other water suppliers that share a common source, water management agencies, and relevant public agencies, to the extent practicable Provide supporting documentation that the water supplier has encouraged active involvement of diverse social, cultural, and economic elements of the population within the service area prior to and during the preparation of the plan (a) Describe the water supplier service area. System Description 10631(a) Describe the climate of the service area of the supplier (a) Provide population projections for 2020, 2025, 2030, and (a) 10631(a) Describe other demographic factors affecting the supplier s water management planning. Indicate the current population of the service area (1) Quantify past, current, and projected water use, identifying the uses among water use sectors (3)(A) (a) (b) Report the distribution system water loss for the most recent 12-month period available. Include projected water use needed for lower income housing projected in the service area of the supplier. Retail suppliers shall adopt a 2020 water use target using one of four methods Retail suppliers shall provide baseline daily per capita water use, urban water use target, interim urban water use target, and Checklist - 1 UWMP Location (Optional Column for Agency Use) Plan Preparation Section Plan Preparation Section , App B-3 Plan Preparation Section , App B-3 System Description System Description System Description System Description and Baselines and Targets System Water Use System Water Use System Water Use Baselines and Targets Baselines and Targets Section Section Section Section Sections 3.4 and Section ,App A-1 Section 4.3 App A-4 Section Section 5.7 and App E Chapter 5 and App E 4.1, App A-3 4.1, 4.2, App A-3
114 compliance daily per capita water use, along with the bases for determining those estimates, including references to supporting data Retail suppliers per capita daily water use reduction shall be no less than 5 percent of base daily per capita water use of the 5 year baseline. This does not apply if the suppliers base GPCD is at or below (a) Retail suppliers shall meet their interim target by December 31, (d)(2) If the retail supplier adjusts its compliance GPCD using weather normalization, economic adjustment, or extraordinary events, it shall provide the basis for, and data supporting the adjustment Wholesale suppliers shall include an assessment of present and proposed future measures, programs, and policies to help their retail water suppliers achieve targeted water use reductions Retail suppliers shall report on their progress in meeting their water use targets. The data shall be reported using a standardized form (b) 10631(b) 10631(b)(1) Identify and quantify the existing and planned sources of water available for 2015, 2020, 2025, 2030, and Indicate whether groundwater is an existing or planned source of water available to the supplier. Indicate whether a groundwater management plan has been adopted by the water supplier or if there is any other specific authorization for groundwater management. Include a copy of the plan or authorization. Checklist - 2 Baselines and Targets Baselines and Targets Baselines and Targets Baselines and Targets Baselines and Targets Section Section 5.8 and App E 4.1, 4.2, App A-3 4.2, App A-3 Section , App A-3 Section 5.1 Section 5.8 and App E n/a App A-3 System Supplies Chapter System Supplies Section , 3.3 System Supplies Section , App C- 2, C (b)(2) Describe the groundwater basin. System Supplies Section (b)(2) 10631(b)(2) 10631(b)(3) Indicate if the basin has been adjudicated and include a copy of the court order or decree and a description of the amount of water the supplier has the legal right to pump. For unadjudicated basins, indicate whether or not the department has identified the basin as overdrafted, or projected to become overdrafted. Describe efforts by the supplier to eliminate the long-term overdraft condition. Provide a detailed description and analysis of the location, amount, and sufficiency of groundwater pumped by the urban water System Supplies Section System Supplies Section System Supplies Section
115 10631(b)(4) 10631(d) 10631(g) 10631(h) 10631(j) 10631(j) supplier for the past five years Provide a detailed description and analysis of the amount and location of groundwater that is projected to be pumped. Describe the opportunities for exchanges or transfers of water on a short-term or longterm basis. Describe the expected future water supply projects and programs that may be undertaken by the water supplier to address water supply reliability in average, single-dry, and multiple-dry years. Describe desalinated water project opportunities for long-term supply. Retail suppliers will include documentation that they have provided their wholesale supplier(s) if any with water use projections from that source. Wholesale suppliers will include documentation that they have provided their urban water suppliers with identification and quantification of the existing and planned sources of water available from the wholesale to the urban supplier during various water year types For wastewater and recycled water, coordinate with local water, wastewater, groundwater, and planning agencies that operate within the supplier s service area (a) 10633(b) Describe the wastewater collection and treatment systems in the supplier s service area. Include quantification of the amount of wastewater collected and treated and the methods of wastewater disposal. Describe the quantity of treated wastewater that meets recycled water standards, is being discharged, and is otherwise available for use in a recycled water project Describe the recycled water currently being used in the supplier s service area (d) Describe and quantify the potential uses of recycled water and provide a determination of the technical and economic feasibility of those uses Describe the projected use of recycled water within the supplier s service area at the end of 5, 10, 15, and 20 years, and a description of the actual use of recycled water in comparison to uses previously projected. System Supplies Sections 6.2 and System Supplies Section System Supplies Section ,3.2 System Supplies Section System Supplies Section Chapter 1 Chapter. 3 System Supplies Section n/a System Supplies (Recycled Water) System Supplies (Recycled Water) System Supplies (Recycled Water) System Supplies (Recycled Water) System Supplies (Recycled Water) System Supplies (Recycled Water) Section , 3.4 Section Section Section and Section Section Checklist - 3
116 10633(f) 10633(g) 10620(f) Describe the actions which may be taken to encourage the use of recycled water and the projected results of these actions in terms of acre-feet of recycled water used per year. Provide a plan for optimizing the use of recycled water in the supplier s service area. Describe water management tools and options to maximize resources and minimize the need to import water from other regions (1) Describe the reliability of the water supply and vulnerability to seasonal or climatic shortage (1) Provide data for an average water year, a single dry water year, and multiple dry water years (2) For any water source that may not be available at a consistent level of use, describe plans to supplement or replace that source Provide information on the quality of existing sources of water available to the supplier and the manner in which water quality affects water management strategies and supply reliability 10635(a) 10632(a) and 10632(a)(1) 10632(a)(2) 10632(a)(3) 10632(a)(4) 10632(a)(5) 10632(a)(6) Assess the water supply reliability during normal, dry, and multiple dry water years by comparing the total water supply sources available to the water supplier with the total projected water use over the next 20 years. Provide an urban water shortage contingency analysis that specifies stages of action and an outline of specific water supply conditions at each stage. Provide an estimate of the minimum water supply available during each of the next three water years based on the driest threeyear historic sequence for the agency. Identify actions to be undertaken by the urban water supplier in case of a catastrophic interruption of water supplies. Identify mandatory prohibitions against specific water use practices during water shortages. Specify consumption reduction methods in the most restrictive stages. Indicated penalties or charges for excessive use, where applicable. Checklist - 4 System Supplies (Recycled Water) System Supplies (Recycled Water) Water Supply Reliability Assessment Water Supply Reliability Assessment Water Supply Reliability Assessment Water Supply Reliability Assessment Water Supply Reliability Assessment Water Supply Reliability Assessment Water Shortage Contingency Planning Water Shortage Contingency Planning Water Shortage Contingency Planning Water Shortage Contingency Planning Water Shortage Contingency Planning Water Shortage Contingency Section Section Section ,3.6 Section 7.1 Chapter 3 Chapter 7 Section Section , 3.7 Section Section 7.3 Chapter 7 Section , App D-2 Section Section Section Section Section
117 10632(a)(7) 10632(a)(8) 10632(a)(9) 10631(f)(1) 10631(f)(2) Provide an analysis of the impacts of each of the actions and conditions in the water shortage contingency analysis on the revenues and expenditures of the urban water supplier, and proposed measures to overcome those impacts. Provide a draft water shortage contingency resolution or ordinance. Indicate a mechanism for determining actual reductions in water use pursuant to the water shortage contingency analysis. Retail suppliers shall provide a description of the nature and extent of each demand management measure implemented over the past five years. The description will address specific measures listed in code. Wholesale suppliers shall describe specific demand management measures listed in code, their distribution system asset management program, and supplier assistance program (i) CUWCC members may submit their CUWCC BMP annual reports in lieu of, or in addition to, describing the DMM implementation in their UWMPs. This option is only allowable if the supplier has been found to be in full compliance with the CUWCC MOU (a) 10621(b) 10621(d) 10635(b) Retail suppliers shall conduct a public hearing to discuss adoption, implementation, and economic impact of water use targets. Notify, at least 60 days prior to the public hearing, any city or county within which the supplier provides water that the urban water supplier will be reviewing the plan and considering amendments or changes to the plan. Each urban water supplier shall update and submit its 2015 plan to the department by July 1, Provide supporting documentation that Water Shortage Contingency Plan has been, or will be, provided to any city or county within which it provides water, no later than 60 days after the submission of the plan to DWR Provide supporting documentation that the urban water supplier made the plan available for public inspection, published notice of the Checklist - 5 Planning Water Shortage Contingency Planning Water Shortage Contingency Planning Water Shortage Contingency Planning Demand Management Measures Demand Management Measures Demand Management Measures Plan Adoption, Submittal, and Implementation Plan Adoption, Submittal, and Implementation Plan Adoption, Submittal, and Implementation Plan Adoption, Submittal, and Implementation Plan Adoption, Submittal, and Section Section 8.7 D-2 Section , D-2 Sections 9.2 and 9.3 Sections 9.1 and , D-1 n/a Section , D-1 Section Section , App B-3 Sections and Section D-2 Sections , 10.3, 1.3, App B-2
118 public hearing, and held a public hearing about the plan The water supplier is to provide the time and place of the hearing to any city or county within which the supplier provides water Provide supporting documentation that the plan has been adopted as prepared or modified (a) 10644(a)(1) Provide supporting documentation that the urban water supplier has submitted this UWMP to the California State Library. Provide supporting documentation that the urban water supplier has submitted this UWMP to any city or county within which the supplier provides water no later than 30 days after adoption (a)(2) The plan, or amendments to the plan, submitted to the department shall be submitted electronically Provide supporting documentation that, not later than 30 days after filing a copy of its plan with the department, the supplier has or will make the plan available for public review during normal business hours. Implementation and 10.5 Plan Adoption, Submittal, and Implementation Plan Adoption, Submittal, and Implementation Plan Adoption, Submittal, and Implementation Plan Adoption, Submittal, and Implementation Plan Adoption, Submittal, and Implementation Plan Adoption, Submittal, and Implementation Sections , B-2 Section Section Section Sections and Section Checklist - 6
119 Appendix A-3: SBX7-7 Compliance Forms City of Folsom 2015 Urban Water Management Plan Final June 2016
120 City of Folsom 2015 Urban Water Management Plan Final June 2016 This page intentionally left blank
121 SB X7-7 Verification Form Version FINAL.1 Table 4-C.4 has been modified from the FINAL version. WUEdata Entry Exceptions The data from the tables below will not be entered into WUEdata tables (the tabs for these tables' worksheets are colored purple). These tables will be submitted as separate uploads, in Excel, to WUEdata. Process Water Deduction SB X7-7 tables 4-C, 4-C.1, 4-C.2, 4-C.3, 4-C.4 and 4-D A supplier that will use the process water deduction will complete the appropriate tables in Excel, submit them as a separate upload to the WUE data tool, and include them in its UWMP. Target Method 2 SB X7-7 tables 7-B, 7-C, and 7-D A supplier that selects Target Method 2 will contact DWR (gwen.huff@water.ca.gov) for SB X7-7 tables 7-B, 7-C, and 7-D. Target Method 4 These tables are only available online at A supplier that selects Target Method 4 will save the tables from the website listed above, complete the tables, submit as a separate upload to WUE data, and include them with its UWMP.
122 SB X7-7 Table 0: Units of Measure Used in UWMP* one from the drop down list) Acre Feet *The unit of measure must be consistent with Table 2-3 NOTES: (select
123 SB X7-7 Table-1: Baseline Period Ranges Baseline 10- to 15-year baseline period 5-year baseline period Parameter Value Units 2008 total water deliveries 26,644 Acre Feet 2008 total volume of delivered recycled water - Acre Feet 2008 recycled water as a percent of total deliveries 0.00% Percent Number of years in baseline period 1, 2 10 Years Year beginning baseline period range 1996 Year ending baseline period range Number of years in baseline period 5 Years Year beginning baseline period range 2004 Year ending baseline period range If the 2008 recycled water percent is less than 10 percent, then the first baseline period is a continuous 10-year period. If the amount of recycled water delivered in is 10 percent or greater, the first baseline period is a continuous 10- to 15-year period. The Water Code requires that the baseline period is between 10 and 15 years. However, DWR recognizes that some water suppliers may not have the minimum 10 years of baseline data. 3 The ending year must be between December 31, 2004 and December 31, The ending year must be between December 31, 2007 and December 31, NOTES: See Chapter 4
124 SB X7-7 Table 2: Method for Population Estimates Method Used to Determine Population (may check more than one) 1. Department of Finance (DOF) DOF Table E-8 ( ) and ( ) and DOF Table E-5 ( ) when available 2. Persons-per-Connection Method 3. DWR Population Tool NOTES: See Chapter 2 4. Other DWR recommends pre-review
125 SB X7-7 Table 3: Service Area Population Year Population 10 to 15 Year Baseline Population Year ,022 Year ,614 Year ,124 Year ,288 Year ,677 Year ,324 Year ,583 Year ,661 Year ,456 Year ,253 5 Year Baseline Population Year ,456 Year ,253 Year ,658 Year ,811 Year , Compliance Year Population ,536 NOTES: See Chapter 4
126 SB X7-7 Table 4: Annual Gross Water Use * Baseline Year Fm SB X7-7 Table 3 Volume Into Distribution System This column will remain blank until SB X7-7 Table 4-A is completed. Exported Water Change in Dist. System Storage (+/-) Deductions Indirect Recycled Water This column will remain blank until SB X7-7 Table 4-B is completed. Water Delivered for Agricultural Use Process Water This column will remain blank until SB X7-7 Table 4-D is completed. Annual Gross Water Use 10 to 15 Year Baseline - Gross Water Use Year , ,761 Year , ,603 Year , ,376 Year , ,196 Year , ,278 Year , ,354 Year , ,415 Year , ,913 Year , ,547 Year , , year baseline average gross water use 21,342 5 Year Baseline - Gross Water Use Year , ,547 Year , ,974 Year , ,519 Year , ,304 Year , ,644 5 year baseline average gross water use 26, Compliance Year - Gross Water Use , ,907 * NOTE that the units of measure must remain consistent throughout the UWMP, as reported in Table 2-3 NOTES: See Chapter 4
127 SB X7-7 Table 4-A: Volume Entering the Distribution System(s) Complete one table for each source. Name of Source All Supplies This water source is: The supplier's own water source A purchased or imported source Baseline Year Fm SB X7-7 Table 3 Volume Entering Distribution System Meter Error Adjustment* Optional (+/-) Corrected Volume Entering Distribution System 10 to 15 Year Baseline - Water into Distribution System Year ,761 14,761 Year ,603 17,603 Year ,376 17,376 Year ,196 20,196 Year ,278 20,278 Year ,354 25,354 Year ,415 23,415 Year ,913 23,913 Year ,547 25,547 Year ,974 24,974 5 Year Baseline - Water into Distribution System Year ,547 25,547 Year ,974 24,974 Year ,519 26,519 Year ,304 27,304 Year ,644 26, Compliance Year - Water into Distribution System ,907 15,907 * Meter Error Adjustment - See guidance in Methodology 1, Step 3 of Methodologies Document NOTES: See Chapters 3 and 4.
128 SB X7-7 Table 5: Gallons Per Capita Per Day (GPCD) Baseline Year Fm SB X7-7 Table 3 10 to 15 Year Baseline GPCD Service Area Population Fm SB X7-7 Table 3 Annual Gross Water Use Fm SB X7-7 Table 4 Daily Per Capita Water Use (GPCD) Year ,022 14, Year ,614 17, Year ,124 17, Year ,288 20, Year ,677 20, Year ,324 25, Year ,583 23, Year ,661 23, Year ,456 25, Year ,253 24, Year Average Baseline GPCD Year Baseline GPCD Baseline Year Fm SB X7-7 Table 3 Service Area Population Fm SB X7-7 Table 3 Gross Water Use Fm SB X7-7 Table 4 Daily Per Capita Water Use Year ,456 25, Year ,253 24, Year ,658 26, Year ,811 27, Year ,449 26, Year Average Baseline GPCD Compliance Year GPCD 2015 NOTES: See Chapter 4 63,536 15,
129 SB X7-7 Table 6: Gallons per Capita per Day Summary From Table SB X7-7 Table Year Baseline GPCD 5 Year Baseline GPCD Compliance Year GPCD 224 NOTES: See Chapter 4
130 SB X7-7 Table 7: 2020 Target Method Select Only One Target Method Method 1 Method 2 Supporting Documentation SB X7-7 Table 7A SB X7-7 Tables 7B, 7C, and 7D Contact DWR for these tables Method 3 SB X7-7 Table 7-E Method 4 NOTES: See Chapter 4 Method 4 Calculator
131 SB X7-7 Table 7-A: Target Method 1 20% Reduction Year Baseline GPCD 2020 Target GPCD NOTES: See Chapter
132 SB X7-7 Table 7-F: Confirm Minimum Reduction for 2020 Target 5 Year Baseline GPCD From SB X7-7 Table 5 Maximum 2020 Target 1 Calculated 2020 Target 2 Confirmed 2020 Target Maximum 2020 Target is 95% of the 5 Year Baseline GPCD Target is calculated based on the selected Target Method, see SB X7-7 Table 7 and corresponding tables for agency's calculated target. NOTES: See Chapter 4
133 SB X7-7 Table 8: 2015 Interim Target GPCD Confirmed 2020 Target Fm SB X7-7 Table 7-F year Baseline GPCD Fm SB X7-7 Table Interim Target GPCD NOTES: See Chapter 4
134 SB X7-7 Table 9: 2015 Compliance Actual 2015 GPCD 2015 Interim Target GPCD Extraordinary Events Optional Adjustments (in GPCD) Enter "0" if Adjustment Not Used Weather Normalization Economic Adjustment TOTAL Adjustments Adjusted 2015 GPCD 2015 GPCD (Adjusted if applicable) Did Supplier Achieve Targeted Reduction for 2015? YES NOTES: See Chapter 4
135 Appendix A-4: AWWA Water Audit Form City of Folsom 2015 Urban Water Management Plan Final June 2016
136 City of Folsom 2015 Urban Water Management Plan Final June 2016 This page intentionally left blank
137 AWWA WLCC Free Water Audit Software: Reporting Worksheet Copyright 2010, American Water Works Association. All Rights Reserved. WAS v4.1 Back to Instructions? Click to access definition Water Audit Report for: City of Folsom Reporting Year: / /2015 Please enter data in the white cells below. Where available, metered values should be used; if metered values are unavailable please estimate a value. Indicate your confidence in the accuracy of the input data by grading each component (1-10) using the drop-down list to the left of the input cell. Hover the mouse over the cell to obtain a description of the grades WATER SUPPLIED All volumes to be entered as: ACRE-FEET PER YEAR Volume from own sources:? 9 15, acre-ft/yr Master meter error adjustment (enter positive value):? under-registered Water imported:? acre-ft/yr Water exported:? n/a acre-ft/yr AUTHORIZED CONSUMPTION WATER SUPPLIED: 17, acre-ft/yr. Click here:? Billed metered:? 10 13, acre-ft/yr for help using option Billed unmetered:? acre-ft/yr buttons below Unbilled metered:? acre-ft/yr Pcnt: Value: Unbilled unmetered:? acre-ft/yr 1.25% AUTHORIZED CONSUMPTION:? 13, acre-ft/yr WATER LOSSES (Water Supplied - Authorized Consumption) 3, acre-ft/yr Apparent Losses Pcnt: Value: Unauthorized consumption:? acre-ft/yr 0.25% Customer metering inaccuracies:? acre-ft/yr 0.75% Systematic data handling errors:? acre-ft/yr Apparent Losses:? Real Losses (Current Annual Real Losses or CARL) Real Losses = Water Losses - Apparent Losses:? 3, acre-ft/yr WATER LOSSES: 3, acre-ft/yr NON-REVENUE WATER NON-REVENUE WATER:? 3, acre-ft/yr = Total Water Loss + Unbilled Metered + Unbilled Unmetered SYSTEM DATA << Enter grading in column 'E' Default option selected for Unbilled unmetered - a grading of 5 is applied but not displayed Default option selected for unauthorized consumption - a grading of 5 is applied but not displayed Length of mains:? miles Number of active AND inactive service connections:? 9 20,383 Connection density: 59 conn./mile main Average length of customer service line:? ft (pipe length between curbstop and customer meter or property boundary) Average operating pressure:? psi acre-ft/yr Use buttons to select percentage of water supplied OR value? Choose this option to enter a percentage of billed metered consumption. This is NOT a default value COST DATA Total annual cost of operating water system:? 9 $15,804,992 $/Year Customer retail unit cost (applied to Apparent Losses):? 9 $2.30 $/100 cubic feet (ccf) Variable production cost (applied to Real Losses):? 8 $ $/acre-ft/yr PERFORMANCE INDICATORS Financial Indicators Non-revenue water as percent by volume of Water Supplied: 21.2% Non-revenue water as percent by cost of operating system: 6.4% Annual cost of Apparent Losses: $327,402 Annual cost of Real Losses: $632,566 Operational Efficiency Indicators Apparent Losses per service connection per day: gallons/connection/day Real Losses per service connection per day*: gallons/connection/day Real Losses per length of main per day*: N/A Real Losses per service connection per day per psi pressure: 2.00 gallons/connection/day/psi? Unavoidable Annual Real Losses (UARL): million gallons/year? From Above, Real Losses = Current Annual Real Losses (CARL): Infrastructure Leakage Index (ILI) [CARL/UARL]: 3, million gallons/year 7.41 * only the most applicable of these two indicators will be calculated WATER AUDIT DATA VALIDITY SCORE: *** YOUR SCORE IS: 85 out of 100 *** A weighted scale for the components of consumption and water loss is included in the calculation of the Water Audit Data Validity Score PRIORITY AREAS FOR ATTENTION: Based on the information provided, audit accuracy can be improved by addressing the following components: 1: Volume from own sources 2: Unauthorized consumption For more information, click here to see the Grading Matrix worksheet 3: Master meter error adjustment AWWA Water Loss Control Committee Reporting Worksheet 1
138 AWWA WLCC Free Water Audit Software: Water Balance Copyright 2010, American Water Works Association. All Rights Reserved. WAS v4.1 Water Audit Report For: Report Yr: City of Folsom 2015 Own Sources (Adjusted for known errors) Water Exported Billed Authorized Consumption Billed Metered Consumption (inc. water exported) Revenue Water 13, Authorized Consumption 13, Billed Unmetered Consumption 13, , Unbilled Metered Consumption Unbilled Authorized Consumption 16, Unbilled Unmetered Consumption Water Supplied Unauthorized Consumption 3, Apparent Losses , Customer Metering Inaccuracies Systematic Data Handling Errors Water Losses Leakage on Transmission and/or Water Imported 3, Distribution Mains Real Losses , Billed Water Exported Not broken down Leakage and Overflows at Utility's Storage Tanks Not broken down Leakage on Service Connections Not broken down Non-Revenue Water (NRW) AWWA Water Loss Control Committee Water Balance 1
139 Appendix B-1: Resolution Adopting the 2015 UWMP City of Folsom 2015 Urban Water Management Plan Final June 2016
140 City of Folsom 2015 Urban Water Management Plan Final June 2016 This page intentionally left blank
141
142 This page intentionally left blank
143 Appendix B-2: Copies of General Notice Publications City of Folsom 2015 Urban Water Management Plan Final June 2016
144 City of Folsom 2015 Urban Water Management Plan Final June 2016 This page intentionally left blank
145
146 This page intentionally left blank
147 Appendix B-3: Copies of Notification Letters City of Folsom 2015 Urban Water Management Plan Final June 2016
148 City of Folsom 2015 Urban Water Management Plan Public Draft June 2, 2016 This page intentionally left blank
149

150
151

152
153

154
155
156 This page intentionally left blank
157 Appendix C-1: CUWCC Report City of Folsom 2015 Urban Water Management Plan Public Draft June 2, 2016
158 City of Folsom 2015 Urban Water Management Plan Public Draft June 2, 2016 This page intentionally left blank
159 CUWCC BMP Coverage Report City of Folsom GPCD in GPCD in GPCD Target for 2018: Biennial GPCD Compliance Table ON TRACK Target Highest Acceptable Bound Year Report % Base GPCD % Base GPCD 96.4% % % % % % % % % %
160 CUWCC BMP Retail Coverage Report 2013 Foundational Best Managemant Practices for Urban Water Efficiency 6978 BMP 1.1 Operation Practices City of Folsom ON TRACK 1. Conservation Coordinator provided with necessary resources to implement BMPs? Name: Title: Don Smith Water Management Coordinator 2. Water Waste Prevention Documents WW Document Name WWP File Name WW Prevention URL WW Prevention Ordinance Terms Description Option A Describe the ordinances or terms of service adopted by your agency to meet the water waste prevention requirements of this BMP. Option B Describe any water waste prevention ordinances or requirements adopted by your local jurisdiction or regulatory agencies within your service area. Option C Describe any documentation of support for legislation or regulations that prohibit water waste. Option D Describe your agency efforts to cooperate with other entities in the adoption or enforcement of local requirements consistent with this BMP. Option E Describe your agency support positions with respect to adoption of legislation or regulations that are consistent with this BMP. Option F Describe your agency efforts to support local ordinances that establish permits requirements for water efficient design in new development. Copy_of_Folsom_Municipa l_code.website The City of Folsom has adopted and actively enforces Folsom Municipal Code 13.26, including prohibitions against the wasteful use of water. The City of Folsom has coordinated with other agencies to standardize language for drought stages At Least As effective As No
161 CUWCC BMP Retail Coverage Report 2013 Foundational Best Managemant Practices for Urban Water Efficiency BMP 1.1 Operation Practices ON TRACK Exemption Comments: No
162 CUWCC BMP Coverage Report 2013 Foundational Best Management Practices For Urban Water Efficiency BMP 1.2 Water Loss Control ON TRACK 6978 City of Folsom Completed Standard Water Audit Using AWWA Software? AWWA File provided to CUWCC? Yes Yes Folsom_2013_AWWA_Audit_Final.xls AWWA Water Audit Validity Score? 83 Complete Training in AWWA Audit Method Complete Training in Component Analysis Process? Component Analysis? Repaired all leaks and breaks to the extent cost effective? Locate and Repar unreported leaks to the extent cost effective? Yes Yes Yes Yes Yes Maintain a record keeping system for the repair of reported leaks, including time of report, leak location, type of leaking pipe segment or fitting, and leak running time from report to repair. Yes Provided 7 Types of Water Loss Control Info Leaks Repairs Value Real Losses Value Apparent Losses Miles Surveyed Press Reduction Cost Of Interventions Water Saved (AF) At Least As effective As No Exemption No Comments:
163 CUWCC BMP Coverage Report 2013 Foundational Best Management Practices For Urban Water Efficiency BMP 1.3 Metering With Commodity NOT ON TRACK 6978 City of Folsom Numbered Unmetered Accounts Metered Accounts billed by volume of use No Yes Number of CII Accounts with Mixed Use Meters Conducted a feasibility study to assess merits of a program to provide incentives to switch mixed-use accounts to dedicated landscape meters? No Feasibility Study provided to CUWCC? No Date: 1/1/0001 Uploaded file name: Completed a written plan, policy or program to test, repair and replace meters Yes At Least As effective As No Exemption No Comments:
164 CUWCC BMP Coverage Report 2013 Foundational Best Management Practices For Urban Water Efficiency BMP 1.4 Retail Consrvation Pricing On Track 6978 City of Folsom Implementation (Water Rate Structure) Customer Class Water Rate Type Conserving Rate? (V) Total Revenue Comodity Charges (M) Total Revenue Fixed Carges 8 Single-Family Increasing Block Yes Multi-Family 8 Uniform Yes Commercial Uniform Yes Industrial Uniform Yes Institutional Uniform Yes Dedicated Irrigation Uniform Yes Calculate: V / (V + M) 68 % Implementation Option: Use Annual Revenue As Reported Use 3 years average instead of most recent year Canadian Water and Wastewater Association Upload file: Agency Provide Sewer Service: Yes Customer Class Rate Type Conserving Rate? Single-Family Non-Volumetric Flat Rate No Multi-Family Non-Volumetric Flat Rate No Commercial Non-Volumetric Flat Rate No Industrial Non-Volumetric Flat Rate No Institutional Non-Volumetric Flat Rate No At Least As effective As No Exemption No Comments:
165 CUWCC BMP Coverage Report 2013 Foundational Best Management Practices For Urban Water Efficiency BMP 2.1 Public Outreach ON TRACK 6978 City of Folsom Retail Does your agency perform Public Outreach programs? The list of wholesale agencies performing public outreach which can be counted to help the agency comply with the BMP Regional Water Authority Amy Talbot, 5620 Birdcage St, Suite 180 Citrus Heights, CA, Yes The name of agency, contact name and address if not CUWCC Group 1 members Green Acres Nursery Did at least one contact take place during each quater of the reporting year? No p Public Outreach Program List Number General water conservation information 14 Messages 3 Total 17 Did at least one contact take place during each quater of the reporting year? Yes Number Media Contacts Number Television contacts 5 Radio contacts 6 News releases 13 Articles or stories resulting from outreach 8 Total 32 Did at least one website update take place during each quater of the reporting year? No Public Information Program Annual Budget Annual Budget Category Annual Budget Amount Regional City of Folsom Total Amount: Description of all other Public Outreach programs Public education programsecolandscape California - supports the Green Gardener for professional landscapers Comments:
166 CUWCC BMP Coverage Report 2013 Foundational Best Management Practices For Urban Water Efficiency BMP 2.1 Public Outreach ON TRACK At Least As effective As No Exemption No 0
167 CUWCC BMP Coverage Report 2013 Foundational Best Management Practices For Urban Water Efficiency BMP 2.2 School Education Programs ON TRACK 6978 City of Folsom Retail Does your agency implement School Education programs? Yes The list of wholesale agencies performing public outreach which can be counted to help the agency comply with the BMP Regional Water Authority Amy Talbot 5620 Birdcage St, Suite 180 Citrus Heights, CA, Materials meet state education framework requirements? A student newspaper supplement called Be Water Smart News, Water, the Never Ending Cycle is geared towards K-8th grades. An updated Be Water Smart News teacher s guideis based on the California Content Standards. Materials distributed to K-6? Yes The student newspaper supplement, Water, the Never Ending Cycle is distributed by the Sacramento Bee to all (K-12). A colorful California Waterways Map provided by the California Department of Water Resources to grades 4-8 Yes Materials distributed to 7-12 students? Yes (Info Only) The colorful student newspaper supplement called Living Rivers of the Sacramento Valley is distributed by the Sacramento Bee to all (9-12) teachers that have subscribed for this particular water supplement Annual budget for school education program: Description of all other water supplier education programs The City of Folsom staff has been trained as "Get WET" training facilitators and offers the training to the local school district Comments: At Least As effective As No Exemption No 0
168 CUWCC BMP Retail Coverage Report 2014 Foundational Best Managemant Practices for Urban Water Efficiency 6978 BMP 1.1 Operation Practices City of Folsom ON TRACK 1. Conservation Coordinator provided with necessary resources to implement BMPs? Name: Title: Don Smith Water Management Coordinator 2. Water Waste Prevention Documents WW Document Name WWP File Name WW Prevention URL WW Prevention Ordinance Terms Description Option A Describe the ordinances or terms of service adopted by your agency to meet the water waste prevention requirements of this BMP. Option B Describe any water waste prevention ordinances or requirements adopted by your local jurisdiction or regulatory agencies within your service area. Option C Describe any documentation of support for legislation or regulations that prohibit water waste. Option D Describe your agency efforts to cooperate with other entities in the adoption or enforcement of local requirements consistent with this BMP. Option E Describe your agency support positions with respect to adoption of legislation or regulations that are consistent with this BMP. Option F Describe your agency efforts to support local ordinances that establish permits requirements for water efficient design in new development. Copy1_of_13.26_Water_C onservation_ordinance_ DOC com/ca/folsom/#!/folsom 13/Folsom1326.html# The City of Folsom has adopted and actively enforces Folsom Municipal Code 13.26, including prohibitions against the wasteful use of water. The City of Folsom has coordinated with other agencies to standardize language for drought stages At Least As effective As No
169 CUWCC BMP Retail Coverage Report 2014 Foundational Best Managemant Practices for Urban Water Efficiency BMP 1.1 Operation Practices ON TRACK Exemption Comments: No

170 CUWCC BMP Coverage Report 2014 Foundational Best Management Practices For Urban Water Efficiency BMP 1.2 Water Loss Control ON TRACK 6978 City of Folsom Completed Standard Water Audit Using AWWA Software? AWWA File provided to CUWCC? Yes Yes 2014 AWWA Water Audit Final.xls AWWA Water Audit Validity Score? 85 Complete Training in AWWA Audit Method Complete Training in Component Analysis Process? Component Analysis? Repaired all leaks and breaks to the extent cost effective? Locate and Repar unreported leaks to the extent cost effective? Yes Yes Yes Yes Yes Maintain a record keeping system for the repair of reported leaks, including time of report, leak location, type of leaking pipe segment or fitting, and leak running time from report to repair. Yes Provided 7 Types of Water Loss Control Info Leaks Repairs Value Real Losses Value Apparent Losses Miles Surveyed Press Reduction Cost Of Interventions Water Saved (AF) False At Least As effective As No Exemption No Comments: