Non-deal roadshow presentation
|
|
|
- Gervase Blair
- 5 years ago
- Views:
Transcription

1 Non-deal roadshow presentation 1
2 Compliance statements Disclaimer This presentation contains forward looking statements that are subject to risk factors associated with oil, gas, geothermal and related businesses. It is believed that the expectations reflected in these statements are reasonable but they may be affected by a variety of variables and changes in underlying assumptions which could cause actual results or trends to differ materially, including, but not limited to: price fluctuations, actual demand, currency fluctuations, drilling and production results, reserve estimates, loss of market, industry competition, environmental risks, physical risks, legislative, fiscal and regulatory developments, economic and financial market conditions in various countries and regions, political risks, project delays or advancements, approvals and cost estimates. All references to dollars, cents or $ in this presentation are to Australian currency, unless otherwise stated. References to Beach may be references to Beach Energy Limited or its applicable subsidiaries. Unless otherwise noted, all references to reserves and resources figures are as at 30 June 2013 and represent Beach s share. Competent Persons Statement The reserves and resources information in this presentation is based on, and fairly represents, information and supporting documentation prepared by, or under the supervision of, Mr Tony Lake (Reservoir Engineering Manager). Mr Lake is an employee of Beach Energy Limited and has a BE (Mech) degree from the University of Adelaide and is a member of the Society of Petroleum Engineers (SPE). The reserves and resources information in this presentation has been issued with the prior written consent of Mr Lake in the form and context in which it appears. 2

3 General overview 3

4 Beach Energy A company that puts safety, people and the environment first Global oil and gas explorer and producer with unrivalled cash generation amongst its peer group Prudent portfolio manager Will seek to. Deliver consistent superior shareholder returns Maintain growth in its high margin oil business Leverage the Australian east coast market to build a long-term profitable gas business A unique and growing company focused on shareholder return 4

5 Key facts ASX 100 company with a market capitalisation of ~A$2.0 billion 1 Largest Cooper Basin oil producer, sixth largest in Australia Strong balance sheet with cash of $404 million 2 Undrawn secured debt facility of A$300 million Record HY14 sales revenue, oil production and underlying NPAT Fully funded capex program primarily focused on the Cooper Basin 1. As at 27 February As at 31 December

6 Australian focused Largest onshore oil producer in Australia with world class margins Strategically positioned as an independent upstream gas producer Gas markets transitioning to higher prices/oil linked contracts Strong financial position provides optionality Continued focus on the Cooper Basin for growth opportunities Building for the future with active and focused capex program 99% of production and ~90% of capital expenditure focused on Australia 6

7 Australian onshore oil production Australia s largest onshore oil producer, with a strong inventory of Cooper Basin oil discoveries coming on-line in FY15 Sources: Recent half year and quarterly publicly available company information 7

8 Sources and uses of funds Sources and uses of funds assumptions: $404 million cash balance (as at 31 December 2013) Secured $300 million debt facility Operating cash flow forecast includes minimal exploration success Chevron Stage 2 funds received Capex forecast has no material acquisitions/divestments/or other farm-outs Oil price of A$110/bbl Forecast FY14/FY15 capex program anticipated to be fully funded 8
9 Operational overview 9


10 Reserves and contingent resources 2P: 93 MMboe 2P and 2C: 542 MMboe Gas and gas liquids 71 MMboe Oil 22 MMbbl 2P reserves 93 MMboe Unconventional Gas and gas liquids 319 MMboe Oil 17 MMbbl Conventional Gas and gas liquids 113 MMboe Large reserve and resource base driving production growth profile 10
11 Cooper Basin acreage Prolific gross acreage position of over 56,000 km 2 generating 98% of current production 11

12 FY14 Half year operating results Production for HY14 of 5.0 MMboe, up 25% Production mix: 47% gas and gas liquids, 53% oil Cooper Basin oil production up 59% due to: Development, appraisal and exploration success Flowlines remaining at maximum available capacity for the period 58 wells drilled, with: 86% overall success rate 71% exploration/appraisal success 6.6 MMboe Gas* 4.5 MMboe (26 PJe) Oil 2.1 MMbbl Actual and forecast production 7.5 MMboe Gas* 4.7 MMboe (27 PJe) Oil 2.8 MMbbl 8.0 MMboe Gas* 4.3 MMboe (25 PJe) Oil 3.7 MMbbl 9.6 MMboe to 9.2 MMboe Gas* 2.4 MMboe to 2.1 MMboe (12-14 PJe) HY14 Gas* 2.3 MMboe (13 PJe) Oil 2.3 MMbbl to 2.2 MMbbl HY14 Oil 2.6 MMbbl Continued production growth expected over the coming years * Gas and gas liquids 12
13 FY14 Revised capital expenditure guidance DEVELOPMENT Capex ($ million) Wells Seismic Potential recovery additions* 2D km 3D km 2 MMboe Cooper Basin non-sacb JV Cooper Basin SACB/SWQ JV International 10 4 Total Development Up to 67 EXPLORATION Cooper Basin non-sacb JV Cooper Basin SACB/SWQ JV 10 5 Unconventional International , New Ventures and Other Total Exploration Up to , TOTAL Up to , * Sum of best estimates of prospective resources. Recognise these are undiscovered and may require further work to mature to reserves 13
14 Key activities 14

15 Western Flank Cooper Basin 15

16 The Western Flank High net back for oil and wet gas Quick drill and tie-in High flow rates Excellent understanding of the geology Established infrastructure 250 kilometres of flowlines 10 facilities and five trucking points 40 oil wells on production 1,200 km 2 of 3D seismic Operated drilling to 30 June: One development well Up to twelve exploration/appraisal wells Largest oil producer in the Cooper Basin and sixth largest in Australia 16
")
17 Average Western Flank net production Last eight months in excess of net 10,000 boepd from the Western Flank (to date) 17
 Five exploration/appraisal wells and one development well remaining for FY14 Estimated FY14 net capex $27 million Active exploration, appraisal")
18 PEL 91 Beach 40% and operator, Drillsearch 60% Current gross production ~12,000 bopd, with further wells to be tied-in Successful appraisal wells have increased recovery: Bauer-12 Chiton-3 Three new fields expected on-line (Congony, Sceale, Kalladeina) Five exploration/appraisal wells and one development well remaining for FY14 Estimated FY14 net capex $27 million Active exploration, appraisal and development activity to continue to drive production 18
 of 2P reserves Currently producing from eight wells Bauer-9, -10 and -11 completed and available to come on-line Bauer facility expansion planned for completion in Q2 2014 Bauer to")
19 The Bauer oil field Bauer-12 appraisal well intersected a nine metre oil column: Four metres of McKinlay Member Five metres of Namur Sandstone Added 2.5 MMbbl (gross) of 2P reserves Currently producing from eight wells Bauer-9, -10 and -11 completed and available to come on-line Bauer facility expansion planned for completion in Q Bauer to Lycium flowline at capacity, with seven trucks transporting excess oil Bauer-13 development well currently being drilled Bauer is the largest oil field discovered to date on the Western Flank 19

20 PEL 92 Beach 75% and operator, Cooper Energy 25% Current gross production ~6,000 bopd Callawonga-7 and -8, Windmill-1 and -2 development wells on-line, production add of ~700 bopd Three/four exploration wells planned for Q Interpretation of Irus and Caseolus 3D seismic data ongoing, with first wells drilled on new surveys expected Q Estimated FY14 net capex of $31 million Active exploration drilling campaign for the remainder of FY14 20

21 PEL 104 and PEL 111 Beach 40%, Senex 60% and operator Focus on the Birkhead Formation Gross production of ~4,300 bopd from Growler and Snatcher fields Anticipated program of 18 wells, of which 13 to be exploration/appraisal Further appraisal drilling at Spitfire and Mustang proposed Exploration prospects expected to be generated from 3D Lignum seismic survey Estimated FY14 net capex $27 million Up to eighteen further wells for the remainder of the financial year 21
 and ~1,000 bbls per day LPG and condensate Three exploration wells planned for late 2014, early 2015 Estimated FY14 net capex of $9 million Liquids rich")
22 PEL 106 Beach 50% and operator, Drillsearch 50% Commercial discussions successful in establishing extended gas sales to March 2016 Liquids rich Canunda field operational since July 2013 Gross flow rate of ~12 MMscfd (~7 TJ per day sales gas) and ~1,000 bbls per day LPG and condensate Three exploration wells planned for late 2014, early 2015 Estimated FY14 net capex of $9 million Liquids rich Beach operated gas and gas liquids production 22

23 Eastern Australian gas market 23

24 Prolific acreage strategically located Multi-basin portfolio to feed eastern Australian markets 24

25 Eastern Australian gas markets Strong predicted growth in Eastern Australian gas and Asian LNG demand Gladstone based export LNG projects have transformed the east coast gas market Projected gas supply is tight and demand strong The bulk of non-lng demand is yet to be contracted Upward pricing trajectory confirmed by recent contracts and market commentary Eastern Australia total gas demand scenarios (PJ) CBA Energy Research prediction for 2014: East Coast Gas prices spike above $13/GJ with Gladstone LNG projects hoovering up supply to fill facility LNG capacity shortfall Source: ACIL Allen,

26 Upstream and downstream dynamics Equity molecules to equity projects Suppliers creating new markets via downstream investments Vertical integration driven by both domestic and export opportunities Depending on volume and deliverability, supply likely to underwrite equity projects as a priority Strong drivers for LNG participants to fill ramp-up wedge capacity and position for future expansion Beach well placed as an independent upstream producer with exposure to oil linked gas pricing without LNG capital outlay Source: Logos sourced from company websites 26


27 Recent gas related transactions Origin Gas Sales Agreement Signed April PJ over eight years, potential to extend to 173 PJ over ten years Commencement date window for supply is July 2014 to June 2015 Price incorporates a combination of an oil linked curve and other parameters PEL 106 SACB JV Raw Gas Sales Agreement Signed March 2013 Minimum of 10 Bcf Nappamerri Trough Natural Gas Signed February 2013 PEL 218 and ATP 855 $349 million of potential payments to Beach Source: Logos sourced from company websites Beach is positioned for future growth, and leading change on the east coast with: - High value opportunities - Quality counterparties - Diversified options 27

28 SACB JV and SWQ JVs Conventional gas 28
 and 20-40% in the South West Queensland JVs (SWQ JVs) Gross area covered by various joint ventures ~26,800 km 2 (~6.")
29 SACB JV and SWQ JVs Significant acreage with substantial reserves base 20.21% in the South Australian Cooper Basin Joint Venture (SACB JV) and 20-40% in the South West Queensland JVs (SWQ JVs) Gross area covered by various joint ventures ~26,800 km 2 (~6.6 million acres) Joint ventures include: ~6,000 km of flowlines Primary processing and transportation facilities Upside from shale and basin centred gas plays Operator targeting 30% production growth by

30 Moomba processing facility Strategically located expandable facility Current daily capacity approximately: 300 TJ gas 35 kbbl oil/condensate 600 tonnes LPG Substantial gas storage system with capacity ~70 PJ Gas supplied directly into New South Wales, Queensland and South Australian markets Further processing capacity at Ballera >200 TJ per day The key processing point for Cooper Basin and Eromanga Basin oil and raw gas 30

31 SACB JV gas growth project Drilling, including multi-well pad drilling, with five rigs operating SIMOPS approach to fracture stimulation 30% production growth to 2015 leads to step-change in cost reductions Production costs reduction target of 30%, to ~$9/boe, by 2015 Maintenance strategies successfully delivering record downtime levels leading to production benefits Extracting more gas from existing fields Source: Derived from Santos 31
 Well delivery reduced from 34 to 16 days 72 fracture")

32 Cowralli multi-well pad drilling Multiple wells drilled from closely spaced surface locations 16 Cowralli wells drilled from two pads, completed in October % reduction in average drilling and fracture stimulation costs over the campaign (versus historical Cooper Basin) Well delivery reduced from 34 to 16 days 72 fracture stimulation stages across 18 full operational days, 4.3 stages per day: Costs significantly under budget and under historical averages 40% reduction in time over 16 wells Current Big Lake drilling also utilising these methodologies, with up to five wells per pad Key technical and operational learnings will be used in upcoming multi-well campaigns 32

33 Unconventional gas Cooper Basin 33
34 Unconventional positioning Strategically targeted three key basins for unconventional acreage Cooper Basin activity: Nappamerri Trough Natural Gas with Chevron and Icon SACB JV unconventional REM and BCG plays Otway and Bonaparte Basins targeting gas and gas liquids All basins proximal to infrastructure and markets Gas demand trending upward Positioned to fuel growing northern and eastern gas markets 34

35 The unconventional learning curve 1 Resource potential 2 Exploration phase 3 Continued appraisal 4 Pilot projects 5 Development 35
36 Learning curve reference stages 1. Confirmation of resource potential Prove gas saturated target zones Establish ability to fracture stimulate Establish ability to flow gas from target zone Initial volumetric estimates and resource booking 2. Vertical and horizontal exploration phase Geographically and vertically delineate target zones Build conceptual geological models Experiment with different stimulation techniques Increase resource booking with new wells Gain information on subsurface fracture stimulation Gain preliminary information on deliverability 3. Continued appraisal Determine production variability Build resource confidence Potential small scale pilot 4. Pilot projects Stepwise optimisation: Refine well design and stimulation Build deliverability Scale efficiencies Targeted development 5. Development Ongoing optimisation Competitive services Infrastructure expansion 36

37 The keys to unconventional success Well profiles the key focus on all projects Uncovering sweet spots with focused activity around them Process improvements and technology to drive efficiencies Costs to be driven down by efficiencies and scale Gas pricing trending upward The right partnerships with the relevant expertise Estimated ultimate recovery per well the key for commerciality 37

38 SACB JV Unconventional gas 38

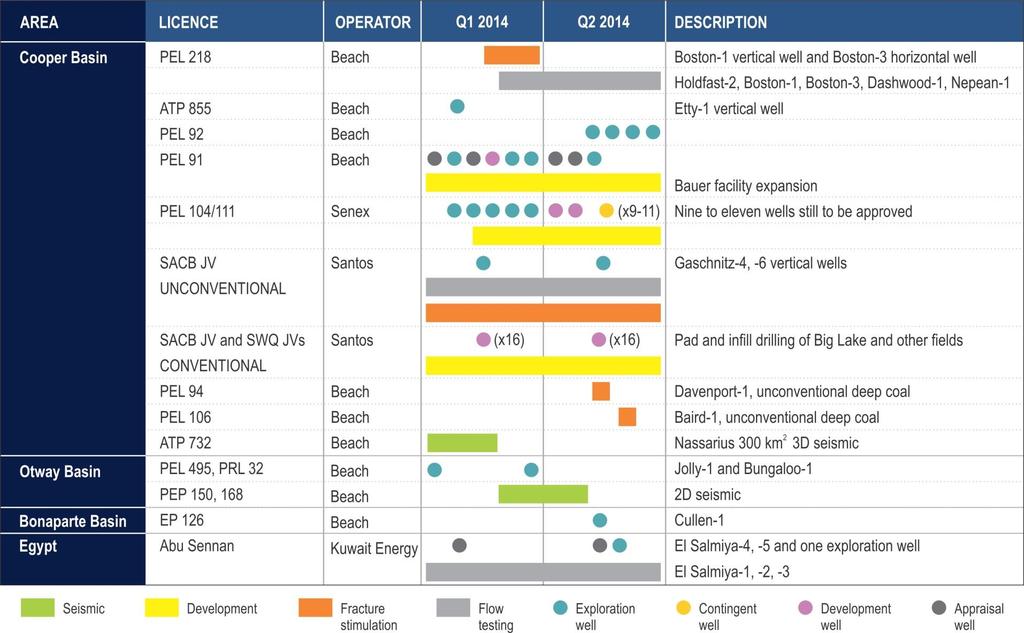
39 SACB JV unconventional program 39

40 REM play Targeting the Roseneath Shale, Epsilon Formation, Murteree Shale and Patchawarra Formation Moomba-191 flowing at ~2 MMscfd for more than 12 months Roswell-1, Moomba-192 and -194 vertical wells fracture stimulated and flow tested Roswell-2 and Moomba-193 ST1 horizontal wells currently drilling Moomba-195 horizontal deferred, awaiting results from Moomba-193 and Roswell-2 Unconventional resources that can be quickly monetised 40

41 BCG play Gaschnitz-1 ST1 vertical well: Seven zone stimulation, produced at ~1 MMscfd Shut-in, awaiting completion Van der Waals-1 targeting lower Patchawarra, delayed by operational issues Langmuir-1 fracture stimulated 2014 pilot production initiation with up to four shallow vertical wells: Connection to SACB JV gathering system if results are promising Locations of wells subject to results from Gaschnitz-1 ST1, Van der Waals-1 and Langmuir-1 Strong connection to Beach operated NTNG wells in Nappamerri Trough Benefit of access to full information set Testing the western margins of the Nappamerri Trough 41

42 Nappamerri Trough Natural Gas 42

43 Nappamerri Trough Natural Gas A staged and methodical exploration and appraisal program Delineation of a significant untapped resource Multiple formations present Aerially extensive with permits covering more than 800,000 acres In excess of 1,000 metres of gas saturated section Process takes time and each piece of information important Moving up the learning curve Flow test of up to five PEL 218 wells expected in 1H 2014 Net 1.3 Tcf of 2C resource booked at 30 June 2013 in PEL 218 and ATP 855 Permian section equity interests: PEL 218 (Beach 70% and operator, Chevron 30%) and ATP 855 (Beach 46.9% and operator, Chevron 18%, Icon Energy 35.1%) 43

44 NTNG wells 44

45 Exploration concept 45

46 Exploration and appraisal cross section Note: Well locations are approximate only and may have been shifted to show their correct structural position on the cross section 46

47 Holdfast-2 update Holdfast-2 drilled laterally into the Murteree shale Fracture stimulation completed over nine stages Stimulation monitored by surface microseismic tools Testing different fracture stimulation approaches to increase understanding of formation response to: Change in fluid types Different stage volumes Perforation/jetting options Completion tubing in place, flow testing commenced New technology applied to optimise future stimulation design 47


48 The Boston program Two fracture stimulation stages completed at Boston-1, with a shallow technical issue Reviewing options including flow testing Boston-3 horizontal well drilled in the lower Murteree Shale Boston-3 fracture stimulation commenced, 10 stages planned Boston project aims to increase understanding of: Sand body continuity and quality Well spacing Fracture geometry Stimulated rock volume Optimal fracture spacing Tiltmeters Horizontal well to be stimulated Monitoring well Vertical well to be stimulated Boston area has strong gas shows, good reservoir quality and is in close proximity to raw gas line 48

49 Other Australia 49

50 Bonaparte Basin EP 126, 138 (Beach earning up to 90%) EP 135, NTC/P10 (Beach earning up to 55%) ~6,500 km 2 high resolution airborne gravity and magnetic survey acquired, processed and interpreted Ensign 965 rig to be mobilised end of March Cullen-1 anticipated spud date early May, two to three months drilling time estimated Undeveloped Weaber gas field evidence of hydrocarbon presence Underexplored with conventional and unconventional oil and gas targets 50

51 Cooper Basin Eastern Flank ATP 732 (Beach earning 50%, Bengal 50%) Located between the Jackson (~50 MMbbl of oil produced) and the Kenmore/Bodalla (~20 MMbbl of oil produced) fields ~300 km 2 Nassarius 3D seismic survey completed Targeting conventional oil reservoirs Location of next well to be based on interpreted Nassarius 3D seismic data Hydrocarbon shows in previous wells drilled The potential for a new oil fairway, located in an underexplored area between two prolific Cooper Basin oil fields 51

52 Otway Basin PELs 494 and 495 (Beach 70% and operator, Cooper Energy 30%) Jolly-1 vertical exploration well at ~3,800 metres and coring Exploring the lower Sawpit shale and Casterton Formation in the Penola Trough Targeting both oil and gas The Bungaloo-1 vertical exploration well to follow Jolly-1 Existing infrastructure and a history of producing fields, targeting unconventional gas and liquids 52
53 International 53

54 International operations Provides long-term growth options Targeted and disciplined approach to key attributes: Technical Commercial Risk/reward proposition Capital allocation Focused on early entry step change opportunities Bias for oil and high price gas markets Romania Offshore oil and gas Favourable fiscal regime Tanzania Farm-out pending 18 prospects and leads from 2D seismic Key global operations Egypt Production growing Exploration upside Recent major discovery New Zealand 3D seismic pending Offshore gas targets 54

55 Egypt Country status Recent history of political volatility and unrest Business as usual from an operations standpoint Growth potential Targeting material oil prospects Abu Sennan success with El Salmiya wells Beach value add Sharing of geological and operational core skill set Balanced portfolio of assets with growing oil production 55

56 Abu Sennan Concession Beach 22%, Kuwait Energy 50% and operator, Dover Investments 28% El Salmiya-2, tested a new reservoir zone at ~3,500 bopd El Salmiya appraisal program in progress: El Salmiya-3 flow tested from the Abu Roash C formation at ~4,800 bopd El-Salmiya-4 currently drilling ahead Four further El Salmiya appraisal wells planned Existing wells have upside exploration targets EPTs currently choked back and producing at ~1,000 bopd (gross) 55% exploration success to date 56

57 Abu Sennan trap geometry 101 Further appraisal wells to address potential upside 57

58 Tanzania Lake Tanganyika South Block Beach 100% Block area ~7,200 km 2 Natural oil seeps indicate a working petroleum system 2,080 kilometre 2D seismic survey completed in August 2012 Extensive structuring confirmed, similar to Lake Albert in Uganda Indications of hydrocarbons over tilted fault blocks, low-side rollovers and mounded features Farm-out process commenced A significant acreage position in the prospective East African Rift 58

59 Romania Est Cobalcescu block Beach 30%, PetroCeltic 40% and operator, Petromar 30% ~1,000 km 2 with 3D seismic coverage Water depth <100 metres ExxonMobil deep water block Domino discovery Two further exploration wells planned in the next 12 months Newly available acreage with proven petroleum systems and multiple targets 59
60 Appendices 60

61 Cooper Basin acreage 61
62 Chevron transaction summary Subject to joint venture approvals, the key work program elements envisaged across the two permits involve an initial exploration program to be followed by pilot production programs PEL 218 potential payments Stage 1 (initial 30%) (1) US$36 million cash US$95 million carry Stage 2 (additional 30%) (2) US$41 million cash US$47 million carry ATP 855 potential payments Stage 1 (initial 18%) US$59 million cash Stage 2 (additional 18%) (2) US$36 million cash Commitment bonus payment of US$35 million (1) Vertical wells exclude Holdfast-1 and Encounter-1 (2) Permian section equity interests post stage 2 farm-in would be: PEL 218 (Beach 40%, Chevron 60%) and ATP 855 (Beach 28.9%, Chevron 36%, Icon Energy 35.1%) Note: Chevron has the option to continue or withdraw at the end of each stage US$349 million of potential payments to Beach over several years 62
63 SACB JV unconventional and infill Moomba wells - nomenclature Current Well Name Previous Well Name Purpose Status Roswell 1 Roswell 1 Vc 50 coal, REM, Microseismic Flowing from Vc 50 post frac Roswell 2 Roswell 2 Horizontal Roseneath Shale ' Spud 12 Oct Moomba 192 Aurora 1 Vertical REM, Microseismic Status being reviewed on Patch gas Moomba 193 Aurora 2 Horizontal Murteree Shale After Roswell 2 Moomba 194 Fortuna 1 Vertical REM and Patch, Microseismic C & S 7 Oct REM Frac Moomba 195 Fortuna 2 Horizontal Murteree Shale After Moomba 193 Moomba 196 Moomba North 30 Vertical Gas Development Spud 16 Oct Moomba 197 Moomba North 44 Vertical Gas Development After Moomba 196 Moomba 198 Moomba North 46 Pad Well Gas Development Spudded 9 Oct Moomba 199 Moomba North 45 Pad well Gas Development After Moomba 198 Moomba 200 Moomba North 47 Pad well Gas Development After Moomba 199 Moomba 201 Moomba North 48 Pad well Gas Development After Moomba 200 Moomba 202 Moomba South 55 Vertical Gas Development After Moomba 197 Moomba 203 Moomba 203 REM and Patch 1Q 2014 Possible replacement for M
487 173 244 Email: chris.jamieson@beachenergy.com.")
64 Contact Information Head office 25 Conyngham Street Glenside SA 5065 Tel: Fax: Website: Chris Jamieson General Manager Investor Relations Tel: Mob: (0) chris.jamieson@beachenergy.com.au 64