Regional Water Quality NEWSLETTER DATE: Report for November 2017 A Tempe, Glendale, Peoria, Chandler, Phoenix, ADEQ, CAP, SRP, Epcor NSF Central
|
|
|
- Baldwin Cobb
- 5 years ago
- Views:
Transcription


1 Regional Water Quality NEWSLETTER DATE: Report for November 2017 A Tempe, Glendale, Peoria, Chandler, Phoenix, ADEQ, CAP, SRP, Epcor NSF Central Arizona-Phoenix Long-Term Ecological Research ASU Regional Water Quality Partnership 1
2 SUMMARY 1. Taste and Odor compounds were below or near detection limits (2 ng/l) in all canal and water treatment plant samples. Quarterly reservoir samples were all below threshold odor detection levels (10 ng/l). The reservoirs turned over last month and the impact of previous algal blooms has dissipated. The extremely high levels observed last month were primarily due to the algal bloom on Saguaro Lake combined with the operation of Stewart Mountain Dam. The turbines were under maintenance and the water was being released from the spillway. Therefore, the warm algal rich epilimnion water was directly flowing in the Salt River resulting in both high algal levels and warmer water in the river and subsequent canals. The central water quality laboratory at ASU will be getting a new triple quadropole mass spectrometer in January. This should allow us to return to consistent and timely taste and odor compound analysis. 2. DOC values for Saguaro Lake and Bartlett Lake ranged from 4.3 to 5.1 mg/l which was consistent with October and most quarterly reservoir samples were in this range. DOC concentrations ranged from mg/l in canals and at the inlets of water treatment plants which was also consistent with October. 3. Reservoir releases were primarily from Bartlett at the time of sampling. CAP water and groundwater use remained at approximately 15% of the water supply. Lake Pleasant releases have stopped so the CAP water is river water. 4. Microbial concentrations for coliforms continued to decrease as compared to October and most values are now within historic norms. Mycobacterium concentrations remained low with the majority of samples being non-detects. 1
3 Microbial Water Quality Data Over the years the regional water quality center has collected data on numerous different topics but very little data has been collected on basic microbial water quality. Therefore, we have initiated microbial sampling for E. Coli, total coliforms and mycobacterium in the canal system to determine potential impacts on both water quality and sources of possible contamination. Note that Mycobacterium samples require one month to process so they are from the previous month All Values are cfu per 100 ml - November 6 th -7th Sample E. coli Coliform Blank Average 0 0 AZ Canal at Highway 87 average South Canal below CAP Cross- connect average Cap Canal at Cross-connect average AZ Canal at 56th St. average AZ Canal- Central Avenue average Pima Average AZ Canal above CAP Cross-connect average Waddell Canal average Verde Beeline average AZ Canal below CAP Cross-connect average head of the Consolidated Canal average Middle of Consolidated Canal average Head of Tempe Canal average Mycobacterium (October) colonies 0 AZ Canal at Highway 87 0 South Canal below CAP Cross- connect 17 Cap Canal at Cross-connect 0 AZ Canal at 56th St. 6 AZ Canal- Central Avenue 3 AZ Canal at Pima 0 AZ Canal above CAP Cross-connect 0 Waddell Canal 0 Verde Beeline 18 AZ Canal below CAP Cross-connect 2 head of the Consolidated Canal 1 Middle of Consolidated Canal 1 Head of Tempe Canal 1 CONT Contaminated with other bacteria 2
 ** 8 cfs 460 cfs into Arizona 3.0 mg/l Canal 814 cfs 356 cfs into South Canal 3.")
4 Quick Update of Water Supplies for November 6th, 2017 (during day of canal/wtp sampling November 6th, 2017) Source Trend in supply Discharge to water supply system Salt River Verde River Reservoirs at 64% full Reservoirs At 48% full Flow into SRP Canal System Dissolved organic carbon Concentration (mg/l) ** 8 cfs 460 cfs into Arizona 3.0 mg/l Canal 814 cfs 356 cfs into South Canal 3.7 mg/l 108 cfs of CAP water into Arizona Canal Colorado River Lake Pleasant is 64.7% full (Lake Powell is 59.3% full) Lake Pleasant is* releasing 0 cfs Groundwater Pumping *** 108 cfs pumping by SRP *CAP is not releasing from Lake Pleasant **Concentration of DOC in the terminal reservoir ***CAP water is being delivered to the Arizona Canal. 77 cfs Groundwater Pumping into SRP Canals 2.5 mg/l 0.5 to 1 mg/l Data from the following websites:


5 The following views are from SRP website, and show which wells are operating along the various canals. 4
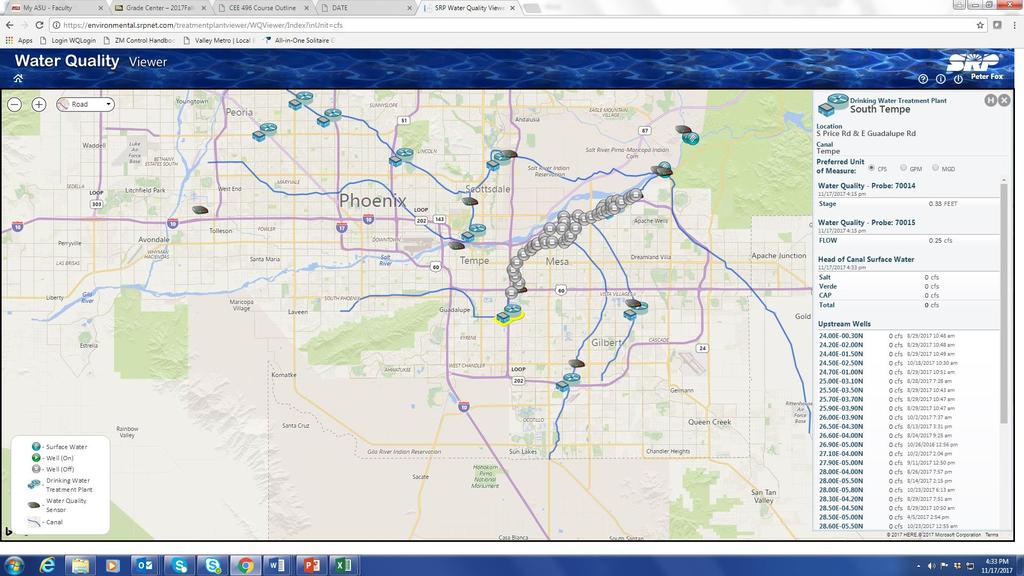
6 5
7 Dissolved Organic Carbon in Reservoirs and Treatment Plants DOC = Dissolved organic carbon UV254 = ultraviolet absorbance at 254 nm (an indicator of aromatic carbon content) SUVA = UV254/DOC TDN = Total dissolved nitrogen (mostly nitrate from groundwater) Reservoir Samples - November 6th-7th, 2017 Sample Description Location DOC (mg/l) UV254 (l/cm) SUVA (L/mgm) TDN (mg/l Havasu (October) Lake Pleasant (October) Epilimnion Hypolimnion Verde River at Tangle N/A N/A #VALUE! N/A Verde River at Beeline Highway Bartlett Reservoir Saguaro Lake Salt River Epilimnion Hypolimnion Epilimnion Epi - Duplicate Hypolimnion at Blue Point Bridge Salt River above Roosevelt N/A N/A #VALUE! N/A Roosevelt Reservoir Point 1 Roosevelt Reservoir Point 2 Apache Reservoir Point 1 Apache Reservoir Point 2 Canyon Reservoir Point 1 Canyon Reservoir Point 2 Epilimnion N/A Hypolimnion N/A Epilimnion N/A Hypolimnion N/A Epilimnion N/A Hypolimnion N/A Epilimnion N/A Hypolimnion N/A Epilimnion N/A N/A N/A N/A Hypolimnion N/A N/A N/A N/A Epilimnion N/A N/A N/A N/A Hypolimnion N/A N/A N/A N/A 6
8 Water Treatment Plants- November 6th-7th, 2017 Sample Description DOC (mg/l) UV254 (l/cm) SUVA (L/mg-m) TDN (mg/l Union Hills Inlet Union Hills Treated Tempe North Inlet Tempe North Plant Treated Tempe South Inlet N/A N/A #VALUE! N/A Tempe South Plant Treated N/A N/A #VALUE! N/A Greenway WTP Inlet Greenway WTP Treated Glendale WTP Inlet Glendale WTP Treated Anthem WTP Inlet Anthem WTP Treated th Street WTP Inlet th Street WTP Treated N/A N/A #VALUE! N/A Chandler WTP Inlet Chandler WTP Treated Rivers and Canals- November 6th-7th, 2017 Sample Description DOC (mg/l) UV254 (l/cm) SUVA (L/mg-m) TDN (mg/l Waddell Canal Anthem WTP Inlet Union Hills Inlet CAP Salt-Gila Pumping Station (October) CAP Mesa Turnout (October) CAP Canal at Cross-connect Salt Blue pt. Bridge Verde Beeline AZ Canal above CAP Cross-connect AZ Canal below CAP Cross-connect AZ Canal at Highway AZ Canal at Pima Rd AZ Canal at 56th St AZ Canal - Central Avenue AZ Canal - Inlet to Glendale WTP AZ Canal - Inlet to Greenway WTP South Canal below CAP Cross-connect Head of Tempe Canal
9 Tempe Canal - Inlet to Tempe's South Plant N/A N/A #VALUE! N/A Head of the Consolidated Canal Middle of Consolidated Canal Chandler WTP - Inlet
10 Taste and Odor MIB, Geosmin and Cyclocitral are compounds naturally produced by algae in our reservoirs and canals, usually when the water is warmer and algae are growing/decaying more rapidly. They are non toxic, but detectable to consumers of water because of their earthy-musty-moldy odor. The human nose can detect these in drinking water because the compounds are semi-volatile. Since compounds are more volatile from warmer water, these tend to be more noticable in the summer and fall. The human nose can detect roughly 10 ng/l of these compounds. Our team collects samples from the water sources and raw/treated WTP samples. Table 1 - Water Treatment Plants November 6, 2017 Sample Description MIB Geosmin Union Hills Inlet Union Hills Treated Tempe North Inlet Tempe North Plant Treated Tempe South WTP Tempe South Plant Treated Anthem Inlet Anthem Treated Chandler Inlet Chandler Treated Greenway WTP Inlet Greenway WTP Treated Glendale WTP Inlet Glendale WTP Treated 24th St. WTP Inlet 2.4 < <2.0 ns ns ns ns 2.3 <2.0 9
11 24th St. WTP Outlet ns ns Table 2 - Canal Sampling November 6, 2017 System Sample Description MIB Geosmin CAP Waddell Canal < Union Hills Inlet CAP Canal at Cross-connect Salt Blue Pt Bridge 2.6 <2.0 Verde Beeline 2.4 <2.0 AZ AZ Canal above CAP Crossconnect Canal AZ Canal below CAP Crossconnect AZ Canal at Highway 87 AZ Canal at Pima Rd AZ Canal at 56th St. AZ Canal - Central Avenue 2.6 <2.0 AZ Canal - Inlet to Glendale WTP Head of the Consolidated Canal 2.4 <2.0 Middle of the Consolidated Canal South South Canal below CAP Crossconnect Tempe Head of the Tempe Canal 2.4 <2.0 Canals Tempe Canal - Inlet to Tempe's South Plant ns ns Salt-Gila (Oct) Mesa Turnout (Oct) Table 3 - Reservoir Samples November 7, 2017 Sample Description Location MIB Geosmin Lake Pleasant (Oct) Epilimnion Lake Pleasant (Oct) Hypolimnion 7.0 <2.0 10
12 Verde Beeline 2.4 <2.0 Bartlett Reservoir Epilimnion 4.5 <2.0 Bartlett Reservoir Epi-near dock 4.1 <2.0 Bartlett Reservoir Hypolimnion 4.2 <2.0 Salt BluePt Bridge 2.6 <2.0 Saguaro Lake Epilimnion 3.7 <2.0 Saguaro Lake Epi - Duplicate 3.6 <2.0 Saguaro Lake Epi-near dock Saguaro Lake Hypolimnion 4.4 <2.0 Lake Havasu < Verde River at Tangle Creek Roosevelt at Salt River Inlet Table 4 - Quarterly Lake Sampling - November 7-8, 2017 Sample Description Site Location MIB ns ns ns ns Geosmin Roosevelt Lake Site 1A Epilimnion 4.9 <2.0 Roosevelt Lake Site 1B Hypolimnion 4.3 <2.0 Roosevelt Lake Site 2A Epilimnion 5.4 <2.0 Roosevelt Lake Site 2B Hypolimnion Apache Lake Site 1A Epilimnion Apache Lake Site 1B Hypolimnion Apache Lake Site 2A Epilimnion Apache Lake Site 2B Hypolimnion Canyon Lake Site 1A Epilimnion 3.8 <2.0 Canyon Lake Site 1B Hypolimnion 4.1 <2.0 Canyon Lake Site 2A Epilimnion 4.0 <2.0 Canyon Lake Site 2B Hypolimnion 11
13 12