Driving Khon-Kaen Province, Thailand, Towards LCC in the Context of GMS
|
|
|
- Leona Charles
- 5 years ago
- Views:
Transcription
1 Driving Khon-Kaen Province, Thailand, Towards LCC in the Context of GMS The 18 th AIM International Workshop Savitri Garivait, Penvadee Cheewapongphan, Awassada Phongphiphat, Agapol Junpen, Komsilp Wang-Yao, and Sirintorthep Towprayoon The Joint Graduate School of Energy and Environment, Center of Excellence of Energy Technology and environment, King Mongkut s University of Technology Thonburi 14 December 2012

 Administration Structure : 26 Districts and 198 Sub-districts Socio-Economics Structure : 2 nd")
2 Khon-Kaen Location Latitudes 15º21 5 N Longitudes 101º44 45 E Total Land 10, km 2 Climate Tropical climate under SW monsoon with dry zones Annual Temperature ºC (Average = 27.8ºC) Average Annual Precipitation 1,230 mm (131 days) Population (2010) 1,767,601 inhabitants females) Population Density (2010) inhabitants/km 2 (Top 22 nd of Thailand) Administration Structure : 26 Districts and 198 Sub-districts Socio-Economics Structure : 2 nd largest economy of the NE region GPP (2009) 143,806 Million Baht GPP/cap (2009) 76,385 Baht Khon Kaen
3 Towards LCSS for Khon-Kaen Motivation Khon Kaen has developed a roadmap of Khon Kaen towards Low Carbon City since 2009 to support Khon Kaen s Declaration on Climate Change Adaptation and Mitigation 2020 Khon Kaen s vision of LCS : To become the Low Carbon City of Greater Mekong Sub-region Khon Kaen s Socio-economic Development Plan : To become the 3H = Happiness Community, Healthy City, and Hub of GMS Vision Khon Kaen should be the Model of the GMS in Global Warming Reduction Through Participation of All Stakeholders Strategies 1. Reduce GHG Emissions 2. Raise Public and All Stakeholders Awareness to Implement Mitigation Actions 3. Develop Efficient System of Environmental Management 4. Increase Capacity in Getting Prepared to Face and Prevent Climate Change

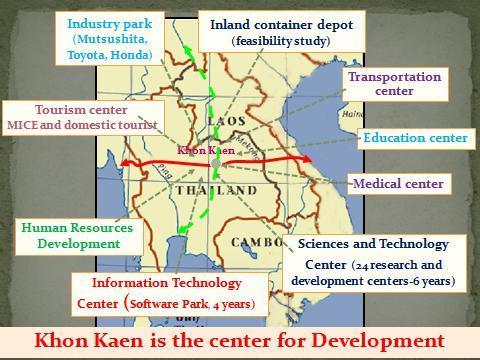
4 Khon Kaen s Vision

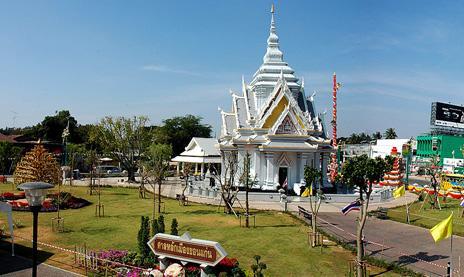

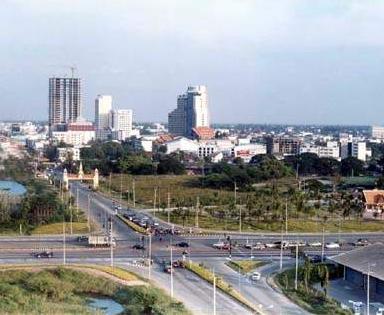
5 Khon-Kaen Attractions

6 Khon-Kaen Energy Consumption Khon Kaen s final energy consumption in 2008 was about ktoe including 68.6% of oil, 13.7% of renewable energy and 17.7% of electricity. Considering the final energy consumption classified by sector, 57.2% of the total or ktoe were from transportation sector, followed by industry, residential, commercial, and other sectors. Year Energy consumption (ktoe) Transportation Industry Residential Services Agriculture - Others
7 Gross Provincial Product (GPP) 143,806 Khon-Kaen Agriculture Agricultural land = about 1.12 Mha (or about 60.8% of Konkaen area). Main crop products : rice, sugarcane, cassava, soil bean. Livestock : cattle, swine, and poultry Industry Total = 1,368 factories including non-ferrous industry (208 factories), metal industry (202 factories), transportation industry (179 factories), food manufacturing (131 factories), agricultural industry (111 factories), machinery manufacturing (114 factories), saw mill and wood product (56 factories), and other (137 factories) In In 2009 Million Baht Agriculture 18,505 Agriculture, Hunting and Forestry 17,753 Fishing 753 Non-Agriculture 125,301 Mining and Quarrying 1,442 Manufacturing 54,565 Electricity, Gas and Water Supply 2,667 Construction 6,300 Wholesale and Retail Trade; Repair of Motor 20,470 Vehicles, Motorcycles and Personal and Household Goods Hotels and Restaurants 2,187 Transport, Storage and Communications 4,469 Financial Intermediation 4,460 Real Estate, Renting and Business Activities 2,791 Public Administration and Defence; Compulsory 6,871 Social Security Education 14,580 Health and Social Work 3,760 Other Community, Social and Personal Services 593 Activities Private Households with Employed Persons 146
8 Khon-kaen Approaching LCSS Top 3 of Economic Activities Unit: million baht GPP 97, , , , ,806 Manufacturing 31,255 43,341 45,394 51,174 54,565 Wholesale and Retail Trade 16,865 18,211 19,776 19,705 20,470 Agriculture and Forestry 11,030 12,920 14,786 15,618 17,753 Approach to Develop LCSS for Khon-kaen Source: NESDB Identification of sources and sinks of GHG in Khon-kaen Conduct GHG emission estimation/inventory including all key categories Projection of the emissions for BAU and Countermeasure Cases Assessment of undertaken countermeasures
")

9 Key sources and sinks of GHG in Khon-kaen 1. Energy sector Industry (Not yet completed due to lack of data) Transportation Other (Commercial/ Residential/etc.) 2. Agriculture sector Fermentation Manure management Rice Cultivation Open burning Agricultural soil 3. Land use change and Forestry sector
10 Khon-Kaen Transportation - Number and share of register vehicle in 2007 and 2008 Type Yr 2007 Yr 2008 Share (%) Vehicle Share (%) Vehicle Small passenger (< 7 person) , ,737 Passenger (> 7 vehicle) , ,042 Small truck , ,704 Motorcycle , ,281 Bus , ,137 Large truck , ,328 Small vehicle Total , ,286


11 Energy Sector Fuel consumption Transportation activity Source of data: Khon-kaen Energy Office


12 Emission CO 2 Energy Sector Transportation activity CO2 e from Transportation sector 1,600, ,600,000 1,400,000 1,200,000 1,000, , , , ,000 1,400, ,200, ,000, , , , , gasohol95 gasohol91 lpg Diesel b5 Diesel Diesel b2 ulg95 ulg91 gasohol E20 gasohol E LPG Gasoline Gas/Diesel Oil CO2 e by type of fuel
13 Energy Sector Energy consumption (Household/ Commercial/ Governmental activities) 600,000,000 Energy Consumption (kwh) 500,000, ,000, ,000, ,000, ,000,000 - * Household Commercial Government * Data until May, 2009 Source: Provincial Electricity Authority

14 Emission CO 2 -e Energy Sector Household/ Commercial/ Governmental activities 300,000 Emissions (t CO2-e) 250, , , ,000 50,000 * - * Household Commercial Government Ave. 959 kco 2 -e / household Ave. 17,420 kco 2 -e/ commerce Ave. 28,637 kco 2 -e/government * Data until May, 2009


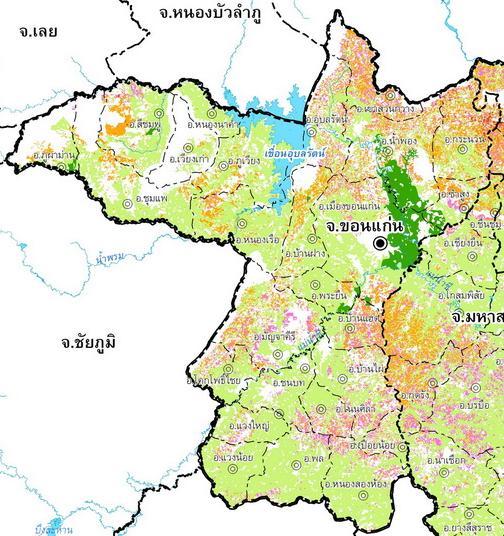
15 Land used in Khon-kaen Source of data: Land Development Department and Satellite Data
16 Removal CO 2 -Forestry Annual increase in biomass stocks due to biomass growth Annual increase in biomass Year Forest Area (ha) stocks due to biomass growth (tons C/year) Annual increase in biomass stocks due to biomass growth ( tons CO 2 /year) , ,091 2,215, , ,091 2,215, , ,754 1,663, , ,692 2,118, , ,692 2,118, , ,692 2,118, , ,343 2,157, , ,343 2,157, , ,813 2,034, , ,343 2,157,258 Source of data: Land Development Department and Satellite Data
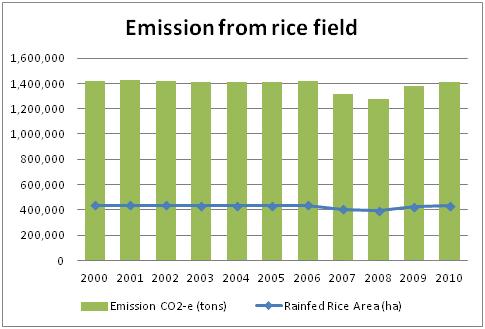
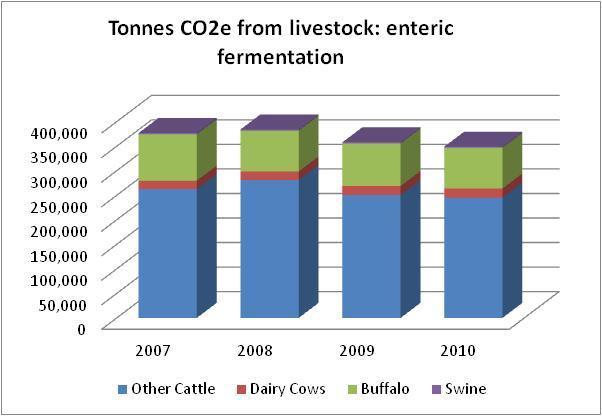
17 Agriculture Tonnes CO2 e


18 Emission of non-co 2 Forest Fires Emission of non-co 2 Agricultural burning
19 GHG Emission/Removal Key Category Analysis, 2008 Total source3.46 Mt CO 2eq (excluded industrial sector) Total sink Mt CO 2eq

20 GHG Emission/Removal from each Sector in 2008 Total GHG emission 3.46 Mt CO 2 -e Total GHG removal 2.22 Mt CO 2 -e
21 Khon Kaen s Strategic Plan for Emission Mitigation Proposed in the Provincial Development Plan Strategy 1 Competitive and Sustainable Economic Development Strategy 1.1 : Developing Agriculture To Become the Center of Economic Agriculture of the Region Strengthening the Good Agricultural Practice for Crop Production Mitigation in Agricultural Sector Increasing the Yield/ha while Decreasing the Cost/ha for Cassava Production to Increase the Feedstock for Biofuel Production Mitigation in Energy and Agricultural Sectors Development of Biofuel Industry (Bio-Ethanol) Infrastructure Mitigation in Energy Sector Promotion of Eucalyptus Plantation to Support Paper Industry Enhancement of Removal by LU Strategy 1.2 : Development of Industries Based on the Unique Characteristics of Khon-Kaen s Land Focusing on the Use of Locally Produced Economic Crops and Feedstocks Mitigation in Transportation Sector Focusing on Becoming the Center of Bio-Ethanol Production and Increasing the Production Capacity of Bio-Ethanol Mitigation in Transportation Sector Enhancing the Energy Efficiency in Transportation Sector Mitigation in Transportation Sector Enhancing the Energy Efficiency in Production Process Starting from Cassava Starch Industries Mitigation in Energy in Industry Sector Zoning of Land for Cassava Plantation to Enable a Continuous Supply to Factories Mitigation in Energy and LU Sectors
22 Khon Kaen s Strategic Plan for Emission Mitigation Proposed in the Provincial Development Plan Strategy 1.3 : Development of Trade, Tourism, Services, and Infrastructure to Become the Center of the Region Enhancing the Capacity of Rail Transportation by Constructing New Rail Routes Mitigation in Transportation Sector) Establishing of Storage and Distribution Centers of Goods Mitigation in Transportation Sector Development of Public Transport System and Reducing Number of Trips Using Personal Vehicles by Constructing BRT and Bike Ways Mitigation in Transportation Sector Strategy 3 : Natural Resource and Environment Management for Sustainable Development Strategy 3.1 : Conservation and Rehabilitation of Soil Quality Promotion of Organic Farming Enhancement of Removal by Cropland Strategy 3.2 : Development of Water Reservoir to Increase Fresh Water Resource, of Water Distribution System, and of Efficient Water Quality Management System Promotion of Wetlands Conservation Enhancement of Removal by LU
23 Khon Kaen s Strategic Plan for Emission Mitigation Proposed in the Provincial Development Plan Strategy 3.3 : Conservation and Sustainable Rehabilitation of Forest Resource Forest Conservation and Rehabilitation by Planting Trees on Abandoned Lands or by Developing Community Forests Enhancement of Removal by Forestry Control and Increase the Area of Protected Forest Enhancement of Removal by Forestry Strengthening of Control of Burned Areas by Forest Fires Reduction of Emissions from Forest Fires Strategy 3.4 : Natural Resource and Environment Management System Enabling to Support the Extension of the City Enhancing the Efficiency and Quality of Livestock Production and Associate Manure Management Mitigation in Agricultural Sector Development of Green Space Enhancement of Removal by Forestry Promotion of Clean Technology in Industrial Production Mitigation in Industrial Sector Strategy 3.5 Promotion of Renewable Energy Enabling Sustainable Energy Use Development of Renewable Energy and Renewable Energy Resource to Assure Energy Security Mitigation in Energy Sector
24 Next Steps Forward To continue the inventory of Energy in Industry and Waste Sectors To perform emissions projections for BAU and CM scenarios using ExSS for Energy Sector, and IPCC+Econometrics for AFOLU and Waste Sectors To evaluate the effectiveness of the CM set based on Khon Kaen s Development Plan Use findings and lessons learnt to support Bangkok Metropolitan Administration in developing the BMA Master Plan on Climate Change Adaptation and Mitigation funded by JICA

25 Finally Live Coolly with Strategy (LCS) ขอบค ณค ะ Khob Khun Kha สว สด ค ะ Sawasdee Kha 25