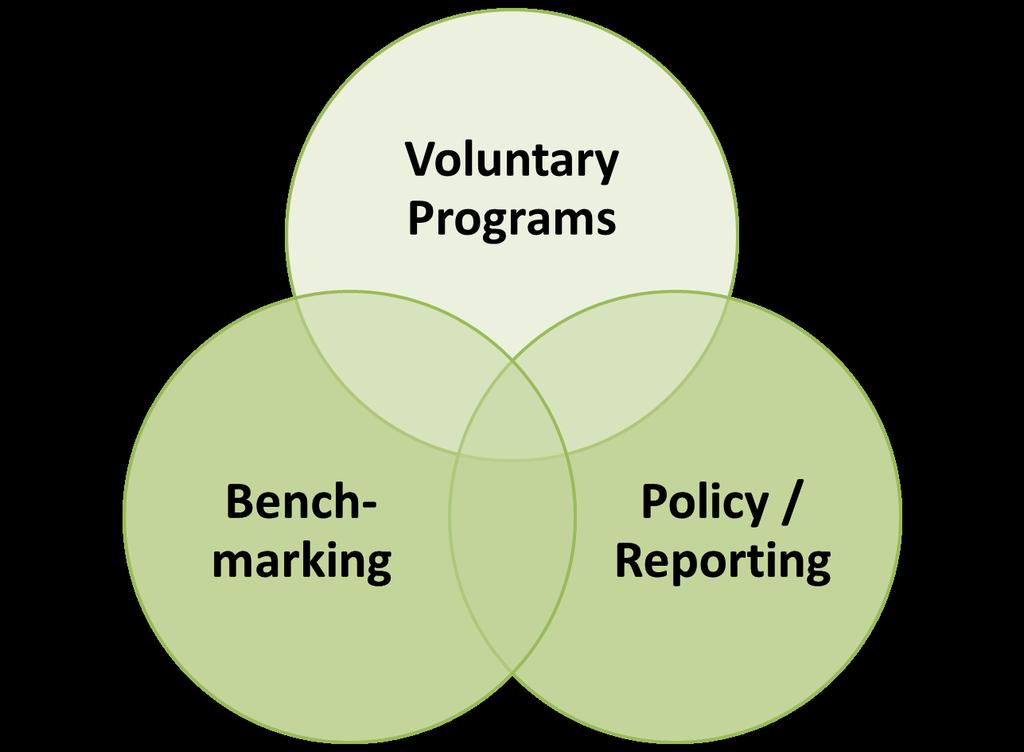
Drivers of Change: Voluntary Energy Reduction Programs, Benchmarking & Energy Reporting
|
|
|
- Catherine McDonald
- 5 years ago
- Views:
Transcription


1 Drivers of Change: Voluntary Energy Reduction Programs, Benchmarking & Energy Reporting


2 Civic leadership makes a difference

3


4 CEEA 2014 Survey: Canadian Business Attitudes on Energy Efficiency Key Findings: Most companies are concerned about energy costs and have made upfront investments in order to become energy efficient. But there is much more to do: less than half have set targets for reductions in energy consumption and most admit they are not doing all they could do to be more energy efficient.

5 If you can t measure it, you can t manage it.

6 Building Energy Benchmarking Status Update Canada Green Buildings Conference June 3, 2014 Philip B. Jago, Director Buildings Division
7 We are the Buildings Division, Office of Energy Efficiency The Buildings Division EXISTING plays a role FEDERAL in the BUILDINGS BUILDINGS following areas. NEW BUILDINGS NECB Update NECB Commissioning Vision: Helping Canada s buildings sector to become a world leader in energy performance Canadian Adaptation of ENERGY STAR Portfolio Manager Recommissioning FBI Technical resources and assistance CAPACITY BUILDING AND ENABLING TOOLS Training - Dollars to $ense Workshops Tools Information Retrofit Guidelines
8 Strategic Approach to Energy Management Source : EPA ENERGY STAR


9 Benchmarking is Key to a Successful Energy Program Contribute to more responsible management through more informed decision-making Heighten awareness of energy use Identify billing errors Assess effectiveness of current operations, policies, practices, staff training Set priorities for upgrades and retrofits Document environmental stewardship and demonstrate success Source : EPA ENERGY STAR
10 System Components ENERGY STAR Portfolio Manager Canadian reference database Commercial and Institutional Energy data. A national Survey of energy consumption was conducted by Statistics Canada in Program database Capacity to Store historical information and ratings on individual buildings. On-line rating/ monitoring and tracking tool Portfolio Manager provides a portal for Canadian building owners and operators with metric measures and baselines that reflect Canadian building data. Web service to support data exchange With the collaboration of Energy Service Providers (ESPs) and utilities.


11 Canadian Users Territories Buildings registered (112m 2 floors space) in ENERGY STAR Portfolio Manager and counting British Columbia 1470 Alberta 970 Saskatchewan 220 Manitoba 240 Ontario 3530 Quebec 570 Atlantic 201 Nfld/Lab 19 PEI 5 NS 150 NB - 29 Stakeholder Endorsement and Users

12 Buildings by Metropolitan Area Buildings by metropolitan area Buildings Floor Space m2 Calgary ,600,000 Edmonton 255 3,250,000 Halifax ,000 Montreal ,200,000 Ottawa 100 1,800,000 Quebec City ,000 Regina ,000 Toronto 2,700 57,200,000 Vancouver 1,100 13,700,000 Victoria ,000 Winnipeg 200 1,540,000 Total 5, ,520,000 Edmonton 255 Calgary Quebec City Vancouver 585 Regina Winnipeg Victoria 200 Montreal Halifax Fredericton 25 5 Toronto 2700 Ottawa 100


13 Growth since January 2013 These regions started with 0 buildings in 2013

14 Buildings by Type
15 Technical Update - Energy Star score for Canadian Buildings - Score for Hospital was released earlier this month - Food retail (grocery stores, supermarkets) is in the final stages of analysis - Non-food retail is posing challenges ongoing work - Initiating work on Warehouses - Portfolio Manager - Share forward - Transferring property ownership - Data quality checker enhancements - Additional upload templates space use details 15
16 We continue to move forward Early developmental stages of the next building survey Will cover consumption year 2014 Similar in scope to SCIEU 2009 Initial contacts from Statistics Canada in late summer used to define the survey sample Survey will happen early 2015 Combination of mail, telephone and interviews 16


17
18 Toronto region office sector working together to collectively reduce energy use by at least 10% over four years
")
19 Big News! 32% of office space registered 9% collective reduction ( ) 139,026,000 ekwh 17,000 metric tons GHG emissions 3,598 cars off the road
20 Building Data Pool Building Status Registered in Race Submitted data 105 / 67% 142 / 81%
21 16% Number of Buildings Showing Energy Savings 2012 vs % 1% 16% 27% No Savings Savings 0-5% Savings 5%-10% Savings 10%-15% Savings 15%-20% Savings > 20 % 31% Number of Buildings Showing Energy Savings 5% 1% 2011 vs % 57% of buildings reduced energy use by more than 5% in 2012 (vs 22% in 2011) 13% 46% No Savings Savings 0-5% Savings 5%-10% Savings 10%-15% Savings 15%-20% Savings > 20 % 32%
22 Percentage of Facilities Showing Annual Energy Savings Between % 33% Savings greater than 1,000,000 ekwh/year Savings between 500,000 and 1,000,000 ekwh/year Savings less 500,000 ekwh/year No Savings 40% 11% Percentage of Facilities Showing Annual Energy Savings Between % 14% of buildings had no savings or increased energy in 2012 (vs. 46% in 2011) 46% 32% 11% Savings greater than 1,000,000 ekwh/year Savings between 500,000 and 1,000,000 ekwh/year Savings less 500,000 ekwh/year No Savings

23 Energy savings were distributed more evenly across all building sizes in 2012 vs. 2011
24 Utility Savings Utility Electricity (ekwh) 4.1% 45,706,400 3% 31,913,750 7% 77,620,100 Gas (ekwh) -4.4% -13,647, % 54,039, % 40,391,500
25 ENERGY STAR Summary ES Score Median

26 ENERGY STAR 2012
27 Savings vs ENERGY STAR Score

28 Are We There Yet? If all buildings reach ENERGY STAR 85, 19.2% additional energy savings will be achieved compared with 2012

29 Policy & Mandatory Energy Reporting


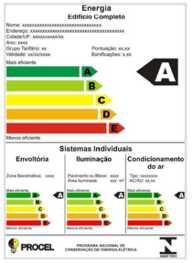
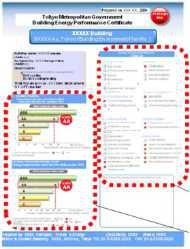
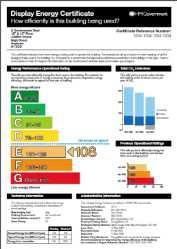
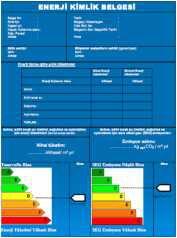

30 Global Building Energy Labeling

31 Now implemented by 34 EU nations Introduced 2002 EU Building Energy Certificate Public disclosure of Energy Performance Certificates for all buildings built, sold or leased Extended 2010 Energy performance disclosure in all sales and rental advertising

32 US Building Energy Benchmarking States: California, Washington Cities: New York Boston Chicago Philadelphia Washington DC San Francisco Denver Seattle Austin Minneapolis


33 Buildings that consistently benchmark energy use save an average of 2.4% per year US Environmental Protection Agency Transparency Benefits Informs market decisions with energy & GHG performance Spurs investment in buildings with best opportunities Bolsters market competition, highlights industry leaders Track and manage energy use and cost Informs policy, capital and asset management decisionmaking Fosters clean / green jobs and skills
 Improve building design efficiency & of existing construction buildings by 20% Target: 916,000 tco2e 2012: 1,115,000")
34 Green Economy Goals Secure Vancouver international reputation as a 2020 mecca Targets for green enterprise Reduce community GHG emissions Eliminate Vancouver's 33% from 2007 levels dependence on fossil fuels Target: 1,846,000 tco2e Lead 2012: the 2,657,000 world in green (-4%) Improve building design efficiency & of existing construction buildings by 20% Target: 916,000 tco2e 2012: 1,115,000 (-3%)

35 Vancouver & BC March Unanimous Council request for municipal powers require annual reporting of building energy data public release of building energy benchmarking information Engage Lower Mainland Local Government Association & Union of British Columbia Municipalities

36 Ontario February 2009 Ontario Green Energy Act Renewable Feed-in Tariff October 2013 Phil McNeely, MLA Passed - Enact time-of-sale house energy labelling by the end of 2014 Right to home energy efficiency disclosure on home sale Clear and transparent reporting of energy use and... GHG emissions of government facilities

37 City of Toronto March 2014 CaGBC-GTC & Toronto Atmospheric Fund...proposed bylaw & implementation plan for establishing a mandatory Annual Energy & Water Utilization Reporting Requirement for large buildings. August Staff interim status report By March report to Council with proposed bylaw & implementation plan

38

39 1. Register 2. Submit data
40 Linda Weichel CivicAction (416) x502 Philip Jago Natural Resources Canada (613) Ian Jarvis Enerlife Consulting (416) x203 Ian Theaker Ecolibrium (416)
41 Drivers of Change: Voluntary Energy Reduction Programs, Benchmarking & Energy Reporting