2017 Lake Hartwell Association
|
|
|
- Noel Payne
- 5 years ago
- Views:
Transcription


1 2017 Lake Hartwell Association By Stan Simpson Water Manager/Civil Engineer Savannah District 14 October 2017 Trusted Partners Delivering Value, Today and Tomorrow CHARLESTON JACKSONVILLE MOBILE SAVANNAH WILMINGTON US Army Corps of Engineers
2 Agenda Did Irma Rainfall Help? Conditions Forecast Comp Study Proposed Alternative Questions 2

3 Forecasted Irma Rainfall
4 Observed Irma Rainfall Hartwell: 2.1 inches Thurmond: 2.5 inches
5 Pool Rise (ft) Runoff Ratio Scale 12 Estimated Rise in Hartwell Elevation (ft) Rainfall (in) Hartwell Rise (ft)

6 2016 Drought

7 2016 Drought Streamflow

8 Current State As of Oct. 10, 2017 United States Drought Monitor


9 90-Day Drought Outlook As of Sept. 21, 2017
10 Current Projection Assumes net local inflows begins around 66% of normal and returns to 50% over 10 weeks 10
11 ENSO Forecast El Nino La Nina La Niña conditions are favored (~55-65%) during the Northern Hemisphere fall and winter
12 Comp Study Purpose Examine an array of alternative reservoir releases from the multipurpose dam and reservoir projects on the Savannah River during droughts. If a better release scenario is identified, the District would implement as an update to the Savannah River Basin Drought Contingency Plan.

13 Basin Recap: Operated as System Trusted Total Partners Drainage Delivering Basin Area Value, -10,580 Today sq and miles Tomorrow

14 Reservoir Simulation River Hydraulics Harbor Effects

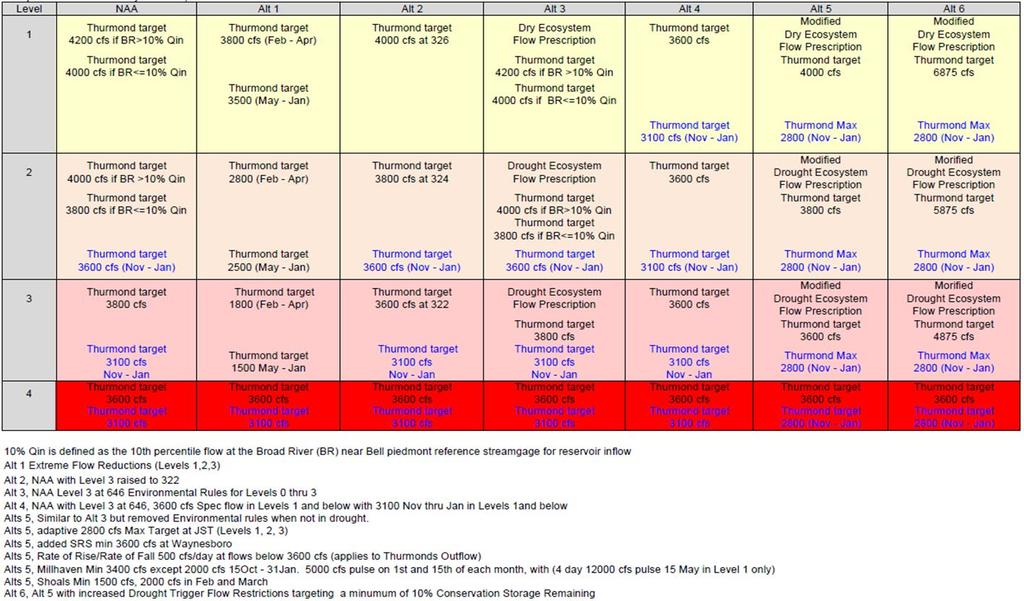
15 Study Alternatives

16 Today s Operation

17 Proposed Operation
18 Evaluating The Alternatives Asked the natural resource agencies what information they would like to see to evaluate impacts from proposed changes to the Drought Plan Identified 53 performance measures (metrics) to assess impacts from the alternatives when compared to the NAA Identified how the information would be produced (how and by whom)
19 Evaluation Criteria - GA Exceedance curve of reservoir elevation (Jocassee, Keowee, Hartwell, Russell, Thurmond) Exceedance curve of reservoir release (Thurmond) Minimum lake elevation (Jocassee, Keowee, Hartwell, Russell, Thurmond) Power generation (Bad Creek, Jocassee, Keowee, Hartwell, Russell, Thurmond) Power generation (Bad Creek, Jocassee, Keowee, Hartwell, Russell, Thurmond) Power generation (Bad Creek, Jocassee, Keowee, Hartwell, Russell, Thurmond) Lake recreational impact (Jocassee, Keowee, Hartwell, Russell, Thurmond) Lake recreational impact (Jocassee, Keowee, Hartwell, Russell, Thurmond) Numbers of days in different drought trigger levels (Hartwell, Thurmond) Lake levels or flows are lower than the lowest level or flow at which water supply intake becomes inoperable Identify lake elevations level at intakes (some highest intakes may not be critical) Identify river flow/elevation for intakes Number of days that critical water supply intake becomes inoperable (Hartwell, Russell, Thurmond) Stream flow exceedance at Augusta diversion dam Flow exceedance through the Augusta Canal Stream flow exceedance at Augusta gage (downstream of the shoals) Stream flow exceedance at Burtons Ferry and Clyo Effect on the DO in the River Effect on water temperature in the River Effect on the downstream fish spawning downstream of the New Savannah Bluff Lock and Dam Effect on the DO in the Harbor Effect on temperature in the Harbor Effect on salinity in the Harbor Effect on the downstream fish spawning in the Harbor Effect on the downstream fish populations in the Harbor
20 Evaluation Criteria - SC Number of days when power contracts are not met by the Corps projects Power shortages (total Megawatts) for the Corps projects Cost of replacement power purchased by SEPA Total power generation by the Duke projects Inability to maintain stable lake levels during lake spawning periods (defer to biologists) Number of days boat ramps and docks are unusable (# ramps x days) in Hartwell and Thurmond Number of days some percentage of ramps and docks are unusable in Hartwell and Thurmond Are there critical lake elevations for safe boating? Are there critical lake elevations for fishing? Number of days lake levels are below any intakes and critical intakes Number of days swimming areas are closed due to low water in Hartwell and Thurmond Number of days when flows in the shoals are less than recommended; (FERC Agreement) Number of days Augusta Canal would have to cut back on hydropower to meet shoals minimum Number of days Augusta would need to run diesel pumps to pull raw water due to implementation FERC Agreement Number of days river levels are below any intakes and critical intakes Number of days boat access ramps in river are unusable (# ramps x days) Number of days DO standards are not met in river Impacts to fish spawning/habitat in shoals Number of days DO standards are not met in river (per node) Number of days when flow of river is less than 7Q10 Number of days City of Savannah would be impacted by high salinity levels in Abercorn Creek Number of days DO standards are not met in estuary Salinity levels in river near Savannah National Wildlife Refuge freshwater intakes Number of days DO standards are not met in estuary (per node) Location of fresh/saline water interface near coast for wetland analysis Number of days Savannah intake (Abercorn Creek) exceeds desirable salinity levels

21 Modeling The Alternatives
22 Comparison of Alternatives Grouped metrics by reservoir project purposes Flood Risk Management, Hydropower, Recreation, Environmental Stewardship, Navigation, Water Quality, and Water Supply Identified effects produced on each metric Used economic factors to calculate effects on hydropower and recreation Used non-economic factors to calculate the effects on other project purposes Used percent change as the common unit of measurement to identify the level of impact across each project purpose
23 Comparison of Alternatives (cont.) Once the effects on the project purposes were comparable (measured in the same units), the team compared the impacts on the various project purposes Ranked the alternatives from 1 to 7 by their level of impact, with 1 being the highest positive impact and 7 being the highest negative impact The team combined the project purpose impact rankings and averaged them to calculate the total impact for each alternative Presented District ranking and TSP selection to sponsors
24 Evaluation of Alternatives NAA Alt1 Alt2 Alt3 Alt4 Alt5 Alt6 HYDROPOWER* -0.39% 0.05% -0.96% -0.04% -0.12% -0.31% AAE combined dollars -$293,000 $35,000 - $723,000 -$34,000 -$93,000 -$233,000 Rank RECREATION* 3.35% 0.72% -1.08% 1.67% -2.11% % AAE combined dollars $14,889 $3,185 -$4,809 $7,406 -$9,371 -$78,410 Rank ENVIRONMENTAL Rank Lake Rank River Rank Estuary/Harbor Rank Overall** WATER SUPPLY*** % 11.62% % 29.93% % % Rank NAVIGATION 13.00% 7.00% -2.00% 6.00% -9.00% -9.00% Rank FLOOD RISK MANAGEMENT*** 0.85% 0.69% % % 0.95% % Rank TOTAL RANK FINAL RANKING
25 TSP/Alternative 2 Alternative 2 (Raise Level 3) Reduces flows more at each Drought Level Raises Drought Level 3 to two feet below Level 2 (raise it by six feet) Drought Level 1 - Daily average release of 4,000 cfs (4,200) Drought Level 2 - Daily average release of 3,800 cfs Feb through Oct; 3,600 cfs Nov through Jan. (4,000) Drought Level 3 - Daily average release of 3,600 cfs Feb through Oct; 3,100 cfs Nov through Jan. (3,800)
26 TSP/Alternative 2 Improves environmental and recreation conditions Maintains pools slightly higher during droughts Decreases # of days beaches would be closed Increases # of days boat ramps would be available Recreational docks are available for longer durations Improves fish spawning habitats Maintain more stable lake levels Improves flows at the Augusta Shoals Improves DO levels in river and harbor Slightly increases hydropower value
27 TSP vs. Other Alternatives Alt 1 Most negative impacts to hydropower Alt 3 Most negative impacts Alt 4 Increases Flood Risk & DO violations Alt 6 Increases DO violations Alt 5 Negative impacts to all project purposes except water supply


28 Questions Find us on Social Media! 2