Sewer Siphon Pre-Design Report for the Santa Clara River Crossing at Vista Canyon (2009)
|
|
|
- Hortense Merritt
- 5 years ago
- Views:
Transcription
1 Sewer Siphon Pre-Design Report for the Santa Clara River Crossing at Vista Canyon (2009)
2
3 TABLE OF CONTENTS PAGE NO. CHAPTER 1 INTRODUCTION... 1 BACKGROUND AND EXISTING FACILITIES... 1 CHAPTER 2 DESIGN FLOWS... 3 FLOW SUMMARY... 7 EXISTING FLOW DATA... 7 CHAPTER 3 SIPHON SIZING ANALYSIS... 9 CHAPTER 4 SIPHON CONSTRUCTION CONSTRUCTION TECHNIQUES CONSTRUCTION PHASING CONSTRUCTION MATERIALS APPENDIX A Excerpts from the Sewer Area Study for the Soledad Commons Commercial Center, approved by LADPW March 3, 2009 and the City of Santa Clarita APPENDIX B City of Santa Clarita MH#136 Flow Test Data APPENDIX C HDPE Dimension Ratio (DR) Calculations i
4 LIST OF TABLES AND FIGURES PAGE NO. TABLE 2-1 PEAK COEFFICIENT COMPARISON... 4 TABLE 2-2 EXISTING FLOW COMPARISON... 5 TABLE 2-3 ULTIMATE FLOW COMPARISON... 6 TABLE 2-4 EXISTING AND ULTIMATE FLOW SUMMARY... 7 TABLE 2-5 MEASURED EXISTING FLOW AND PROJECTED ULTIMATE FLOW... 8 TABLE 3-1 VELOCITY AND HEADLOSS FOR EXISTING AND ULTIMATE SIPHON FLOWS, C = TABLE 3-2 VELOCITY AND HEADLOSS FOR EXISTING AND ULTIMATE SIPHON FLOWS, C = TABLE 3-3 SURCHARGE CALCULATION ELEVATIONS, IN FEET TABLE 3-4 UPSTREAM JUNCTION STRUCTURE SURCHARGE ANALYSIS FIGURE 1-1 EXISTING AND PROPOSED SEWER SYSTEM... 2 FIGURE 4-1 PRELIMINARY SIPHON PLAN AND PROFILE ii
5 CHAPTER 1 INTRODUCTION The purpose of this report is to present the preliminary design components for the proposed sewer siphon to cross the Santa Clara River at the Vista Canyon project. This report presents: The existing and ultimate flow rates to be carried by the siphon An analysis of these flows to determine the appropriate sizing Recommended construction techniques Recommended materials of construction Preliminary plan and profile with junction structures BACKGROUND AND EXISTING FACILITIES The Vista Canyon project is located just south and west of the City of Santa Clarita boundary. It is bound by the Antelope Valley Freeway (SR 14) to the north, residential properties of La Veda Drive to the east, railroad tracks and Fair Oaks Ranch to the south, and the Colony Townhomes to the west. Vista Canyon is a mixed use development with residential, retail, office, hotel, recreational and open space areas. The Vista Canyon project is located in the East Soledad Canyon Drain of the Santa Clarita Valley drainage basins. All of the flows from this drainage basin flow to the County Sanitation Districts of Los Angeles County (LACSD) existing 18-inch trunk sewer line in Soledad Canyon Road. There are two sewer pipes which discharge to the upstream start of the LACSD 18-inch trunk sewer at manhole SDM211, namely (1) a 15-inch pipe owned by the City of Santa Clarita (the City) which serves residential development on the north side of Soledad Canyon Road and the Santa Clara River and (2) a 24-inch pipeline owned by the Newhall County Water District (NCWD) which serves the remainder of the East Soledad Canyon Drain. See Figure 1-1 for the existing sewer systems and proposed sewer bypass line and siphon. The 24-inch NCWD pipeline, located in the Santa Clara River, carries flow from the 18-inch NCWD pipeline and the 18-inch City pipeline. The agencies have expressed an interest in removing these facilities from the river. In doing so, flows carried by the 18-inch NCWD pipeline would be routed to the north side of the river. Flows through the18-inch City pipeline (between existing manholes 134 and 135) would be routed through the Vista Canyon project and cross the river via a siphon. This report addresses the pre-design components of this siphon. DEXTER WILSON ENGINEERING, INC. PAGE 1
6 0.28 AC LO S LOST CANYON ROAD T CA NY ON RO AD ROAD BU S BA Y CANYON LOST
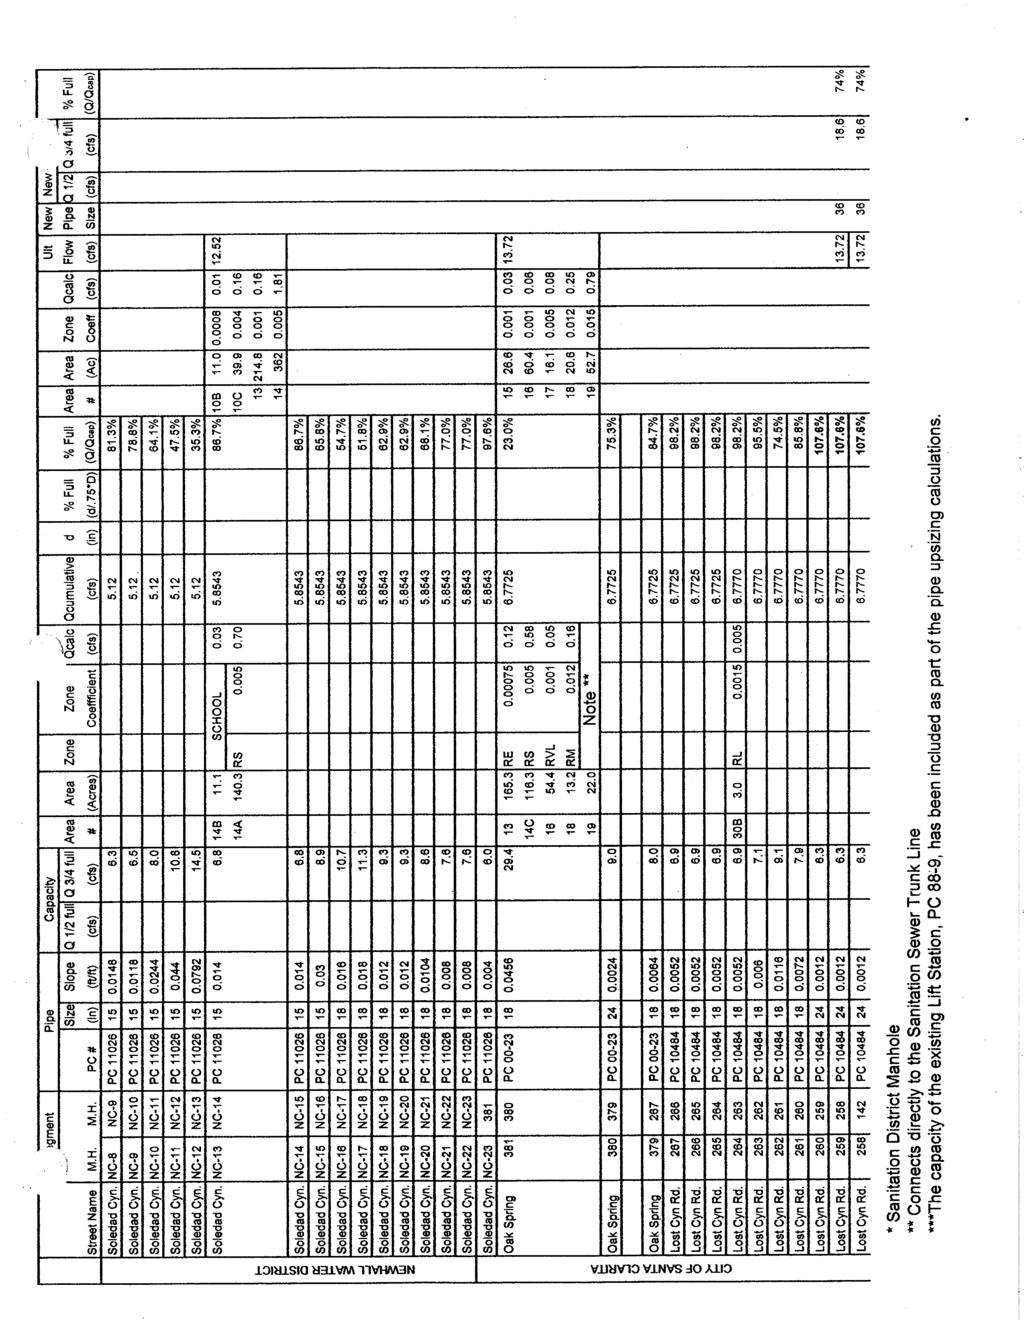
7 CHAPTER 2 DESIGN FLOWS The proposed siphon will carry a significant portion of the wastewater flows generated within the East Soledad Canyon Drain. Construction of the siphon would begin in approximately three to five years and so must be designed to handle existing flows as well as the ultimate buildout flows of its drainage basin. The County of Los Angeles Department of Public Works (LADPW) approved on March 3, 2009 the Sewer Area Study for the Soledad Commons Commercial Center LACounty:PC12084AS, Tract This study evaluated the portion of the East Soledad Canyon Drain flows to be carried by the siphon. The study estimated existing and buildout flows using City flow coefficients for areas within the City and LADPW flow coefficients for areas within Los Angeles County. Appendix A contains key excerpts from this study. To compare how different agencies would estimate the flow through the siphon, both existing and ultimate flows were estimated based on (1) using only City factors, (2) using only LADPW factors, and (3) using only LACSD s factors. Table 2-1 first shows the land use designations and residential densities as approved in the Soledad Commons Sewer Study. It then presents the equivalent land use type and associated peak acreage-based generation factor, utilized for each agency. Tables 2-2 and 2-3 then provide the existing and ultimate peak flows to be carried by the siphon. DEXTER WILSON ENGINEERING, INC. PAGE 3
8 Land Use TABLE 2-1 PEAK COEFFICIENT COMPARISON Approved Soledad Commons Study City DPW LACSD Peak Coefficient Planning Residential Density, DU/acre Land Use Peak Coef. Land Use Peak Coef. Land Use Peak Coef. A City - A A HM A Reg. Plan - A A HM A Reg. Plan 4 A A RVL A City - A A HM A Reg. Plan - A A HM A Reg. Plan - A A HM A Reg. Plan - A A HM CC Reg. Plan - CC CC CC CC City - CC C CC OS City - OS A HM R Reg. Plan 4 RS R RS R Reg. Plan 4 RS R RS R Reg. Plan 6 RS R RS R Reg. Plan 5 RS R RS RE City <1 RE R RE RL City 2.2 RL R RL RM City 11 RM Calc cfs/ac RM RS City 5 RS R RS RVL City 1 RVL R RVL SP * Reg. Plan W 0 Reg. Plan * Flow for specific plan (SP) area carried through all calculations DEXTER WILSON ENGINEERING, INC. PAGE 4
9 TABLE 2-2 EXISTING FLOW COMPARISON Approved Approved City DPW LACSD Approved Soledad Soledad Soledad Commons Commons Area Acre Zoning Commons Study Peak Peak Peak Study Land Peak Land Peak Land Peak Study Cumulative Flow, Flow, Flow, Flow, Use Coef. Use Coef. Use Coef. Coefficients Flow, cfs cfs cfs cfs cfs 5 9 CC CC CC CC A 71.1 RS RS R RS B RS RS R RS C RS RS R RS RL RL R RL D * 14 RS RS R RS RL RL R RL * Note capacity of pump station is 4.98 cfs 14B 11.1 School A RS RS R RS RE RE R RE C RS RS R RS RVL RVL R RVL RM RM Calc cfs/ac RM B 3 RL RL R RL RE RE R RE RVL RVL R RVL RVL RVL R RVL A A A HM RVL RVL R RVL OS OS A HM A 32 RL RL R RL RL RL R RL School RS RS R RS Total Peak, cfs DEXTER WILSON ENGINEERING, INC. PAGE 5
10 Area Acre Zoning Approved Soledad Commons Study Coefficients Approved Soledad Commons Study Flow, cfs City or Regional Planning TABLE 2-3 ULTIMATE FLOW COMPARISON Residential Density, DU/acre Land Use City DPW LACSD DEXTER WILSON ENGINEERING, INC. PAGE 6 Peak Coef. Peak Flow, cfs Land Use Peak Coef. Peak Flow, cfs Land Use Peak Coef. Peak Flow, cfs CC Reg. Plan - CC CC CC SP Reg. Plan A Reg. Plan - A A HM A 15.0 R Reg. Plan 5 RS R RS B 26.0 R Reg. Plan 6 RS R RS C 21.0 R Reg. Plan 4 RS R RS D 50.0 R Reg. Plan 4 RS R RS E 2.1 R Reg. Plan 5 RS R RS RS City 5 RS R RS A 4.7 R Reg. Plan 6 RS R RS B 15.2 R Reg. Plan 4 RS R RS C 9.3 R Reg. Plan 4 RS R RS RL City 2.2 RL R RL A 14.8 R Reg. Plan 5 RS R RS B 4.6 R Reg. Plan 4 RS R RS C 0.8 R Reg. Plan 5 RS R RS CC City - CC C CC A 62.4 A Reg. Plan - A A HM A 4.5 R Reg. Plan 4 RS R RS B 25.6 R Reg. Plan 4 RS R RS RL City 2.2 RL R RL B 11.0 A Reg. Plan - A A HM C 39.9 A Reg. Plan 4 A A RVL RE City <1 RE R RE RS City 5.0 RS R RS A City - A A HM RVL City 1.0 RVL R RVL RS City 5.0 RS R RS RM City 11.0 RM Calc cfs/ac RM CC City - CC C CC W Reg. Plan RVL City 1.0 RVL R RVL RE City <1 RE R RE RVL City 1.0 RVL R RVL A Reg. Plan - A A HM RVL City 1.0 RVL R RVL A City - A A HM RL City 2.2 RL R RL RVL City 1.0 RVL R RVL OS City - OS A HM RL City 2.2 RL R RL Pump RL City 2.2 RL R RL RL City 2.2 RL R RL RS RS R RS Total Peak, cfs
11 FLOW SUMMARY To determine average daily flows, LACSD s peaking equation was applied to the peak flows. The peaking equation used, where Q is in millions gallons per day (mgd), is shown below * peak Q average Q = The peaking factor to determine minimum flows, 0.35, was determined on a review of off-site flow data in the vicinity of the project. Table 2-4 summarizes the existing and ultimate flows based on the generation coefficients and the resulting average and minimum flows as a result of applying the peaking factors. These flows are then used in the following chapter to conduct the siphon sizing analysis. Flow TABLE 2-4 EXISTING AND ULTIMATE FLOW SUMMARY Peak Factor Approved Study City LADPW LACSD Existing Flows, cfs Average Qpeak* Minimum Qavg* Peak Ultimate Flows, cfs Average Qpeak* Minimum Qavg* Peak Shaded flows determined based on peaking factors Unshaded flows calculated using generation factors EXISTING FLOW DATA From June 11 to June 25, 2009, a flow test was conducted at existing City manhole MH#136 to evaluate the existing average and peak flows which will be carried by the siphon. To determine the ultimate flows, the measured average flow was increased by 3.6 cfs and the measured peak flow was increased by 7.8 cfs. These increases correspond with the difference between existing and ultimate flows calculated in the Soledad Commons Sewer Study to account for future growth in the basin. Table 2-5 summarizes the flows utilized in the siphon sizing analysis. The results of the flow study and notes regarding the use of this data can be found in Appendix B. DEXTER WILSON ENGINEERING, INC. PAGE 7
12 TABLE 2-5 MEASURED EXISTING FLOW AND PROJECTED ULTIMATE FLOW (in cfs) Scenario Existing Flow Increase to Ultimate Projected Ultimate Flow Average Peak In comparing the ultimate flows from existing data in Table 2-5 to those estimated in Table 2-4, it is clear that the ultimate flows developed from the existing data are less. This could partially be due to water conservation efforts which are not captured within present generation factors. DEXTER WILSON ENGINEERING, INC. PAGE 8
13 CHAPTER 3 SIPHON SIZING ANALYSIS The proposed siphon must be designed to accommodate existing flows as well as the projected ultimate flows for the basin. In sizing the siphon, the velocity through the siphon should achieve 2 feet per second at least once per day under the existing flow scenario. Additionally, the velocity should be at a maximum of approximately 7 feet per second in the ultimate scenario. This chapter presents the analysis used to size the siphon. The following Tables 3-1 and 3-2 provide an analysis of flow velocity and headloss at Hazen- Williams C values of 140 and 160, respectively, for a 20-inch and 24-inch HDPE DR9 pipe. The tables compare these conditions for all of the design flows presented in Chapter 2. If headloss through the siphon is less than the available head, then no surcharging occurs in the upstream junction structure/manhole. If the headloss through the siphon is greater than the available head on the siphon, the depth of surcharge into the upstream junction structure/manhole equals the available head to surcharge minus the headloss minus the available head on the siphon. Table 3-3 summarizes this calculation and Table 3-4 presents the surcharging for each flow scenario. In reviewing all these elements, with focus on the measured (flow data) existing and ultimate flows, a 20-inch siphon ( inch ID) best accommodates all scenarios. This ID is for a nominal 20-inch pipe with a 21.6-inch OD (outside diameter) at a dimension ratio (DR) of nine (9). The selection of this DR is discussed further in Chapter 5. Velocities for a 20-inch siphon would be just below 8 fps under the flow data ultimate condition, but would insure that the siphon sees a minimum cleansing velocity of 2 fps under the existing scenario. The headloss and surcharging of the upstream junction structure calculations confirm this choice. DEXTER WILSON ENGINEERING, INC. PAGE 9
14 TABLE 3-1 VELOCITY AND HEADLOSS FOR EXISTING AND ULTIMATE SIPHON FLOWS, C = 140 EXISTING FLOWS ULTIMATE FLOWS Flow Velocity, ft/s ID (in) = Flow Velocity, ft/s ID (in) = DR-9, OD (in) = 20 DR-9, OD (in) = 20 Flow Approved Flow Approved City LADPW LACSD Flow City LADPW LACSD Flow Study Data Study Data Average Average Minimum Minimum Peak Peak Headloss Calculations, ft Headloss Calculations, ft L (feet) = 980 C = 140 L (feet) = 980 C = 140 Average Average Minimum Minimum Peak Peak Flow Velocity, ft/s ID (in) = Flow Velocity, ft/s ID (in) = DR-9, OD (in) = 24 DR-9, OD (in) = 24 Flow Approved Flow Approved City LADPW LACSD Flow City LADPW LACSD Flow Study Data Study Data Average Average Minimum Minimum Peak Peak Headloss Calculations, ft Headloss Calculations, ft L (feet) = 980 C = 140 L (feet) = 980 C = 140 Average Average Minimum Minimum Peak Peak DEXTER WILSON ENGINEERING, INC. PAGE 10
15 TABLE 3-2 VELOCITY AND HEADLOSS FOR EXISTING AND ULTIMATE SIPHON FLOWS, C = 160 EXISTING FLOWS (DIPS) ULTIMATE FLOWS Flow Velocity, ft/s ID (in) = Flow Velocity, ft/s ID (in) = DR-9, OD (in) = 20 DR-9, OD (in) = 20 Flow Approved Flow Approved City LADPW LACSD Flow City LADPW LACSD Flow Study Data Study Data Average Average Minimum Minimum Peak Peak Headloss Calculations, ft Headloss Calculations, ft L (feet) = 980 C = 160 L (feet) = 980 C = 160 Average Average Minimum Minimum Peak Peak Flow Velocity, ft/s ID (in) = Flow Velocity, ft/s ID (in) = DR-9, OD (in) = 24 DR-9, OD (in) = 24 Flow Approved Flow Approved City LADPW LACSD Flow City LADPW LACSD Flow Study Data Study Data Average Average Minimum Minimum Peak Peak Headloss Calculations, ft Headloss Calculations, ft L (feet) = 980 C = 160 L (feet) = 980 C = 160 Average Average Minimum Minimum Peak Peak DEXTER WILSON ENGINEERING, INC. PAGE 11
16 TABLE 3-3 SURCHARGE CALCULATION ELEVATIONS, in feet Downstream Siphon Discharge, IE Downstream Siphon Discharge, TOP Upstream Siphon Start, IE Upstream Siphon Start, TOP Upstream Manhole Start, top of manhole Available head on siphon = Start - Discharge 7.15 Available head to surcharge = Top of manhole - Discharge, TOP Pipe Size, OD TABLE 3-4 UPSTREAM JUNCTION STRUCTURE SURCHARGING ANALYSIS Upstream Junction Structure Surcharging, C = 140 Headloss & Surcharge Approved Study City LADPW LACSD Flow Data Existing Peak Flow, cfs Headloss, ft Feet of Surcharge Headloss, ft Feet of Surcharge Ultimate Peak Flow, cfs Headloss, ft Feet of Surcharge Too high Headloss, ft Feet of Surcharge Upstream Junction Structure Surcharging, C = 160 Pipe Size, OD Headloss & Surcharge Approved Study City LADPW LACSD Flow Data Existing Peak Flow, cfs Headloss, ft Feet of Surcharge Headloss, ft Feet of Surcharge Ultimate Peak Flow, cfs Headloss, ft Feet of Surcharge Headloss, ft Feet of Surcharge DEXTER WILSON ENGINEERING, INC. PAGE 12
17 CHAPTER 4 SIPHON CONSTRUCTION This chapter presents discussion of the recommended construction techniques, phasing, and materials. This chapter also presents calculations regarding the material selection. At the end of this chapter is a preliminary plan and profile of the sewer siphon. CONSTRUCTION TECHNIQUES Horizontal directional drilling (HDD) is the proposed method of construction for the sewer siphon to cross under the Santa Clara River. In comparison to other trenchless installation techniques, jack and bore would be used for shorter installations. In comparison to micro tunneling, HDD is a more cost effective installation method. The minimum depth of the sewer siphon is governed by the scour depth of the river and the soil cement bank stabilization that will be installed on the north and south sides of the river. The design and installation of the soil cement for bank stabilization is governed by the scour depth. The sewer siphon will be installed a minimum of five (5) feet below the soil cement bank stabilization and thus below the scour depth of the river. HDD is a trenchless method of construction that uses specialized drilling equipment. A bore hole will be drilled from the north side of the river, at the entry pit, to the south side of the river, at the exit pit. Drilling mud is used for lubrication of the bore hole, stabilizing the bore and transporting the cuttings to the surface for extraction. The siphon will have a belly to it, as shown in the profile. This will help to keep the drilling mud in the bore hole for ease of installation and maintaining the bore hole prior to placement of the sewer pipe. The second pass will go from the exit pit to the entry pit with a reamer head which expands the bore hole. The pipe to be installed follows the reamer head and is pulled through. The reamer head typically opens the bore hole an additional 6-inches or so to keep the space full of water, thus reducing the drag on the pipe. The exit pit was chosen for the south side of the river as it will provide more space for construction staging and fusing pipe material prior to installation. DEXTER WILSON ENGINEERING, INC. PAGE 13
18 CONSTRUCTION PHASING The sewer siphon is proposed to be installed prior to the soil cement being placed for bank stabilization, but after excavation has been completed for the soil cement. The entry and exit pits are shown on the plan and profile and will be located at a minimum of five feet below the soil cement. The HDD will enter the ground at a small gradual slope at the bottom of the soil cement excavation and create a slight belly at the bottom along its approximate 800 foot length. The up leg and down leg portions of the siphon behind the soil cement will be installed using standard open trench construction methods. CONSTRUCTION MATERIALS Common pipe materials used in HDD are steel and high density polyethylene pipe (HDPE). For deep installations, buckling of the pipe is of greatest concern, where steel would be preferred. In shallow installations, the bending radius is usually the limiting factor. The proposed installation of the siphon is relatively shallow, approximately 32 feet to top of pipe at its deepest point. Additionally, starting the HDD at the base of the soil cement excavation will limit the bend radius that the pipe is subjected to when installing the product. The appropriate wall thickness for the pipe is determined based on the long term allowable ring deflection, or ovalization, of the pipe. This is first accomplished by determining the anticipated earth pressure on the pipe and considering the long term elasticity of the pipe, confirming that the pipe does not deflect more than allowable. Based on the calculations, provided in Appendix C, a dimension ratio of nine (DR-9) is recommended. The most conservative characteristics were utilized to confirm this DR. In proceeding to final design, further soil investigations should be done for more definitive characteristics of earth load on the pipe. Additionally, more detailed calculations should be completed to account for internal and external pressures on the pipe and their impact on deflection and DR rating of the pipe. DEXTER WILSON ENGINEERING, INC. PAGE 14

19
20 APPENDIX A EXCERPTS FROM THE SEWER AREA STUDY FOR THE SOLEDAD COMMONS COMMERCIAL CENTER, APPROVED BY LADPW MARCH 3, 2009 AND THE CITY OF SANTA CLARITA
21
22
23
24
25
26
27
28
29
30
31
32
33
34 Land Use LACSD FLOW GENERATION FACTORS Average Flow Factor Type Average Flow gpd/du Residential Single Family Dwelling 260 Residential Condominium 156 Peak Flow Factors General Plan Description Jurisdiction AP Airport Regional Planning C Commercial Regional Planning M Industry Regional Planning N1 Non-Urban 1 Regional Planning N2 Non-Urban 2 Regional Planning P Public Services Facilities Regional Planning RR Resort Recreational Regional Planning HM Hillside Management Regional Planning U1 Urban 1 Regional Planning U2 Urban 2 Regional Planning U3 Urban 3 Regional Planning U4 Urban 4 Regional Planning BP Business Park Santa Clarita CC Community Commercial Santa Clarita CN Commercial Neighborhood Santa Clarita CTC Commercial Town Center Santa Clarita I Industrial Santa Clarita IC Industrial Commercial Santa Clarita PE Private Education Santa Clarita RE Residential Estate Santa Clarita RH Residential High Santa Clarita RL Residential Low Santa Clarita RM Residential Moderate Santa Clarita RMH Residential Medium High Santa Clarita RS Residential Suburban Santa Clarita RVL Residential Very Low Santa Clarita VSR Visitor Center Santa Clarita CO Commercial Office Santa Clarita Peak Flow cfs/acre
35 APPENDIX B CITY OF SANTA CLARITA MH#136 FLOW TEST DATA
36 MH 136 Data 6/11 and 6/12 data were excluded from evaluation gph cfs Date Day Min Max Avg Min Max Avg 6/13/2009 Saturday ,246 32, /14/2009 Sunday 9, ,871 49, /15/2009 Monday 5,261 90,323 44, /16/2009 Tuesday 1,198 97,838 47, /17/2009 Wednesday 3, ,238 46, /18/2009 Thursday 5,599 95,924 52, /19/2009 Friday 19,973 96,591 50, /20/2009 Saturday 13, ,196 55, /21/2009 Sunday 19, ,733 59, /22/2009 Monday 5, ,230 55, /23/2009 Tuesday 8,112 89,963 43, /24/2009 Wednesday 7,897 87,102 43, /25/2009 Thursday 1,002 82,059 39, Average, gph 7,781 99,409 47, mgd cfs Reclaculate average by 1. Removing values less than 15, Removing values greater than 105, Utilizing the max 7 day average Date Day Min Max Avg 7 day avg Min Max 6/13/2009 Saturday ,295 6/14/2009 Sunday ,206 6/15/2009 Monday ,525 6/16/2009 Tuesday , /17/2009 Wednesday ,011 6/18/2009 Thursday ,073 6/19/2009 Friday ,083 6/20/2009 Saturday /21/2009 Sunday ,574 gph /22/2009 Monday mgd 6/23/2009 Tuesday /24/2009 Wednesday Avg Flow, Min Flow. Peak Flow, 6/25/2009 Thursday cfs Cfs cfs Peaking Factors Average, gph 15,726 95, mgd cfs Percent of avg Dexter Wilson Engineering, Inc Siphon Pre-Design at Vista Canyon
37 APPENDIX C HDPE DIMENSION RATIO (DR) CALCULATIONS
38
39
40
41
42
43
44
45
46