Expert Working Group Meeting on
|
|
|
- Joy Boyd
- 5 years ago
- Views:
Transcription
1 Expert Working Group Meeting on Universal Access to Modern Energy Services, Renewable Energy, Energy Efficiency and Cleaner Use of Fossil Fuels UNCC, Bangkok 14 December 2017
2 Accelerating the energy transition


3 Trends in the energy sector But in the electricity sector renewable energy accounts for the majority of new capacity installed every year Global energy mix still dependent on conventional non-renewable energy

4 Ongoing power sector transformation Dramatic increase of RE in the global generation mix RE capacity installed in year 2016: 71 GW solar 51 GW wind 30 GW hydropower 9 GW biomass Around 25% renewable power generation share worldwide

5 RE deployment Region s Share in Global RE ~40% hydropower ~ 42% solar & wind ~30% geothermal & bioenergy 817 GW 38% of World Total

6 Renewable energy potential Irena.org/globalatlas
, 2010 and 2016 costing.irena.")
7 RE Costs - Trends Levelised costs of electricity for utility scale power (ranges and averages), 2010 and 2016 costing.irena.org


 RPO Auctions 0 2005")
8 Key role of enabling policies Types of renewable energy policies and measures Number of countries with renewable energy policies, by type FIT (FIP) RPO Auctions

9 Renewable Energy Auctions RE Auctions - Recent highlights

10 Policy trends - Auctions Evolution of utility-scale solar PV prices in selected countries


11 The power sector transition Major shift in the EU over the past 20 years Annual gross aggregated electricity production from gas-fired, solar and wind electricity plants in the European Union

12 Increasing generation from VRE
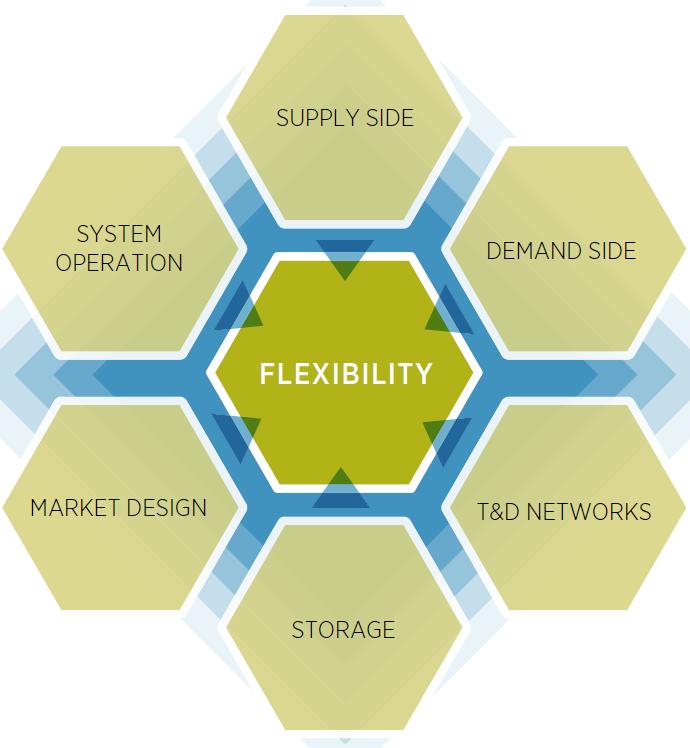
13 Need for flexibility
 (2012) Adapted from CESP, MAVIR, PSE SA and SEPS, 2013")
14 Crucial role of transmission and distribution grids Average unscheduled cross-border power flows from Germany (MW) (2012) Adapted from CESP, MAVIR, PSE SA and SEPS, 2013

15 Rethinking distribution networks and distributed energy resources Distributed generation, demand response, distributed storage, smart systems, electric vehicles will play a fundamental role in the power system transition Take into consideration benefits for the consumers and for the system as a whole Crucial role of distribution networks.and Smart systems Sample day load profile and self consumption from PV for a plastic manufacturing company


16 Off-grid RE for energy access IOREC 2012 : Ghana IOREC 2014 : Philippines IOREC 2016 : Kenya

, Renewable Energy and Jobs Annual Review")
17 Renewable energy jobs globally today Employment by Country Including Large Hydropower 1.1% Excluding Large Hydropower Source: IRENA (2017), Renewable Energy and Jobs Annual Review %
18 THANK YOU

, Renewable energy target")
19 Targets in the global renewable energy landscape 173 countries have at least one type of renewable energy target up from 43 in 2005 Source: IRENA (2015), Renewable energy target setting.

20 Ambitious acceleration needed To meet sustainable development goals and decarbonise global energy use, renewables need to be scaled up significantly.
 CAISO - California (CAISO,")
21 Flexibility and Market Design Net load ramps for different penetration levels of solar PV ERCOT Texas (MIT, 2015) CAISO - California (CAISO, 2016)


 Risk of")
22 Weaknesses Strengths Auctions strengths and weaknesses Auctions 70 Number of countries that have adopted auctions Flexibility in the design according to conditions and objectives Permit real price discovery Provide greater certainty regarding prices and quantities Enable commitments and transparency Are associated with relatively high transaction costs for both developer and auctioneer Based on REN21 Global Status Report (2005 to 2016) Risk of underbuilding and delays


23 Key role of technology innovation Value spatial complementarities - interconnections Electrification of other sectors Electric Vehicles Encourage Flexibility Value complementarities in VRE Decentralized system System Operation Market regulation RE Tech. Enabling Infrastructure Business Models Digitalization - IoT Platform business model
24 Emerging Innovations: E-mobility Storage and Electric Vehicles Smart Charging (mobile storage) Provide flexibility to the grid Grid Services: Primary and secondary reserves: Enhanced Frequency Response Frequency Containment Reserve Frequency Restoration Reserve Energy Shifting Behind-the-meter: Solar self consumption Community Storage Increased Power Quality Peak shaving Grid to Vehicle (G2V): Load management: peak shifting Vehicle to Grid (V2G): Primary and secondary reserves Other ancillary services Energy shifting Vehicle to Home (V2H): Solar self consumption Increased Power Quality Peak shaving
 FOR BASE LOAD AND/OR ANCILLARY SERVICES NEGLIGIBLE ENVIRONMENTAL AND")
25 Not only solar and wind Geothermal energy: main benefits STABLE RENEWABLE ENERGY SOURCE AVAILABLE 24/7 REDUCED ENERGY DEPENDENCY, STABLE JOBS AND LOCAL ECONOMIC DEVELOPMENT Geothermal heated greenhouse in Hveragerdi, Iceland HIGH AVAILABILITY FACTORS (~90%) FOR BASE LOAD AND/OR ANCILLARY SERVICES NEGLIGIBLE ENVIRONMENTAL AND VISUAL IMPACT


26 Why the modest growth? HIGH UPFRONT COSTS AND RISKS ASSOCIATED WITH RESOURCE ASSESSMENT LACK OF INSTITUTIONAL CAPACITY POLICY UNCERTAINTY SHORTAGE OF SKILLED PROFESSIONAL ENVIRONMENTAL CONCERNS AND LICENSING Can international cooperation and partnerships help overcome key geothermal challenges?
27 The role of Geothermal Global Geothermal Alliance is the platform for improved dialogue and coordinated action among key geothermal stakeholders to scale up geothermal deployment MW 70,000 60,000 50,000 40,000 30,000 20,000 Geothermal Power Installed Capacity Worldwide Up to 5x geothermal power More than 2x geothermal heat by ,175 10,000 10,897 12,635 6,832 7,972 8, Neutrality and transparency Build on what is on the ground and scale up No bureaucracy A Joint Communiqué issued at the GGA Launch transformative potential Unlocking projects facing policy, legal, regulatory, fiscal, funding, capacity building challenges

28 Strong Commitment to GGA Over 70 Members and Partners GGA MEMBERS - 42 COUNTRIES ACCROS THE GLOBE AMERICAS / CARIBBEAN Argentina Bolivia Chile Colombia Costa Rica Ecuador El Salvador Guatemala Honduras Mexico Nicaragua Peru Saint Vincent & Grenadines USA IDB OAS US Geothermal Association US Energy Association Canadian Geothermal Association EUROPE GLOBAL IRENA International Geothermal Association IsDB UN Environment WB ESMAP France Iceland Italy Netherlands Poland Romania Switzerland Turkey Nordic Development Fund European Geothermal Energy Council GeoEnergy Celle e.v. (Germany) Iceland Geothermal Cluster GeoDeep (France) Geothermal Power Plants Investors Association (Turkey) AFRICA Burundi Comoros Djibouti Egypt Kenya Tanzania Uganda Zambia Zimbabwe AfDB AUC EAPP NEPAD RCREEE SAPP GGA PARTNERS 31 INSTITUTIONS ACROSS THE GLOBE India Indonesia Malaysia Pakistan Philippines ASIA PACIFIC / OCEANIA Fiji New Zealand Papua New Guinea Solomon Islands Tonga Vanuatu SPC


29 GGA Action Plan and priorities Adopted by GGA Members in May 2016 Resource and Market Assessment Needs and Obstacles Assessment Enabling Frameworks Networking and Outreach

30 Scaling-up off-grid renewable energy deployment : IOREC Platform Objective Identify key barriers and drivers for stand-alone and mini-grid RE system deployment Platform to share experiences, lessons learned and best practices IOREC 2012 : Ghana IOREC 2014 : Philippines IOREC 2016 : Kenya Conference outcome papers available at:

31 Key Elements of an Enabling Environment Cooperation between public and private sector is essential

32 Policies and Regulations for Private Sector Renewable Energy Mini-grids LEGAL AND LICENSING PROVISIONS ACCESS TO FINANCE COST RECOVERY AND TARIFF REGULATION RISK OF MAIN- GRID ARRIVAL Download at


33 Capturing the cross-sector development impacts Off-grid systems to be deployed towards livelihoods and services to maximise sustainability and socio-economic benefits


34 Renewables and Human Development Health and the Food Chain POWERING HEALTH FACILITIES % of district hospitals without reliable electricity Sub-Saharan Africa FOOD CHAIN Irrigation Solar pumping Agro-processing Improved water mill Agro-processing Food drying
35 35 Renewable Energy Deployment Region s Share in Global RE Capacity ~1/2 hydropower 1/3 solar & wind 1/4 geothermal & bioenergy 780 GW 1,570TWh 40% of World Total
36 36 ASIA: Vast Renewables Potential


37 37 Renewable Energy Deployment Region s Share in Global RE Capacity ~1/2 hydropower 1/3 solar & wind 1/4 geothermal & bioenergy 780 GW 1,570TWh 40% of World Total