Tidal Marshes. Stephen Crooks Ph.D. Conservation International and Environmental Science Associates
|
|
|
- Amelia Beasley
- 5 years ago
- Views:
Transcription

1 Tidal Marshes Contribution to Climate Change Mitigation and Adaptation Stephen Crooks Ph.D. Conservation International and Environmental Science Associates UNFCCC Workshop on technical and scientific aspects of ecosystems with high-carbon reservoirs not covered by other agenda items under the Convention Oct 26 nd 2013, Bonn, Germany.

2 Wetlands Feed Fish (floodplain fatties) Photo: Jeff Opperman. Research by Carson Jeffres

3 ESA 37 years of restoration experience 1400 wetlands projects
4

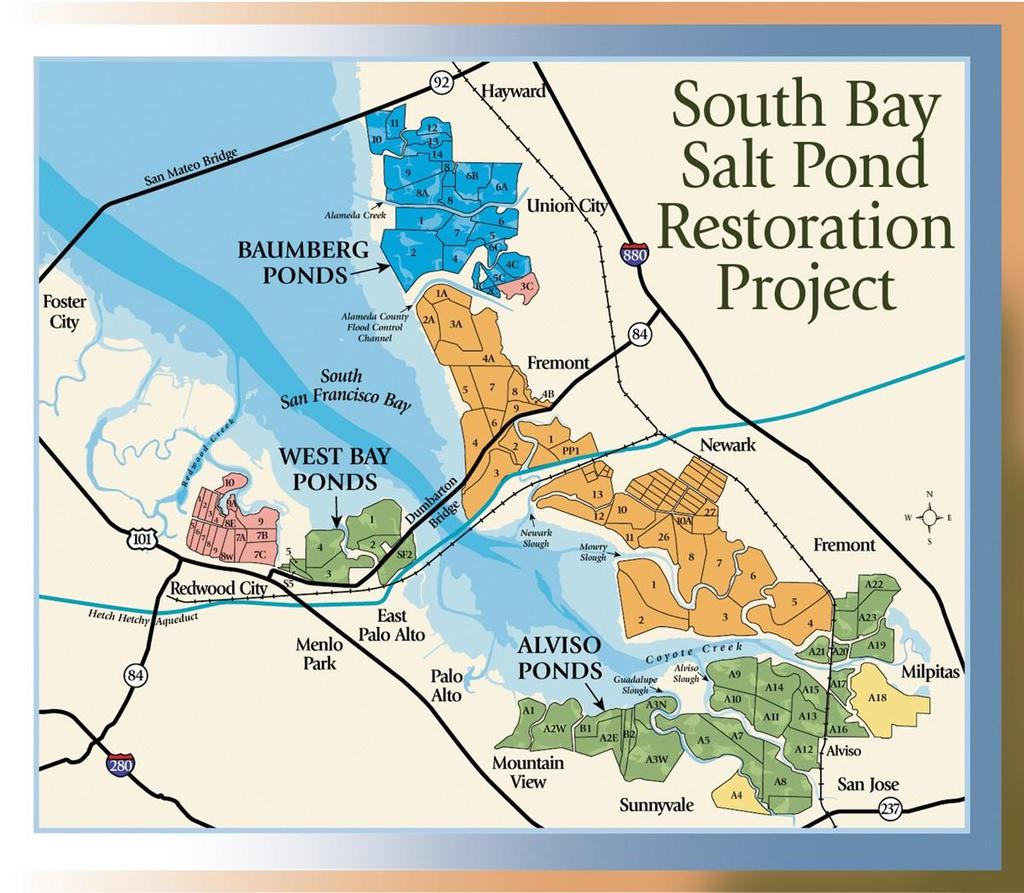
5 Restoration planning for 26,000 ha of wetlands $3 billion dollars cost estimate Plan part of state water management and climate change adaptation Modeling of wetland response to sea level rise


6 6 Continuum of coastal ecosystems loss over time Pre-Mediaeval The Humber Estuary Extensive diked wetlands Post industrial estuary Agricultural run-off Now 405 km of levees 870 km 2 of drained wetlands C deposition >99% decrease Release of historic carbon Andrews et al., 2000, 2006
7 7 Long term carbon sequestration
8 Distribution of carbon in coastal ecosystems 8 tco 2 e per Hectare, Global Averages Seagrasses Tidal Salt Marsh Estuarine Mangroves Oceanic Mangroves Soil-Carbon Values for First Meter of Depth Only (Total Depth = Several Meters) Mean soil organic carbon All Tropical Forests Mean living biomass Data summarized in Crooks et al., 2011; Murray et al., 2011, Donato et al., 2011

9 Drainage brings carbon loss Surface from SRTM Volume calculated between marshplain elevation and present day land surface


10 Drainage is wide spread in coastal areas The Humber -Wash: 1.4 billion tons of CO 2 released

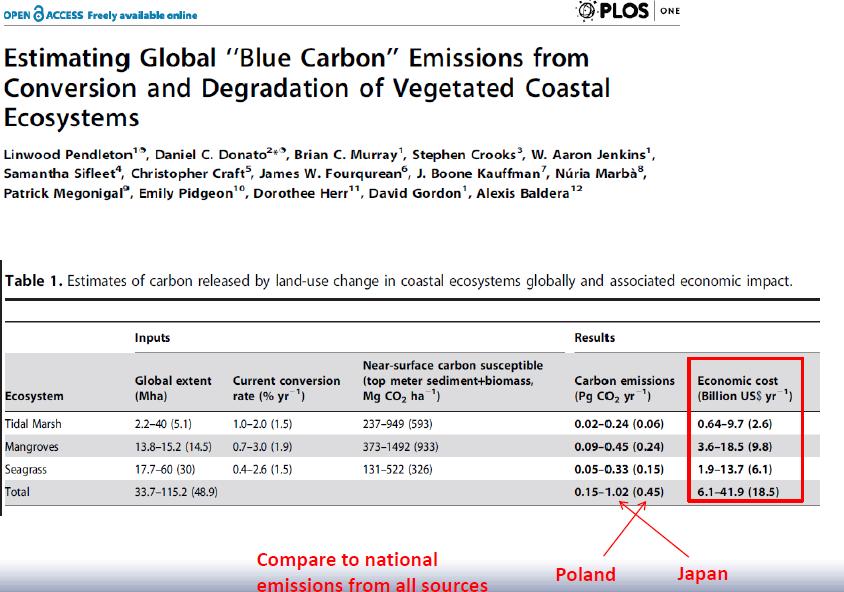
11 Unaccounted CO 2 Emissions from Drained Wetlands 0.3 GtCO GtCO 2 >5GtCO 2?

12 Vistula Delta
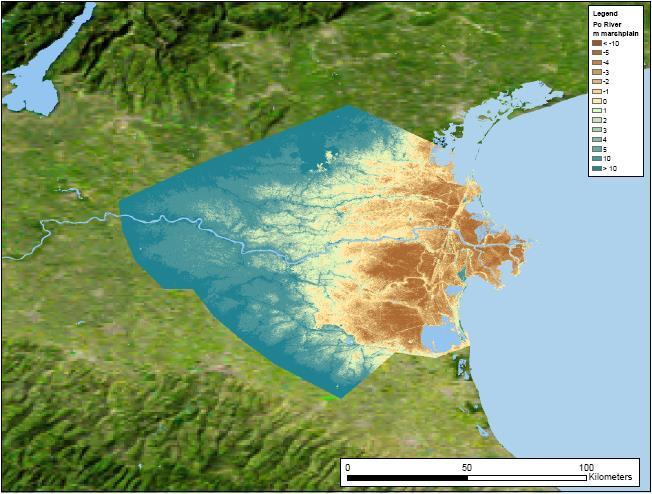
13 Po Delta

14 Nile Delta S
15


16 Historic San Francisco Estuary


17 Long-term release of carbon from organic soils Sacramento - San Joaquin Delta

 1 inch 3-5 million tco")


18 Emissions from One Drained Wetland: Sacramento-San Joaquin Delta Area under agriculture 180,000 ha Rate of subsidence (in) 1 inch 3-5 million tco 2 /yr released from Delta 1 GtCO 2 release in c.150 years 4000 years of carbon emitted Equiv. carbon held in 25% of California s forests Accommodation space: 3 billion m 3


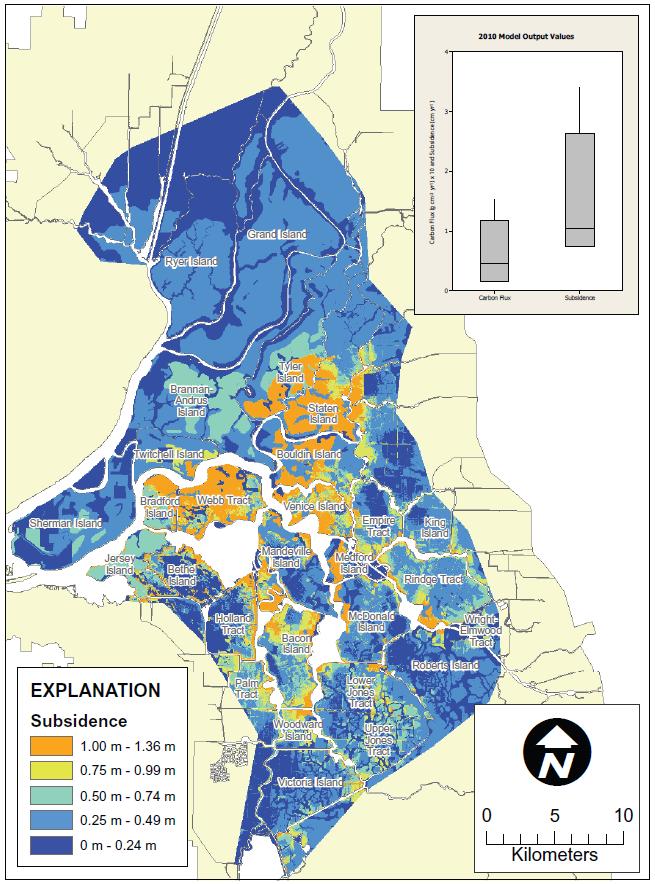
19 Deverel and Leighton 2010 Projected Subsidence


20 Subsidence of SJ-Sacramento Delta Peatlands Problem Solution Peat restoration through wetland restoration West Pond 25 cm deep East Pond 55 cm deep from Ingebritsen et al ha of experimental wetlands on Twitchell Island


21 Land Surface Change (in) Carbon Capture Wetland Farm Bio-Sequestration Stops peat oxidation and accretes proto-peat rapidly Continuously submerged about 1 ft Low oxygen conditions Balance between plant growth and reduced decomposition Average annual soil sequestration: 1 kg C m -2 yr -1 in soil proto-peat ACCRETION U.S. Department of the Interior U.S. Geological Survey PROBABLE SUBSIDENCE MT CO 2 ha -1 y MT CO 2 ha -1 y Miller et al. 2008, SFEWS
22 cm Experimental Wetland Peat Accretion: Surface Elevation Average gain of 2 inches per year Average gain of 1 kg carbon per m -2 per year Emergent Marsh, 25cm shallow, west wetland Emergent Marsh, 55cm deep, east wetland Submerged or floating aquatic vegetation, deep east wetland 10.7 cm / yr 48 cm 35 cm Miller et al. 2008, SFEWS
23 Net GWP Fluxes (from Eddy Covariance April ) Wetland Corn MT CO 2 eq ha -1 y -1 = ( ) = -31 CO 2 CH 4 N 2 O CO 2 N 2 O GWP U.S. SurveyDepartment of the Interior
. 2000 of readily restorable land, (1000 restoration planned) would sequester 1.")
24 Snohomish Estuary (draft data) 4000 ha original marsh, 600ha remaining. Mostly converted to agriculture and abandoned agr (wet soils). Subsided by c.2m 4.4 Mt CO2 released since 1930 (conservative estimate) of readily restorable land, (1000 restoration planned) would sequester 1.5 Mt CO2 Sea level rise would add to sequestration by restored wetlands. Snohomish represents about 10% of drained tidal marshes in Puget Sound (in progress)
25 Ebey Island Natural restoration 1960s Building soil 1.6 cm year
26 Snohomish Estuary: soil carbon sequestration (draft data) Site Name Land for type Sediment Accretion rate (cm / yr) Quiladeda Marsh Carbon accumulation rates (Mg CO2/ha/yr) Natural marsh Heron Point Forest wetland Otter Island Forest wetland North Ebey Restoring marsh Spencer Island Restoring marsh
27 What about remaining and restoring wetlands, and their response to sea level rise?
28 Elevation (m MHHW) Marshplain evolution trajectory A simple world Temporal and spatial variability Limiting factors that could affect endpoint Low sediment supply Wind-waves Approx colonization elevation Outer Muzzi Carl's Marsh Warm Springs Years Since Breach


29 Wetland Sedimentation Approximate vegetation threshold Using methods from Krone 1987.
30 Low Marsh Response to SLR for Ranging Sediment Availability SLR Scenario: NRC-III Organic sedimentation rate: 1.0 mm/yr SSC: 300 mg/l (very high) SSC: 150 mg/l (high) SSC: 50 mg/l (low) Modeled with Marsh98

31 Stralsburg et al. 2011
32 Conclusions Emissions from coastal marshes are significant. Distribution of ongoing and new emissions uncatalogued. Emissions from converted wetlands greater than restoring wetlands, though exceptions exist. Collection of Tier 2 emissions factors would inform regional accounting, refined for local ecological and activity conditions.

33 33 Stephen Crooks Director Climate Change Services ESA PWA