CDOT s Pavement M-E Design by Jay Goldbaum Pavement Design Program Manager
|
|
|
- Leo Burke
- 5 years ago
- Views:
Transcription


1 CDOT s Pavement M-E Design by Jay Goldbaum Pavement Design Program Manager
2 Welcome to the future of pavement design

3 Aliases MEPDG = Mechanis/c- Empirical Pavement Design Guide DARWin- ME = Design, Analysis and Rehabilita/on for Windows - Mechanis/c Empirical
4 Objectives Why implement Pavement M- E Design Describe new Pavement M- E Design process Why did CDOT need to calibrate the sofware Future of M- E design


5 Why Implement Design Guide? Many Benefits! Superior engineering tools Economic savings Improved management of highway network Innova/ve contrac/ng tools
6 Objectives Why implement Pavement M- E Design Describe new Pavement M- E Design process Why did CDOT need to calibrate the sofware Future of M- E design

7 Pavement Mechanistic-Empirical Design


8 Pavement Mechanistic-Empirical Design Climate Stations

9 Pavement Mechanistic-Empirical Design Material Property Inputs Poisson s Ra/o Axial to lateral strain ra/o Modulus Resistance to deforma/on Strength Resistance to fracture Other Engineering Proper5es


10 Menu bar Traffic Explorer General Climate information Pavement structure Pavement material layers Analysis criteria Project-specific calibration factors Optimization & sensitivity Layer information Report Colorado calibration factors Error list ARA Proprietary 2011 Applied Research Associates, Inc. Progress bar 3-10 Copyright All rights reserved. Applied Research Associates, Inc.


11 Loading PaAern Dynamic Modulus Test Axial Load E* = σ o /ε o
12 Comparison of E* Level 1 (Lab) vs Level 3 (Defaults) Mix FS (PG & SX) Dynamic Modulus, psi ME Design Defaults Lab Measured Reduced Frequency, Hz

13 Input

14

15


16 Indirect Tensile Strength Level 1 vs Level 3 Mix ID Mix Type Binder Grade FS Conv HMA PG FS SMA PG FS Conv HMA PG FS Conv HMA PG FS PMA PG FS Conv HMA PG FS PMA PG FS PMA PG FS SMA PG Level 1 Level 3 Measured Predicted Paired t- test Sta5s5cally Significant Difference

17 Output


18

19 Output

20 Output

21 Output
22 Output
23 Objectives Why implement Pavement M- E Design Describe new Pavement M- E Design process Why did CDOT need to calibrate the sofware Future of M- E design


24 Why Calibrate Single Axle Tandem Axle
25 Why Calibrate Colorado Measured vs. Global Predicted Rudng (New HMA & HMA over HMA)
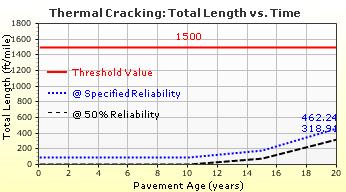
26 Predicted and Measured Transverse Cracking
27 R 2 = 48 percent SEE = 10.4 in/mi N = 57 Measured & Predicted HMA IRI
28 IRI = HMA Smoothness (IRI) Model ( SF ) + C2( FC ) + C3( TC) C ( RD) IRIo + C1 Total + 4 where: IRI o = ini/al IRI, in/mi SF = site factor (based on site condi/ons) FC Total = alligator, longitudinal, & reflec/on cracking in the wheel path), % lane area TC = transverse cracking, F/mi. RD = rut depth, in

29 New HMA Calibration Sites

30 HMA over HMA Calibration Sites

31 Calibration Test Section

32 Non-Destructive Testing CDOT performed FWD tes/ng in a separate effort Tes/ng on HMA sec/ons performed every 25 F Some issues noted with data collec/on


33 4 cores from lane- center for thickness and lab determined volumetric proper/es Wheelpath cores taken to determine rudng Cores taken at longitudinal wheelpath cracks to determine top- down or bojom- up cracking HMA Coring

34 Collect samples from 2 core lane- center holes Remove water from core hole Hand auger to retrieve base and subgrade samples Seal samples in plas/c bags and label Classify soil and determine moisture content in lab Base and Subgrade Samples

35 I- 25 near Colorado Springs SH 82 near Glenwood Springs Colorado Blvd in Denver Trenching

36 Trenching
37 Model Coefficients Final HMA IRI Model Global Calibration Coef. CDOT Local Calibration Coef. C1 (RUT) C2 (FATIGUE) C3 (TRANSVERSE) C4 (SITE)
38 Timeline and Implementation in Colorado 2001: Develop HMA and PCC Roadmaps 1996: AASHTO sponsored Research to develop MEPDG 2007: Update Roadmaps July 1, 2014 CDOT Implements Pavement M- E Design for use on all projects 2009: Begin Calibra5on/Valida5on Efforts 2013: Final Report on the Calibra5on Effort
39 Objectives Why implement Pavement M- E Design Describe new Pavement M- E Design process Why did CDOT need to calibrate the sofware Future of M- E design
40 Future Enhancements AASHTO Joint Taskforce Commijee On Pavements and ME Design product task force is responsible for future upgrades & improvements. Improvements are on a pay- as- you- go basis using licensing fees.


41 MAP M-E


42 Super Heavy Loads
43