9 th Annual Gas Turbine Conference
|
|
|
- Joseph Atkins
- 5 years ago
- Views:
Transcription


1 9 th Annual Gas Turbine Conference Performance Monitoring for Fuel Efficiency 16 th April
2 Agenda ACTSYS Overview Thermodynamic Performance Monitoring of Power Plants Case Studies Limitations of Online Monitoring Systems
3 Actsys Overview About Us Services Singapore Based Company Incorporated 2001 Operating regionally (Malaysia, Indonesia, Thailand, India) Core expertise Thermodynamic Performance Analysis Process Simulation / Pinch Analysis Utilities System Optimization Basic Engineering Design Operations and Maintenance experience Domain knowledge Power Plants, Refineries, Petrochemicals Accredited as Energy Service Company by Singapore National Environmental Agency
4 Actsys Overview About Us Services Power Plant Thermodynamic Performance Analysis Energy Auditing for Improvement Opportunities Measurement & Verification Energy Management System Online Dashboards ISO50001 Gap Analysis Process Studies and Front End Design Training Plant Operating Principles Energy Auditing / Performance Monitoring
5 Power Plant Customers Plant ID Location Remark CCP Steam Plant Cogen Tuas Power Singapore MHI 701F Alstom GT x x 1 PT PJB, Muara Karang Indonesia 500 x x 2 PT PJB Gresik Indonesia 480 x x 2 PT PJB Paiton Indonesia Coal 400 x 2 Power Seraya Singapore Siemens V x x 6 Senoko Singapore Alstom GT x 3; 450 x 2 Gulf Electric, Samutprakarn Thailand GE Frame x 1 Gulf Electric, Nongkhee Thailand GE Frame x 1 Malakoff Malaysia GE Frame 9E 370 x 1 SembCorp Singapore GE Frame 9E 800 x 1 Petronas Malaysia GE Frame 5 36 x 5 Jimah Malaysia Coal 700 x 2 Indonesia Power, Labuan Indonesia Coal 300 x 2 Total MW
6 Thermodynamic Performance Monitoring Early work with Power Plants to calculate GT compressor efficiency, to evaluate OEM wash frequency recommendation Thermodynamic modeling approach novel to most Power Plant engineers and initial acceptance was cautious Collaborative development of heat balance, new & clean, incremental improvement calculation methodologies to address customer needs Better understanding of plant efficiency losses by components Identification of maintenance requirements Post turnaround evaluation of maintenance effectiveness Continuous development of analysis methodology with increasing customer base
7 Performance Monitoring Objective Proactively identifying the plant sections that have degraded performance Quantifying the degradations in terms of effect on overall plant efficiency Enabling a condition based predictive maintenance program to set and prioritize maintenance activities that will minimize degradation and hence maximize efficiency
8 Performance Monitoring Objective Actual and Potential Efficiency Improvement GT Compr Cold Wash % % % % % % % Nov 06 Dec 06 Jan 07 Feb 07 Mar 07 GT Compressor Fouling 0.051% 0.150% 0.320% 0.423% 0.030% BFP Inefficiency 0.012% 0.020% 0.025% 0.026% 0.026% LP Bypass 0.300% 0.320% 0.288% 0.310% 0.310% HP Bypass 0.150% 0.150% 0.150% 0.150% 0.150% Condenser Fouling 0.085% 0.092% 0.224% 0.225% 0.225% IAF Pressure Drop 0.005% 0.022% 0.033% 0.054% 0.054% Actual Efficiency % % % % %
9 Thermodynamic Models Heat and Mass Balance calculations of all hot gas path, steam and water flows in a Power Plant Equipment are all rigorously modeled based on first principles of heat transfer and energy conversion Models can be tuned to replicate Design or Commissioning Heat Balances, in order to calculate New & Clean performance
10 First Principles of Heat Transfer
11 First Principles of Energy Conversion Adiabatic expansion in Steam Turbine Spencer Cotton Canon for expected Isentropic efficiency Modified Stodola equation for Pressure Flowrate characteristics
12 CCP Plant Modeling HPBFW 2 HPBFW 1 LPDEAR GLNST M BFW SPP DEAER S38 HPBYPS S59 SP3 S37 HPSTOT ST Power kw IPST S26 LPST S55 S48 BFW HDR S50 S51 HPBFW P HPBFW DFW IPBFW SP5 SP6 V1 PI3 HPST LPST OT M6 S52 IPBFWP CONDSR S39 S40 S60 M3 CWS V2 CWR LPBFWP S47 S54 MAKEUP PI1 S57 S58 HPBPSS S43 SP4 S45 S44 S46 PUMP1 GLNDCN S53 PI2 HPSDSH M4 S49 M5 LPBFW HPS LPS S31 S30 COND IPS S35 S23 S36 S24 S22 S1 S3 RHDSH S25 S33 S32 S29 S27 RHTRS S34 S28 S13 HPECO1 S15 HPSH2 S5 S6 S7 S8 S9 S10 S11 S12 S17 S18 S19 S20 S21 STACK SP1 S4 M1 SP2 M2 S14 S16 RHTR1 HPSH1 HPEVAP HPECO2 IPSHT R LPSHTR IPEVAP S2 LPEVAP HPECO0 IPECO1 LPECO FWPRHT S56 RHTR2 IPECO2 GT EXH DUCT 1 FUELGS GT COMB CMPDSC GT COMP T URBIN GT TURB GT Power kw S41 Gross Generator Output MW AIR COMPIN S42 SSGEN INLFLT


13 Power Plant Modeling Capabilities GT GT Power Generation GT Comp Eff. GT Turbine Eff GT Heat rate IAF performance Distribution Valve passing Line Loss HRSG HRSG Effectiveness Duty of individual heat transfer components Auxiliaries CCP Power Station CWP Performance BFP Performance CEP Performance Steam Turbine HP Turbine Power IP Turbine Power LP Turbine Power HP/IP/LP Turbine Eff Condenser Condenser Water Flow Condenser Duty Condenser effectiveness
14 Performance Monitoring Methodology Modeling Application To make a Complete Heat and Mass Balance Establishing current performance level of individual components and total system Establishing the New & Clean benchmark for the individual component and for total system Calculate the incremental benefit from repairing defective plant component
15 Heat & Mass Balance Complete quantification of all streams in a power plant eg flue gas, cooling water, steam and fuel flows Establish the present performance level of the individual equipment eg efficiency, heat transfer coefficients, leakages Enables data validation Measured values can be compared against the heat balance output for validating the accuracy of measurement.
16 CCP Plant Modeling Heat Balance Simulation Model Demo
17 Quantifying GT Compressor Fouling GT Compressor Isentropic Effciency Daily avg >330MW GT Comp Wash 40K CI GT Comrpessor Wash GT Comp Wash 48K EOH GT Comp Wash /1/05 3/2/05 5/1/05 6/30/05 8/29/05 10/28/05 12/27/05 2/25/06 4/26/06 6/25/06 8/24/06 10/23/06 12/22/06 2/20/07
18 GT IAF Selection Optimization GT Comp Isentropic Efficiency CCP1 EMW VS Freudenburg IAF EMW Filter Nov 05 ~ May 06 Freudenburg Filter from Dec Days IAF Pressure Drop mmh2o CCP1 EMW VS Freudenburg IAF Days EMW Filter July ~ Dec 2005 Freudenburg Filter from Dec

19 Loss of CCP Efficiency due to IGV adj

20 Loss of CCP Efficiency due to IGV adj
21 Loss of CCP Efficiency due to IGV adj

22 Loss of CCP Efficiency due to IGV adj
23 Loss of CCP Efficiency due to IGV adj
24 Unmeasured Flows HP Bypass HPBFW 2 HPBFW 1 LPDEAR GLNST M BFW SPP DEAER S38 HPBYPS S59 SP3 S37 HPSTOT ST Power kw IPST S26 LPST S55 S48 BFW HDR S50 S51 HPBFW P HPBFW DFW IPBFW SP5 SP6 V1 PI3 HPST LPST OT M6 S52 IPBFWP CONDSR S39 S40 S60 M3 CWS V2 CWR LPBFWP S47 S54 MAKEUP PI1 S57 S58 HPBPSS S43 SP4 S45 S44 S46 PUMP1 GLNDCN S53 PI2 HPSDSH M4 S49 M5 LPBFW HPS LPS S31 S30 COND IPS S35 S23 S36 S24 S22 S1 S3 RHDSH S25 S33 S32 S29 S27 RHTRS S34 S28 S13 HPECO1 S15 HPSH2 S5 S6 S7 S8 S9 S10 S11 S12 S17 S18 S19 S20 S21 STACK SP1 S4 M1 SP2 M2 S14 S16 RHTR1 HPSH1 HPEVAP HPECO2 IPSHT R LPSHTR IPEVAP S2 LPEVAP HPECO0 IPECO1 LPECO FWPRHT S56 RHTR2 IPECO2 GT EXH DUCT 1 FUELGS GT COMB CMPDSC GT COMP T URBIN GT TURB GT Power kw S41 Gross Generator Output MW AIR COMPIN S42 SSGEN INLFLT
25 Unmeasured Flows HP Bypass HPST Bypass Flow T/H Jan 15-Jan 29-Jan 12-Feb 26-Feb 12-Mar 26-Mar 9-Apr 23-Apr 7-May 21-May 4-Jun 18-Jun 2-Jul 16-Jul 30-Jul 13-Aug 27-Aug 10-Sep 24-Sep
26 Steam Turbine Sectional Performance Overall efficiency (%) 110% 100% 90% 80% 70% 60% 50% 40% Turbine Efficiency HP Turbine IP turbine LP Turbine Individual Section Power (kw) LPST Power IPST Power HPST Power Apr May Jun Jul Aug Sep Oct Nov Dec Jan Feb Apr May Jun Jul Aug Sep Oct Nov Dec Jan Feb-06
27 Boiler Feed Pump Efficiency Chart 23 CCP 1 : Boiler Feed Pump Efficiency Pump Efficiency Pump Efficiency Pump ID Pump ID Apr 15-Apr 29-Apr 13-May 27-May 10-Jun 24-Jun 8-Jul 22-Jul Power Consumption (kw) 5-Aug 19-Aug 2-Sep 16-Sep 30-Sep Boiler Feed Pump Performance Flow (TPH) Pump 2 Pump 1
 Debris Filter")
28 Condenser Cooling Water Flow Condenser Cooling Water Flow (T/H) Debris Filter Repaired
29 Performance Monitoring Methodology Modeling Application To make a Complete Heat and Mass Balance Establishing current performance level of individual components and total system Establishing the New & Clean benchmark for the individual component and for total system Calculate the incremental benefit from repairing defective plant component
30 New & Clean Performance Models Each piece of equipment modeled separately to match guaranteed data, then read by overall model COND matches HEI/condenser ST model matches ST vendor S10 CONDEN CONDST MAKEUP S15 CNDMIX S14 S3 S5 S9 S11 S6 S13 CNDPMP HPPUMP S8 S12 DEAER HRSG matches HRSG vendor S1 S7 S2 S4 EXH GT uses curves or spreadsheet data GT DUCT HPSHT HPEVAP HPECON
31 CCP Plant Modeling New & Clean Simulation Model Demo
32 New & Clean Performance Plant & Equipment Performance Gaps Actual Plant & Equipment Performance Indicators Target Plant & Equipment Performance Indicators Thermodynamic Simulation Heat Balance Model Heat Balance Calculated Plant Operating Conditions Thermodynamic Simulation New & Clean Models tuned to Design / Comm Measured Plant Data
33 HRSG Malperformance Gresik CCP2 HRSG2.1 Steam Prod 1.20 HP STM LP STM 1.00 Actual / N&C /24/ /1/ /8/ /15/ /22/ /29/2004 1/5/2005 1/12/2005
34 HRSG Malperformance

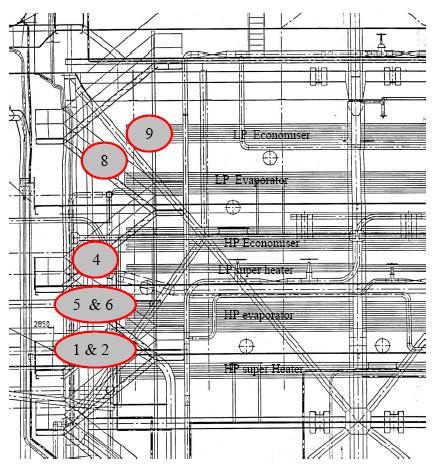
35 Fouled HRSG level 8
36 HRSG Deterioration Condensate Extraction Pump Bypass Valve Preheated Water To Deaerator E-3 V-1 Passing Valve Flue Gas Inlet Feed water Preheater Flue Gas to Stack
37 HRSG Deterioration Stack temp Vs Feedwater Preheater Temperature (Actual) / (New and Clean Performance) 1.10 Stack T Feedwater Preheater T Valve Repaired Jan Jan Jan Feb Feb Mar Mar-05 9-Apr Apr-05 7-May May-05 4-Jun Jun-05 2-Jul Jul Jul Aug Aug Sep Sep-05 8-Oct Oct-05 5-Nov Nov-05 3-Dec Dec Dec-05
38 Poor Steam Turbine Section Steam 3 ST Pow er Output HPST IPST LPST ST Actual / N&C /24/ /1/ /8/ /15/ /22/ /29/2004 1/5/2005 1/12/2005

39 Poor Steam Turbine Section

40 Condenser Performance Condenser Press ACT/NC Condenser Air Ingress Solved
41 Performance Monitoring Methodology Modeling Application To make a Complete Heat and Mass Balance Establishing current performance level of individual components and total system Establishing the New & Clean benchmark for the individual component and for total system Calculate the incremental benefit from repairing defective plant component
42 Incremental Benefit Analyses As Plant Management you are only interested in how a defective plant component affects Overall Plant efficiency / heatrate Baseload capability Quantification enables prioritization and scheduling of corrective maintenance in next turnaround
43 Incremental Benefit Analysis Actual and Potential Efficiency Improvement GT Compr Cold Wash % % % % % % % Nov 06 Dec 06 Jan 07 Feb 07 Mar 07 GT Compressor Fouling 0.051% 0.150% 0.320% 0.423% 0.030% BFP Inefficiency 0.012% 0.020% 0.025% 0.026% 0.026% LP Bypass 0.300% 0.320% 0.288% 0.310% 0.310% HP Bypass 0.150% 0.150% 0.150% 0.150% 0.150% Condenser Fouling 0.085% 0.092% 0.224% 0.225% 0.225% IAF Pressure Drop 0.005% 0.022% 0.033% 0.054% 0.054% Actual Efficiency % % % % %
44 Examples of Issues Identified Lost of efficiency after MI due to IGV reprogramming Boiler Feed Pump minimum flow recycle valve passing Identification of Passing HPST Bypass Valve FW Preheater Bypass Valve passing Selection of Optimum Inlet Air Filter Condenser Cooling Water Optimization Condenser Cooling Water Debris Filter Choke HPST Bypass Spray Valve Passing HRSG HP and RH Spray Valve Passing Condenser Air Ingress Condenser Tube Fouling

45 Limitations of Online Systems
46 Limitation of Online Systems Black box Plant engineers over time will suffer an increasing lack of knowledge of model calculations, which plant measurements are inputs and assumptions Plant component performance degradation results are still high level indicators, they do not lead to the actual problem eg detailed equipment level As all result screens are preprogrammed, drill down capability to determine root cause is limited Difficult to use results as decision support to determine corrective maintenance activities
47 Limitation of Online Systems Not all losses are calculated, eg Online models normally do not include bypass valves (eg HPST, FWPH) or recirc valves (eg BFW min flow); they are all assumed to be tight closed and not passing Drain valves are also assumed to be tight Steam flow to auxiliary steam header is not accounted for Above listed losses are common especially as a plant ages and if not detected and repaired can lead to very significant efficiency and water losses
48 Limitation of Online Systems Time trends of performance factors are very useful Detect Degradation trends Comparison of Performance Pre and Post inspection Change of plant components eg Inlet Air Filter Change of equipment control tuning eg IGV control curve Drifting of measurements X-Y plots of performance variables also offer insightful views into root cause of performance degradation Online systems offer little possibility for such analysis
49 Conclusions Thermodynamic Performance Monitoring ensures plant degradations that cause efficiency loss are identified and corrected early Skill set that needs to be fostered in today s competitive power industry Online systems have practical limitations and do not give the same in-depth analyses
50 Thank You COMPRESSOR WORK (.% of GT Shaft Power) INLET AIR (1.45%) CHEMICAL ENERGY (97.32%) FUEL SENSIBLE HEAT 1.00% ROTOR COOLING LOSS (2.09%) COMBUSTOR LOSS (0.49%) AUXILIARY POWER (0.22%) GT SHAFT POWER (34.23%) DUCT LOSS (0.35%) RADIATION LOSS (0.34%) HP STEAM (34.39%) HP TURB POWER (2.18%) IP STEAM (8.6%) PIPE LOSS (0.08%) SHAFT POWER IP TURB POWER (6.68%) LP TURB POWER (10.87%) CONDENSER LOSS 33.53% RADIATION LOSS (0.06%) RADIATION LOSS (0.09%) RADIATION LOSS (0.04%) LP STEAM (4.03%) STACK LOSS (8.97%)