Rejuvenating A Mature EOR Asset: Miscible CO 2 Flooding at SACROC. Mark Linroth Kinder Morgan CO 2 Company, LP December 7 th, 2012
|
|
|
- Stephany O’Neal’
- 5 years ago
- Views:
Transcription

1 Rejuvenating A Mature EOR Asset: Miscible CO 2 Flooding at SACROC Mark Linroth Kinder Morgan CO 2 Company, LP December 7 th, 2012
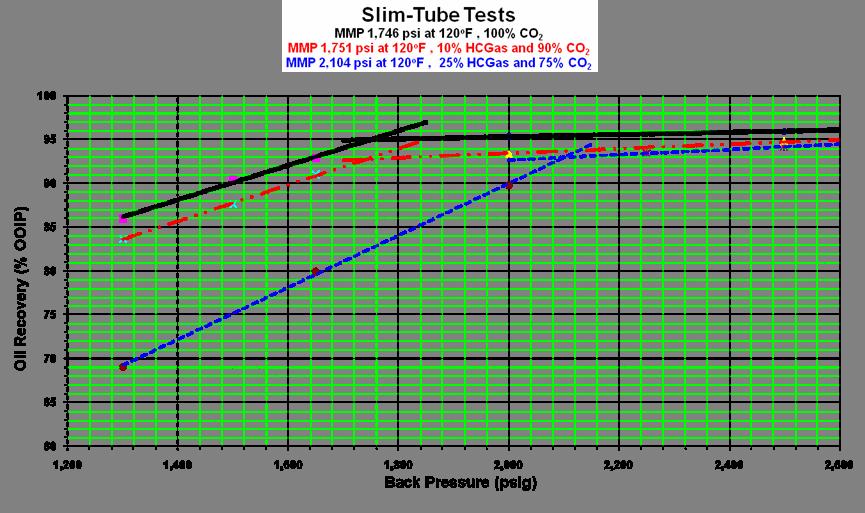
2 SACROC Unit (Canyon Reef) Discovered Nov, 1948 Formation Canyon Reef (Limestone) Depth ft. OOIP 2.8 BSTB Porosity 9% Permeability 30mD Reservoir Temp 125 o F Drive Solution Gas Gravity 42 o API Disc Pressure 3300 psig P b 1800 psig R si 1000 scf/bbl B o 1.65 rb/stb Viscosity 0.33 cp S oi 80% S orw 35% MMP 1850 psig 2
3 SACROC Unit (Canyon Reef) Discovered Nov 1948 Formation Canyon Reef (Limestone) OOIP 2.8 BSTB Gravity 42 o API Porosity 9% Permeability 30mD Reservoir Temp 130 o F Depth 6200 V DP 0.85 Disc Pressure 3300 psig R si 1000 scf/bbl B o 1.65 rb/stb Viscosity 0.33 cp S oi 80% S orw 36% P b 1800 psig MMP 1850 psig Drive Solution Gas 3
4 Regional & Geologic Setting Hockley Lubbock Crosby Dickens Wellman Field Terry Lynn Garza Kent Gaines Adair Field Mungerville Fld S. Brownfield Field Horseshoe Atoll Dawson 500' Oceanic Field Good Fld Vealmoor Field 500' Borden Diamond M Fld Von Roeder Fld Hobo Fld Howard Scurry Sharon Ridge Unit S. Von Roeder Fld Reinecke Field E. Vealmoor Fld Salt Creek Field Cogdell Field Kelly Snyder Fld SACROC Unit 0 20 Miles Midland Basin Oklahoma Texas 4
5 SACROC Unit Structure 5
6 SACROC Production Plot to
7 November BOPD Water Cut 0% N p 2,000 STB 12/15/2012 7

8 November ,000 BOPD Water Cut 1% N p 28 MMSTB RF 1% 12/15/2012 8
9 November ,000 BOPD Water Cut 9% N p 129 MMSTB RF 4.6% 9
10 November ,000 BOPD Water Cut 27% N p 528 MMSTB RF 19% 10
11 May ,000 BOPD 174 MMSCF CO 2 Water Cut 36% N p 552 MMSTB RF 20% 11
12 May ,000 BOPD 150 MMSCF CO 2 Water Cut 36% N p 680 MMSTB RF 24% 12
13 February ,000 BOPD 49 MMSCF CO 2 Water Cut 97% N p 1,223 MMSTB RF 44% 1 st Truly Miscible 13
14 April ,400 BOPD 118 MMSCF CO 2 Water Cut 95% N p 1,239 MSTB Cum CO 2 1.3Tcf 14
15 October ,000 BOPD 136 MMSCF CO 2 Water Cut 95% N p 1,244 MSTB 15
16 The Opportunity Saturation, Containment, Pressure, Injectivity, Connectivity Low CO 2 Injection Purchases Over distributed available CO 2 Resulted in low injection pressure No Classic Miscible CO 2 Flood Response Water decreasing & CO 2 increasing THE CO 2 WAS NOT MISCIBLE Swelled the Oil Reduced Viscosity IFT 0 16

17 The Opportunity 17


18 The Challenge At this rate & current oil price the field is uneconomic. The previous immiscible flood recovered little oil beyond secondary Can we improve the recovery with a fully miscible CO 2 flood? 18
19 Favorable Factors High K means fast processing rates (~25%/yr) Low viscosity oil 0.33 cp (favorable mobility ratio) Depth Deep enough for miscibility, not too hot Known lithology clean limestone, 100% Calcite Large unit able to expand by phases 19
20 Operational Changes Raise average reservoir pressure above MMP Convert rod pump to ESP to maintain higher P wf (objective to prevent loss of miscibility near wellbore) Use active water curtain to prevent external migration of CO 2 20
21 Operational Changes (cont.) Extend initial CO 2 slug, follow with dry WAG (many patterns were WAG sensitive and premature water injection led to loss of recovery) All injectors completed cased hole to control vertical conformance. SIGNIFICANT increase in CO 2 purchases 21

22 SACROC CO 2 Project Areas 16 Phases to date Avg. Dim. Oil recovery ~ 8.1% Avg dim CO 2 injected ~
23 Dim. Oil Recovery Curves 18% 16% Cumulative Oil Production (%OOIP) 14% 12% 10% 8% 6% 4% 2% 0% Cumulative Total Injection (HCPV) CL 1&2 CL 3 CL 4 CL 5 BE CR1 CR2 So. Plat SWCL GI
24 AFE vs. Actual Example South Platform Oil Production BPD 7,000 South Platform CO 2 Injection 6,000 MCFPD 250,000 5,000 4, ,000 3, ,000 2, ,000 1,000 50,000 0 Jan-08 Jan-09 Jan-10 Jan-11 Jan-12 Jan-13 Jan-14 Jan-15 Actual AFE Prior View ('11 Bud) Current View (3Q EG) 0 Jan-08 Jan-09 Jan-10 Jan-11 Jan-12 Jan-13 Jan-14 Jan-15 Actual AFE Prior View ('11 Bud) Current View (3Q EG) 24

25 Major Divisions The Canyon Reef is divided up into four major divisions Cisco Green Zone Upper Middle Canyon Lower Middle Canyon These are further subdivided into zones following the BEG convention Cisco Green Zone UMC LMC TZ 25
26 Dim oil Recovery vs. dim CO 2 Inj. 20 SACROC Cisco %EOR vs %HCPV CO2 Injected 20 SACROC Green Zone %EOR vs %HCPV CO2 Injected Allocated Cisco %OOIP EOR Recovery (Based on Injection Profiles) A= D= K= 1.05 Ar= C= W= Recovery SCALEUP Bullseye Patterns Allocated Green Zone %OOIP EOR Recovery (Based on Injection Profiles) A= D= K= 1.05 Ar= C= W= SCALEUP Recovery Bullseye Patterns Allocated Pattern Cisco %HCPV CO2 Injected Allocated Pattern Green Zone %HCPV CO2 Injected 20 SACROC Upper Middle Canyon (MCN3) Zone %EOR vs %HCPV CO2 Injected 20 SACROC Lower Middle Canyon Zone %EOR vs %HCPV CO2 Injected Allocated MCN3 Zone %OOIP EOR Recovery (Based on Injection Profiles) A= D= K= 1.05 Ar= C= W= Recovery SCALEUP Bullseye Patterns Allocated Pattern MCN3 Zone %HCPV CO2 Injected Allocated Lower Middle Canyon Zone %OOIP EOR Recovery (Based on Injection Profiles) A= D= K= 1.05 Ar= C= W= SCALEUP Recovery Bullseye Patterns Allocated Pattern Lower Middle Canyon Zone %HCPV CO2 Injected 26
27 Oil Rate vs. Time SACROC Unit Pattern PAT 58 2A 500 Actual BOPD 450 Forecast BOPD 450 Base Case, BOPD Forecast BOPD Cumul EOR Oil (MSTBO) Forecast Cumul Oil (MSTBO) 350 Base Case Cumul. MSTBO 350 Forecast Cumul Oil (MSTBO) 300 Oil Rate (BOPD) BOPD Cumulative Oil (MSTBO) /1/16 12/31/14 12/31/13 12/31/12 1/1/12 12/31/10 12/31/09 12/31/08 1/1/08 27
28 CO 2 Produced vs. Time SACROC Unit Pattern PAT 58 2A Actual CO2p MCFD Forecast CO2 MCFD Base Case MSCFD Forecast CO2 MCFD Cumul CO2 Prod (MMSCF) Forecast Cumul CO2 Prod (MMSCF) CO2 Production Rate (MSCFD) Base Case Cumul. MMSCF Forecast Cumul CO2 Prod (MMSCF) Cumulative CO2 Production (MMSCF) /1/16 12/31/14 12/31/13 12/31/12 1/1/12 12/31/10 12/31/09 12/31/08 1/1/08 28
29 Monitoring Tools Injection Profiles Used to determine zone(s) of injection Run once per year on each fluid Step rate tests Used to determine parting pressure Run once per year on water injectors 29

30 Vertical Conformance Injector Producer cross section showing dominant injection into one zone Significant amount of by passed pay 30


31 284 4 Before and After Plugback

 209 1")


32 Conformance Response (212 2, Polymer Jobs) Production response 5 BOPD to 36 BOPD Production response 8 BOPD to 100 BOPD Job cost: $185, Job cost: $405,173

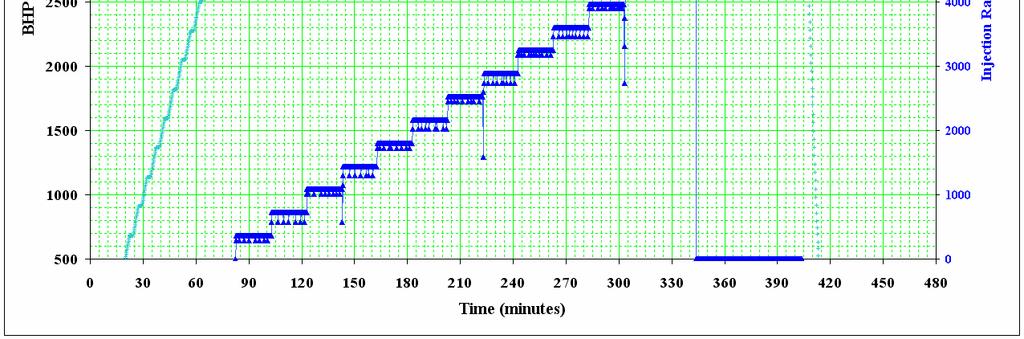
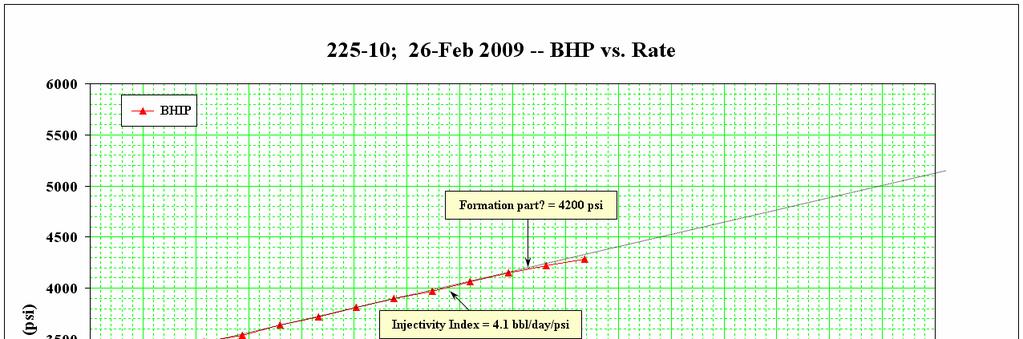
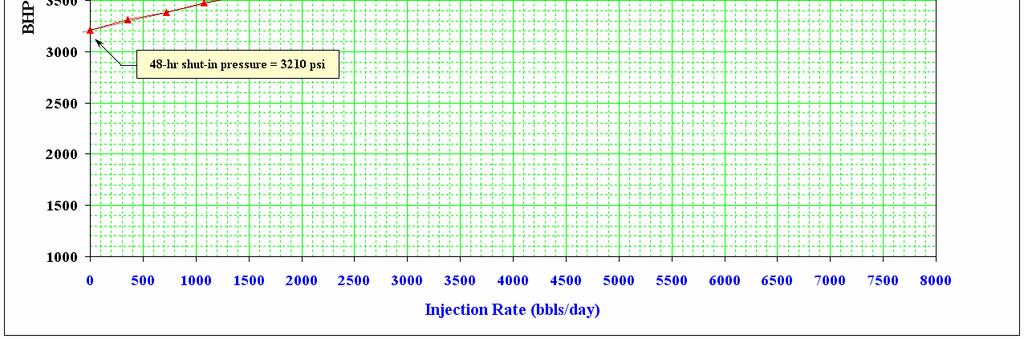
33 Step Rate Test 33


34 Areal Conformance Pressure & Rate rebalancing Attempts to viscosify CO 2 Surfactant pilot project 34

35 Examples of Pressure Re balancing Pattern production responded after 8 months drawdown of prior water curtain 35

36 Note streamlines show no support to November 2007

37 Note streamlines now show receiving support July 2008

38 BHP Monitoring All ESP s are equipped to record P wf and motor temp. This data is available in real time and can also be used to track reservoir pressure 38


39 CTF Pressure & Rate Response in Offset Wells PIP increase due to CTF in Production response 200 BOPD and lower GOR below 20,000
40 Pattern Rebalancing Incremental Oil Response Needs ESP Upsize High GOR Well CTF/SI as Required

41 SACROC Unit Structure 41
42 HS=57 Un Drained Pinnacles Subsea Depth(ft) Mae Lemens # /27/1950 <3,391FT> SACROC UNIT /9/2011 GR NEUT_PHI_NORM GR CNC REEF_TOP Subsea Depth(ft) REEF_TOP ECI1 ECI
43 HS=57 Un Drained Pinnacles Subsea Depth(ft) Mae Lemens # /27/1950 <1,599FT> SACROC UNIT /17/2011 <1,792FT> SACROC UNIT /9/2011 GR NEUT_PHI_NORM GR CNC GR CNC REEF_TOP Subsea Depth(ft) REEF_TOP ECI1 ECI

44 CO 2 Harvest RTP 44

45 CO 2 Harvest Upsize 45


46 Production Response Oil production rate has increased from 8800 BOPD to the current 30,000 BOBD. Cumulative incremental oil production since year 2001 now exceeds 110 MMSTBO 46
47 47

48 SACROC CO 2 Response 12/15/ SPE Dallas E&P Forum: Raising the Dead 48
49 X 49
50 X 50
51 X 51
52 Layer by Layer Forecasting Process Using the historical injection profiles determine the fraction of injected CO 2 entering each layer, and from the injection rate determine the %HCPV% CO2 injection with time into each layer From the generalized dimensionless recovery curves we calculate the dimensionless oil and CO 2 recoveries for each layer The Oil recovery equation A value is set to 15% initially, but it occasionally requires changing to history match performance Calculate the oil and CO2 production rates from the layer allocated CO 2 injection rate and the oil & CO 2 recovery derivatives Sum the layer oil & CO 2 production rates to get the pattern oil & CO 2 production. Calculate the water production by material balance 52
53 Outline Field History Geologic Setting Key Statistics Production History The Opportunity The Challenge Operational Changes Monitoring Rate Re Balancing Conformance 53